Time–temperature indicators for high temperature applications†
Charles E.
Sing
,
Jill
Kunzelman
and
Christoph
Weder
*
Department of Macromolecular Science and Engineering, Case Western Reserve University, 2100 Adelbert Road, Cleveland, Ohio 44106-7202, USA. E-mail: christoph.weder@case.edu; Fax: (+1)216-368-420
First published on 10th November 2008
Abstract
New thermochromic materials are reported, which are useful for application as time–temperature indicators (TTIs) in temperature regimes that are complementary to those accessible with existing technologies. The design approach involves incorporating small amounts (0.3–2.9 wt.-%) of the excimer-forming, photoluminescent chromophores 4,4′-bis(2-benzoxazolyl)stilbene or a cyano-substituted oligo(p-phenylene vinylene) derivative into ethylene/norbornene copolymers with glass transition temperatures (Tg) between 131 and 149 °C. These dye/polymer blends were melt-processed and quenched from homogeneous melts to below their Tg to kinetically trap the dyes in dispersed states, which exhibit monomer fluorescence. Upon annealing the materials above Tg, self-assembly of the dye molecules into aggregates that allow for excimer formation occurs, concomitant with permanent and pronounced fluorescence color changes. This approach yielded TTI materials that demonstrate a predictable, Arrhenius-type behavior and which are useful in a temperature regime from ∼130 to 200 °C. The kinetics of the color change were tunable on time scales between seconds and days by changing dye concentration, dye structure, or host polymerTg.
Introduction
The investigation and development of chromogenic polymers, which change their luminescence characteristics upon application of an external stimulus, have recently garnered significant interest.1Response to stimuli such as heat,2,3 deformation,3,4 chemicals,5 light,6 and others7 allows this class of materials to be useful as sensors in a wide range of technologies. We recently embarked on the exploitation of a novel and flexible approach for the creation of polymers with built-in sensors that can be tailored to respond to a vast array of stimuli.8 Mechanical deformation,9–12 pressure,13 humidity,14 and temperature threshold15–18 sensors can all be created using the same general scheme, which involves incorporating small amounts of excimer-forming photoluminescent chromophores into host polymers. Manipulation of the phase behavior and the morphology of these blends leads to pronounced changes in the fluorescent and/or absorption characteristics upon application of a stimulus. Threshold temperature sensors are created by the incorporation of a small amount of chromophore into a glassy host polymer by conventional melt-processing.15–18 Quenching the blends from the melt to below their glass transition temperature (Tg) results in kinetically trapped, thermodynamically unstable molecular mixtures of the sensor dyes and the host polymers in a glassy state. Subjecting these blends to temperatures above their Tg leads to irreversible phase separation and the formation of dye aggregates, concomitant with a permanent and pronounced change of the material's optical properties due to the formation of aggregates which allow for excimer formation and/or charge-transfer interactions. The kinetic response of this color change has been shown to follow an exponential decay with an Arrhenius-type temperature dependence, which can be tuned by changing the concentration, solubility, dye structure, and the Tg of the matrix polymer.16–18 These features makes these materials useful for time–temperature indicators (TTIs), which can monitor the thermal history of their environment via a permanent (fluorescence) color change that has matching kinetics with processes of interest that cannot be as easily observed.14,19 Several technologies for this purpose are available, but they rely on relatively complex multi-component devices that involve the diffusion of dyes or reactive chemicals through a substrate with a specified geometry.20 A survey of available sensors reveals an abundance of sensors that operate in the realm of 0 °C20 and some that are designed for higher temperatures (∼100 °C).21 Interestingly, technologies for TTIs that are useful at higher temperatures are scarce, but applications that would benefit from the availability of such devices are abundant. Examples include the monitoring of electronic components, indicators for sterilization processes, and thermal exposure measures for vehicles. In this paper we describe the successful application of the excimer aggregation approach to create TTIs designed for temperatures above 130 °C.Experimental
Materials
2-{4-[2-(4-Ethoxy-phenyl)-vinyl]-phenyl}-3-[4-(2-{4-[2-(4-ethoxy-phenyl)-vinyl]-phenyl}-2-isocyano-vinyl)-2,5-bis-octyloxy-phenyl]-acrylonitrile (C2-RY8, Fig. 1), was prepared as described previously.174,4′-Bis(2-benzoxazolyl)stilbene (BBS, Fig. 1), commonly known by the trade name Uvitex®OB-One, was purchased from Aldrich Chemical Company, Inc. and was used as received. TOPAS 5013 (Tg = 131 °C) and TOPAS 6015 (Tg = 149 °C), commercial-grade copolymers of ethylene and norbornene, were obtained from TOPAS Advanced Polymers. Tg values quoted are DSC values measured by us. All solvents employed were of analytical grade quality. Spectroscopic-grade chloroform (stabilized with 0.8% v/v ethanol) was used for all spectroscopic experiments. All chemicals were of highest commercial quality and were used as received.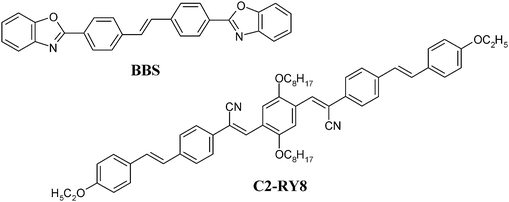 | ||
| Fig. 1 Molecular structures of the photoluminescent chromophores employed. | ||
Film preparation
Binary blends of C2-RY8 or BBS and TOPAS were prepared by feeding between 1–3 g of polymer and the desired amount of dye into a recycling, co-rotating twin-screw extruder (DSM), mixing for 3 min at 300 °C and extruding the resulting blend. Films were prepared by compression-molding the blends between two PTFE films with PTFE spacers in a Carver press at 300 °C for ca. 1–3 min, resulting in films of ca. 100 µm thickness. After removal from the press, the samples were quenched by immersion in an ice-water bath. The dye concentration of the films was verified by dissolving ca. 4.5 mg of the polymer in 10 mL of CHCl3 and comparing the absorption obtained from a Perkin Elmer Lambda 800 spectrometer of the solutions thus prepared (at 454 nm for C2-RY8 and 374 nm for BBS) to the theoretical value calculated from known extinction coefficients (52538 M−1cm−1 for C2-RY8 and 58884 M−1cm−1 for BBS22). The extinction coefficient for C2-RY8 was determined by dissolving known quantities of the dye in CHCl3. The absorption obtained at 454 nm from a Perkin Elmer Lambda 800 spectrometer of the resulting solutions was plotted versus the concentration, and the slope of the least-squares linear fit was established as the extinction coefficient.Instrumentation
DSC traces were recorded under N2 on a Mettler Toledo DSC922e at a heating rate of 10 K min−1. The onset of the specific heat change was taken as the Tg (ESI†), since this temperature corresponds to the onset of increased mobility. UV-Vis absorption spectra were obtained on a Perkin Elmer Lambda 800 spectrometer at ambient. Steady-state photoluminescence (PL) spectra were acquired at ambient on either a PTI C720 spectrometer under excitation (λex) at 435 nm (ex-situ study of C2-RY8/TOPAS 6015 blends, the emission was corrected for instrument throughput and detector response) or on an Ocean Optics ACD1000-USB spectrometer (in-situ study of BBS/TOPAS 5013, BBS/TOPAS 6015, and C2-RY8/TOPAS 6015 blends and solubility and thermal stability experiments with C2-RY8 blends, λex = 377 nm, these emission spectra are uncorrected). Annealing experiments were conducted by heating the samples (sandwiched between glass cover slips) on a Gel Instrumente AG hot stage with a TC2 temperature controller. Solubility experiments were conducted by heating the samples (sandwiched between a glass slide and a glass cover slip) on a Mettler FP82HT microscope hot stage controlled by a Mettler FP90 Central Processor. Annealing experiments of blends containing BBS relied on measuring the emission in-situ, using a Y-shaped optical fiber in connection with an Ocean Optics ACD1000-USB spectrometer, while the samples were isothermally heated on the hot stage. Dye stability was monitored by measuring the fluorescence intensity over time in a similar manner, but exposure to UV excitation was limited by decreasing the frequency of measurements to limit possible photobleaching. Solubility measurements were performed in the same way, using a Mettler FP82HT hot-stage and heating the sample at a constant rate of 1 °C/min. For annealing experiments with C2-RY8 blends, samples were removed at regular intervals from the hot stage, quenched to room temperature by pressing them firmly onto a cold surface, and the fluorescence spectrum was measured on a PTI C720 spectrometer, before the sample was placed back onto the hot stage. Monomer to excimer emission intensity ratios IM/IE were always measured at λM = 430 and λE = 500 nm in the case of BBS and λM = 550 and λE = 612 nm in the case of C2-RY8.Results and discussion
The two chromophores employed in this study are 4,4′-bis(2-benzoxazolyl)stilbene (BBS) and a cyano-substituted oligo(p-phenylene vinylene) derivative (C2-RY8, Fig. 1). Detailed accounts of the optical characteristics of these dyes have been reported previously,17,23 and these properties are therefore only briefly summarized here. C2-RY8 is a recently introduced aggregachromic dye,17 which in dilute chloroform solution displays an absorption band with a maximum, λabs, at 459 nm. The addition of methanol (a non-solvent) leads to aggregation of the dye molecules, shifting λabs to 500 nm due to charge-transfer interactions. The fluorescence of C2-RY8 exhibits similarly pronounced changes upon aggregation: the emission spectrum in chloroform displays a maximum, λem, at 550 nm while in a chlorofom/methanol mixture the emission maxima are at 580 and 625 nm.17 This significant bathochromic shift is consistent with the transition from a molecularly dispersed to an aggregated state, which allows for the formation of excimers.24 Previous studies have reported that the commercially employed optical brightener BBS exhibits similar behavior.23 In dilute chloroform solution, BBS displays an absorption maximum at 377 nm and the emission spectrum features maxima at 413, 430, and 455 nm (the peak at 430 nm is the most prominent). Upon increasing the concentration in chloroform beyond saturation so that aggregates form, emission peaks at 465 and 487 nm appear due to the formation of excimers. Minor differences in peak absorption or emission maxima are observed when comparing liquid solutions/dispersions of these dyes to those of dye/polymer blends, but the optical changes observed upon assembly in liquid solvents are qualitatively similar to those observed in solid polymer hosts.17,23The host polymers selected for this study are commercial cyclic polyolefin copolymers of ethylene and norbornene. This general family of materials spans a wide range of thermal properties depending on the ratio of the comonomers, with Tg in the temperature regime of interest. We demonstrated earlier that the Tg of the polymer/dye blend influences the kinetics of the aggregation processes in these systems such that it acts as a threshold temperature,18 and thus selected two different ethylene/norbornene copolymers with glass transitions at 131 °C (TOPAS 5013) and 149 °C (TOPAS 6015). Blends of BBS in TOPAS 5013 and 6015 and blends of C2-RY8 in TOPAS 6015 were produced by melt-mixing the components in a mini-extruder at 300 °C. The blends were subsequently compression molded at 300 °C and immediately quenched to 0 °C in order to kinetically trap the dyes in a dispersed state and prevent phase separation.
The phase and thermal behavior of these blends were studied in depth, as the sensory function of these materials is intimately tied to both of these properties. In order to elucidate the phase behavior of these systems, we first investigated the solubility of both dyes in TOPAS 5013 and 6015 using in-situfluorescence spectroscopy. For this study, originally quenched blend films containing between 0.4–2.9 wt.-% dye were annealed above Tg for several minutes to several hours in order to induce phase separation between the polymer and the dye. Fluorescence spectra of all blend films thus treated displayed contributions from both monomer and excimer emission. The samples were subsequently heated at a constant rate of 1K/min and the ratio of IM/IE was monitored in situ (Fig. 2, inset). The temperature at which the ratio of monomer to excimer emission intensity IM/IE (measured at λM = 430 and λE = 500 nm in the case of BBS and λM = 550 and λE = 612 nm in the case of C2-RY8) leveled off and reached a plateau indicated the solubility limit. Fig. 2 plots the dissolution temperature thus determined against the natural log of the dye concentration for BBS/TOPAS 5013, BBS/TOPAS 6015, and C2-RY8/TOPAS 6015 blends. As expected, a linear relationship between the natural log of concentration and the inverse temperature (1/T) is observed in all cases and the solubility profile of BBS in the two polymers is virtually identical.25 Attempts to use the same procedure for C2-RY8/TOPAS blends with a dye concentration of more than 0.58 wt.-% were stifled by the melting of C2-RY8 at 224 °C (ESI†). In any case, the available data and the extrapolation of the C2-RY8 solubility to the high temperature regime confirm that the blends exhibit phase behavior that is suitable for the targeted sensor application: both chromophores are soluble in the copolymers at a level of ca. 2 wt.-% at a processing temperature of 300 °C, but they phase separate (under thermodynamic control) from the polymers in the targeted sensor use range (130–200°C), even if used at concentrations of less than 0.5 wt.-%.
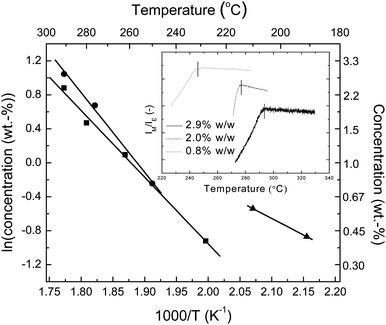 | ||
| Fig. 2 Temperature dependence of the solubility of BBS in TOPAS 5013 (■) and TOPAS 6015 (●) and of C2-RY8 in TOPAS 6015 (▲). Inset: sample data from BBS/TOPAS 6015 blends; the solubilization temperature of a given concentration was determined by monitoring the intensity ratio of monomer to excimer fluorescence (IM/IE) measured at λM = 430 and λE = 500 nm as a function of temperature. | ||
DSC experiments were performed on all polymer/dye blends and the neat polymers to determine their Tg. The results of these experiments are shown in Fig. 3 as a function of dye concentration. The data show that the host polymers are plasticized by even small amounts of both dyes. This effect is not uncommon and is routinely observed for a broad variety of additives that are incorporated in a molecularly dispersed fashion.26 A similarly small decrease of Tg accompanies the introduction of BBS into both host polymers, reflecting the chemical similarity of the polymers employed. A much more pronounced plasticization is caused by the addition of C2-RY8, consistent with the low apparent Tg of the dye of ca. 50 °C.18
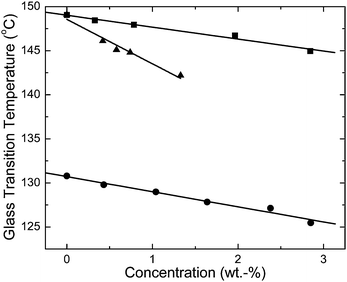 | ||
| Fig. 3 Glass transition temperature (°C) as a function of dye concentration (in wt.-%) of BBS/TOPAS 5013 (●), BBS/TOPAS 6015 (■), and C2-RY8/TOPAS 6015 (▲) blends. | ||
To study the thermal stability of the chromophores in the host polymers, which is important for their application in TTIs and also for the interpretation of aggregation studies (vide infra), 0.09 wt.-% BBS/TOPAS 5013 and 0.07 wt.-% C2-RY8/TOPAS 6015 blends were investigated. These blends, which comprise the dyes in concentrations that allow for complete miscibility in the temperature regime of interest, were annealed at temperatures between 185 °C and 200 °C, and the monomer fluorescence intensity was monitored over time (ESI†). While bleaching around the edges of films that were sandwiched between glass slides suggests that degradation is a factor if the blends are exposed to air, the fluorescence intensity in the center of the samples was constant over several hours. This indicates that in the absence of air chromophore degradation is indeed negligible under conditions at which blends with higher dye concentration (vide infra) display fluorescence color changes due to dye aggregation.
We next undertook a detailed spectroscopic investigation of the thermo-optical properties of the new polymer/dye blends. A first series of experiments was performed on blends comprising between 0.4 and 2.9 wt.-% BBS in TOPAS 5013. The blends were initially quenched from the melt and annealed at temperatures between 125 and 180 °C. The optical properties were monitored as a function of annealing time and temperature by in-situ fluorescence experiments. A typical data set is shown in Fig. 4a, which displays the fluorescence spectra of a 1.1 wt.-% BBS/TOPAS 5013 blend film annealed for different times at 170 °C. Clearly, the relative intensities of the bands associated with molecularly dispersed (430 nm) and aggregated (492 nm) chromophores change as a function of time, indicating a shift from monomer to excimer emission upon annealing. The lack of a clear isosbestic point for this graph suggests that the optical properties of this transition are not solely due to excimer formation, which would be consistent with findings for other systems.17,18 Indeed, this effect is attributed to additional self-absorption, caused in the aggregated samples by the overlapping portions of the absorbance spectrum and the monomer fluorescence spectrum, which is much less pronounced in the dispersed state. To map the aggregation characteristics of the BBS/TOPAS blends, the ratio of dispersed (IM) to aggregated (IE) fluorescence intensity (IM/IE) was recorded as a function of annealing time for different compositions over a broad range of annealing temperatures. Shown in Fig. 4b are example data for a 1.1 wt.-% BBS/TOPAS 5013 blend annealed at 170 °C; as in previously investigated systems,15–18 the aggregation kinetics are well defined by a single exponential function:
 | (1) |
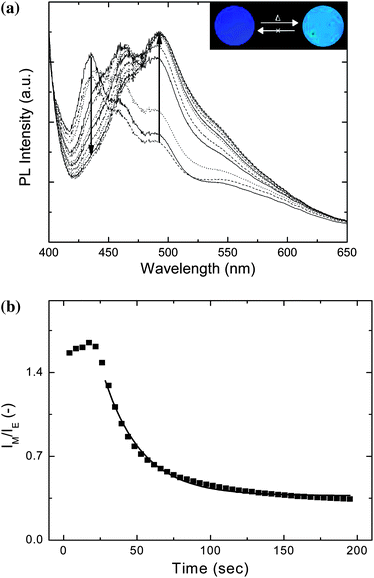 | ||
| Fig. 4 Uncorrected PL emission spectra (a), and (b) IM/IE extracted from the emission spectra in (a) as a function of annealing time at 170 °C for a 1.1 wt.-% BBS/TOPAS 5013 blend. The line represents a least squares fit according to equation 1. The inset shows pictures of typical samples excited by 365 nm light before and after annealing. | ||
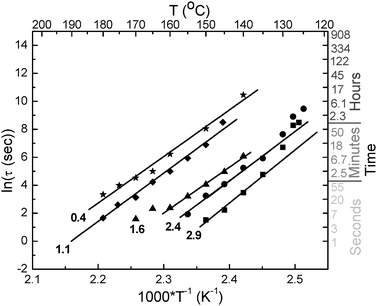 | ||
| Fig. 5 Arrhenius plots expressing the temperature dependence of ln(τ) of BBS/TOPAS 5013 blends as a function of dye concentration (indicated in the graph in wt.-%). | ||
Blends of 0.3–2.9 wt.-% BBS in TOPAS 6015, which display higher glass transition temperatures than the corresponding TOPAS 5013 blends (Fig. 3), were formulated to extend the approach to materials that display appropriate aggregation rates in the temperature regime between ∼150 and 200 °C. Annealing experiments were performed in analogy to those conducted with TOPAS 5013 blends. A typical data set is shown in the ESI† along with the corresponding plot of IM/IE versus time; the time constants of the fluorescence change extracted from these and many similar experiments are shown in Fig. 6, along with the data of the TOPAS 5013 blends as a ln(τ) versus 1/T plot. Fig. 6 shows that the BBS/TOPAS 6015 blends display aggregation kinetics that mirror those of the TOPAS 5013 blends; as expected, the curves are shifted towards slower aggregation times. Gratifyingly, the slopes of the ln(τ) versus 1/T traces, which correspond to the apparent activation energy of the process,18 are virtually identical for TOPAS 5013 and TOPAS 6015 blends. This behavior reflects the strong similarity of the two host polymers and correlates well with previous work on other copolymer series with varying Tg.18 The similarity of the apparent activation energy is very useful for the design of TTIs, since the response window can simply be tuned by adjusting the host polymerTg. It should be noted that the response of the 0.3 wt.-% BBS/TOPAS 6015 blend is exceedingly slow, presumably because (at the temperatures investigated) this composition is close to the point where the dye is completely soluble in the polymer matrix (cf.Fig. 2).
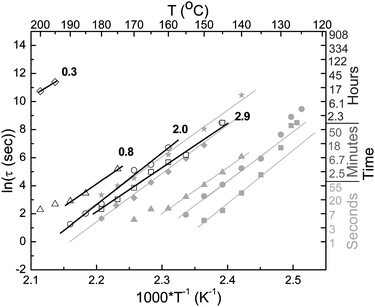 | ||
| Fig. 6 Arrhenius plots expressing the temperature dependence of ln(τ)BBS/TOPAS 6015 blends as a function of dye concentration (indicated in the graph in wt.-%). For comparison, the data for BBS/TOPAS 5013 blends (cf.Fig. 5), are shown in grey. | ||
As an alternative to BBS, which displays a comparably limited fluorescence color change upon aggregation,17,23 blends of 0.58–1.3 wt.-% C2-RY8 in TOPAS 6015 were also investigated. The fluorescence of C2-RY8 exhibits a more pronounced bathochromic shift upon aggregation (vide supra). At the same time, aggregation causes a significant red shift of the dyes optical absorption in the visible regime, leading to color changes that can be detected with the unassisted eye (Fig. 7a, inset).17 Further, C2-RY8 comprises a longer rigid core than BBS; this molecular feature has been shown to slow the phase separation kinetics, presumably on account of slower diffusion of the chromophore through the polymer matrix.18
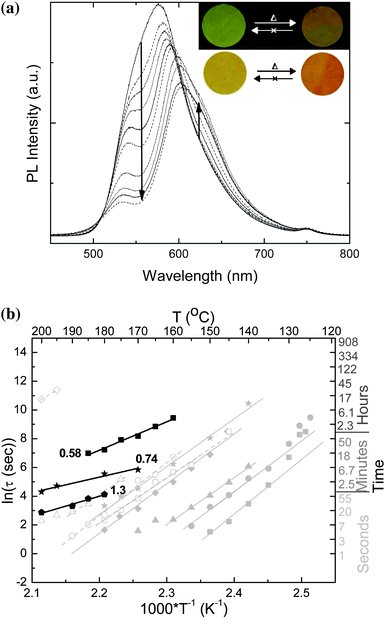 | ||
| Fig. 7 Uncorrected PL emission spectra as a function of annealing time at 170 °C for a 0.74 wt.-% C2-RY8/TOPAS 6015 blend (a), and Arrhenius plot (b) expressing the temperature dependence of ln(τ) of C2-RY8/TOPAS 6015 blends as a function of dye concentration (indicated in the graph in wt.-%). For comparison, the data for BBS/TOPAS 5013 and BBS/TOPAS 6015 blends (cf.Figs. 5–6) are shown in grey. | ||
Fig. 7a, which displays the in-situfluorescence spectra of a 0.74 wt.-% C2-RY8/TOPAS 6015 blend film annealed for different times at 170 °C, shows that, much like the BBS blends, a shift from monomer to excimer emission occurs upon annealing as demonstrated by a change in the relative intensities of the bands associated with molecularly dispersed (550 nm) and aggregated (612 nm) chromophores. Up to a certain annealing time, the series of spectra exhibit an isosbestic point, which is indicative of a mutual dependence of the excimer and monomer components that is found in similar systems.17,18 At long aggregation times at high temperature, the isosbestic point is somewhat muddled; this is consistent with photobleaching, which was observed (visual inspection) when samples were annealed at high temperature for extended periods of time and simultaneously exposed to UV excitation for in-situ fluorescence measurements. For this reason, further kinetic studies on C2-RY8/TOPAS 6015 blend films were conducted by annealing samples and quenching them periodically to room temperature, to record fluorescence spectraex-situ, from which the IM and IE values were extracted (see ESI† for example data). The data obtained by this method are very similar to in-situ measurements (see ESI† for data comparison). The time constants obtained from the aggregation kinetics studies of the C2-RY8 blends are plotted on an Arrhenius plot in Fig. 7b along with the data from both BBS/TOPAS blends. Again, a clear Arrhenius temperature dependence is seen. A comparison of the aggregation behavior of BBS/TOPAS blends with C2-RY8/TOPAS blends reveals that the aggregation of the larger C2-RY8 is indeed much slower than that of BBS, which is consistent with previous findings that indicate a decrease in the translational mobility of the dye upon increased size of the aromatic core.18 Interestingly, the apparent activation energy for the aggregation process in the C2-RY8/TOPAS blends is considerably smaller than that of the BBS-based blends. This lower activation energy is attributed to a difference in mechanism in the aggregation of the C2-RY8 molecules, i.e., nucleation-limited aggregation as opposed to a diffusion-limited process.27Fig. 7b shows that the aggregation kinetics of C2-RY8/TOPAS blends allow for the creation of TTIs which can be conveniently tailored to exhibit useful responses at temperatures of up to 200 °C. The C2-RY8/TOPAS 6015 blends display a tendency to slower aggregation than BBS, on account of the larger size and higher solubility of C2-RY8 compared to BBS.
Conclusions
In summary, we have introduced new thermochromic materials, which are useful for application in time–temperature indicators that operate in the range of 130–200 °C, i.e., a much higher temperature regime than is accessible with existing technologies. The design approach involves incorporating small amounts of the excimer-forming, photoluminescent chromophoresBBS or C2-RY8 into ethylene/norbornene copolymers with high glass transition temperatures. Quenching after melt-processing allows one to kinetically trap the dyes in dispersed states, which exhibit monomer fluorescence. Upon annealing the materials above Tg, self-assembly of the dye molecules into aggregates that allow for excimer formation occurs, concomitant with permanent and pronounced fluorescence color changes. The materials demonstrate predictable, Arrhenius-type aggregation behavior and concomitant fluorescence color change. They are thermally stable and display useful kinetic rates in the targeted temperature regime, which were shown to be tunable on time scales between seconds and days by changing dye concentration, dye structure, or host polymerTg.Ultimately, the limitations of the system lie in avoiding the non-linear regimes in the vicinities of the solubility limit and the glass transition temperature. It appears that sensor arrays incorporating more than one component can solve this problem and allow the facile design of TTIs that enable the user to extract accurate thermal history data, allowing differentiation between short exposures to high temperatures and long exposures to low temperatures on the basis of the different activation energies.
Acknowledgements
We gratefully acknowledge financial support from Schlumberger and SOURCE. This material is also based upon work supported by the National Science Foundation (NSF DMI-0428208).References
- M. Leclerc, Adv. Mater., 1999, 11, 1491 CrossRef; S. A. Jenekhe, D. I. Kiserow, Chromogenic Phenomena in Polymers: Tunable Optical Properties; ACS Symposium Series 888; American Chemical Society: Washington, DC, 2005; pp 2–15 Search PubMed.
- N. Chandrasekharan and L. A. Kelly, J. Am. Chem. Soc., 2001, 123, 9898 CrossRef CAS; C. J. Ellison and J. M. Torkelson, J. Polym. Sci. Part B-Polym. Phys., 2002, 40, 2745 CrossRef CAS; S. Uchiyama, Y. Matsumura, A. P. de Silva and K. Iwai, Analytical Chem., 2003, 75, 5926 CrossRef CAS; S. S. Balamurugan, G. B. Bantchen, Y. M. Yang and R. L. McCarley, Angew. Chem. Int. Ed., 2005, 44, 4872 CrossRef CAS; Y. Wang, N. Archambault, A. Marold, L. Weng, B. L. Lucht and W. B. Euler, Macromolecules, 2004, 37, 5415 CrossRef CAS.
- Y. F. Lu, Y. Yang, A. Sellinger, M. C. Lu, J. M. Huang, H. Y. Fan, R. Haddad, G. Lopez, A. R. Burns, D. Y. Sasaki, J. Shelnutt and C. J. Brinker, Nature, 2001, 410, 913 CrossRef CAS.
- A. C. Edrington, A. M. Urbas, P. DeRege, C. X. Chen, T. M. Swager, N. Hadjichristidis, M. Xenidou, L. J. Fetters, J. D. Joannopoulos, Y. Fink and E. L. Thomas, Adv. Mater., 2001, 13, 421 CrossRef CAS; S. H. Foulger, P. Jiang, Y. R. Ying, A. C. Lattam, D. W. Smith and J. Ballato, Adv. Mater., 2001, 13, 1898 CrossRef CAS; S. H. Foulger, P. Jiang, A. C. Lattam, D. W. Smith and J. Ballato, Langmuir, 2001, 17, 6023 CrossRef CAS; J. Hubner, L. Chen, Y. Liu, K. Schanze, R. Ifju, J. Nicolosi and W. El-Ratal, Exp. Mech., 2005, 45, 137 CrossRef; R. A. Nallicheri and M. F. Rubner, Macromolecules, 1991, 24, 517 CrossRef CAS.
- D. T. McQuade, A. E. Pullen and T. M. Swager, Chem. Rev., 2000, 100, 2537 CrossRef CAS; K. J. Albert, N. S. Lewis, C. L. Schauer, G. A. Sotzing, S. E. Stitzel, T. P. Vaid and D. R. Walt, Chem. Rev., 2000, 100, 2595 CrossRef CAS; M. Burnworth, S. J. Rowan and C. Weder, Chem-Eur J., 2007, 13, 7828 CrossRef CAS.
- A. Natansohn and P. Rochon, Chem. Rev., 2002, 102, 4139 CrossRef CAS; V. Shibaev, A. Bobrovsky and N. Boiko, J. Photoch. Photobio. A, 2003, 155, 3 Search PubMed; T. J. Wigglesworth, A. J. Myles and N. R. Branda, Eur. J. Org. Chem., 2005, 7, 1233 CrossRef.
- R. J. Mortimer, A. L. Dyer and J. R. Reynolds, Displays, 2006, 27, 2 CrossRef CAS; A. A. Argun, P. H. Aubert, B. C. Thompson, I. Schwendeman, C. L. Gaupp, J. Hwang, N. J. Pinto, D. B. Tanner, A. G. MacDiarmid and J. R. Reynolds, Chem. Mater., 2004, 16, 4401 CrossRef CAS.
-
C. Löwe, C. Weder, US Patent 7
![[thin space (1/6-em)]](https://www.rsc.org/images/entities/char_2009.gif) 223
223![[thin space (1/6-em)]](https://www.rsc.org/images/entities/char_2009.gif) 988, 2007;
C. Weder, M. Kinami, B. Crenshaw, US Patent Application 11
988, 2007;
C. Weder, M. Kinami, B. Crenshaw, US Patent Application 11![[thin space (1/6-em)]](https://www.rsc.org/images/entities/char_2009.gif) 651
651![[thin space (1/6-em)]](https://www.rsc.org/images/entities/char_2009.gif) 343, 2007.
343, 2007. - C. Löwe and C. Weder, Adv. Mater., 2002, 14, 1625 CrossRef CAS.
- B. R. Crenshaw, M. Burnworth, D. Khariwala, A. Hiltner, P. T. Mather, R. Simha and C. Weder, Macromolecules, 2007, 40, 2400 CrossRef CAS.
- B. R. Crenshaw and C. Weder, Macromolecules, 2006, 39, 9581 CrossRef CAS.
- B. R. Crenshaw and C. Weder, Adv. Mater., 2003, 15, 4717 CAS.
- J. Kunzelman, M. Kinami, B. R. Crenshaw, J. D. Protasiewicz and C. Weder, Adv. Mater., 2008, 20, 119 CrossRef.
- J. Kunzelman, B. R. Crenshaw and C. Weder, J. Mat. Chem., 2007, 17, 2989 RSC.
- B. R. Crenshaw and C. Weder, Adv. Mater., 2005, 17, 1471 CrossRef CAS.
- M. Kinami, B. R. Crenshaw and C. Weder, Chem. Mater., 2006, 18, 946 CrossRef CAS.
- J. Kunzelman, B. R. Crenshaw, M. Kinami and C. Weder, Macromol. Rapid Comm., 2006, 27, 1981 CrossRef CAS.
- B. R. Crenshaw, J. Kunzelman, C. E. Sing, C. Ander and C. Weder, Macromol. Chem. Phys., 2007, 208, 572 CrossRef CAS.
- J. R. Allegra, J. Brennan, V. Lanier, R. Lavery and B. MacKenzie, Acad. Emerg. Med., 1999, 6, 1098 CrossRef CAS; E. Shimoni, E. M. Anderson and T. P. Labuza, J. Food Sci., 2001, 66, 1337 CrossRef CAS.
-
C. Seiter, US Patent 4
![[thin space (1/6-em)]](https://www.rsc.org/images/entities/char_2009.gif) 057
057![[thin space (1/6-em)]](https://www.rsc.org/images/entities/char_2009.gif) 029, 1977;
A. T. Ram, J. A. Manico, K. R. Gisser, P. J. Cowdery-Corvan, T. D. Weaver, US Patent 6
029, 1977;
A. T. Ram, J. A. Manico, K. R. Gisser, P. J. Cowdery-Corvan, T. D. Weaver, US Patent 6![[thin space (1/6-em)]](https://www.rsc.org/images/entities/char_2009.gif) 103
103![[thin space (1/6-em)]](https://www.rsc.org/images/entities/char_2009.gif) 351, 2000;
R. P. Arens, R. D. Birkholz, D. L. Johnson, T. P. Labuza, C. L. Larson, D. J. Yarusso, US Patent 5
351, 2000;
R. P. Arens, R. D. Birkholz, D. L. Johnson, T. P. Labuza, C. L. Larson, D. J. Yarusso, US Patent 5![[thin space (1/6-em)]](https://www.rsc.org/images/entities/char_2009.gif) 667
667![[thin space (1/6-em)]](https://www.rsc.org/images/entities/char_2009.gif) 303, 1997;
T. Prusik, R. M. Arnold, US Patent 5
303, 1997;
T. Prusik, R. M. Arnold, US Patent 5![[thin space (1/6-em)]](https://www.rsc.org/images/entities/char_2009.gif) 057
057![[thin space (1/6-em)]](https://www.rsc.org/images/entities/char_2009.gif) 434, 1991.
434, 1991. -
R. I. Ezrielev, R. B. Barrett, US Patent 5
![[thin space (1/6-em)]](https://www.rsc.org/images/entities/char_2009.gif) 476
476![[thin space (1/6-em)]](https://www.rsc.org/images/entities/char_2009.gif) 792, 1995.
792, 1995. - E. M. Vernigor, V. K. Shalaev and E. A. Luk'yanet, Chem. Heterocycl. Compd., 1981, 17, 463 CrossRef.
- A. Pucci, M. Bertoldo and S. Bronco, Macromol. Rapid Comm., 2005, 26, 1043 CrossRef CAS.
- C. Spies and R. Gehrke, J. Phys. Chem. A, 2002, 106, 5348 CrossRef CAS; P. F. van Hutten, V. Krasnikov, H. J. Brouwer and G. Hadziioannou, Chem. Phys., 1999, 241, 139 CrossRef CAS; T. Förster and K. Kasper, Z. Phys. Chem. NF, 1954, 1, 275.
- P. J. Flory, “Principles of Polymer Chemistry”, Cornell, New York, 1953 Search PubMed.
- K. De Clerck, H. Rahier, B. Van Mele and P. J. Kiekens, J. Appl. Polym. Sci., 2003, 90, 105 CrossRef CAS.
- C. E. Sing, MS Thesis, Case Western Reserve University, Cleveland, OH, 2008.
Footnote |
| † Electronic supplementary information (ESI) available: DSC traces; fluorescence intensity–time plots; PL emission spectra; IM/IE vs. time plots; Arrhenius plots. See DOI: 10.1039/b813644k |
| This journal is © The Royal Society of Chemistry 2009 |
