Quantification of elemental labeled peptides in cellular uptake studies†
Gunda
Koellensperger
a,
Marion
Groeger
b,
Daniela
Zinkl
b,
Peter
Petzelbauer
b and
Stephan
Hann
*a
aDepartment of Chemistry, Division of Analytical Chemistry, BOKU – University of Natural Resources and Applied Life Sciences, Muthgasse 18, A-1190, Vienna, Austria. E-mail: stephan.hann@boku.ac.at
bDepartment of Dermatology, Medical University of Vienna, Währinger Strasse 18–20, A-1090, Vienna, Austria
First published on 7th November 2008
Abstract
A methodological study on peptide quantification was carried out comparing LC-ESI-TOFMS with LC-ICP-MS approaches. For this purpose a peptide without hetero-elements amenable to ICP-MS analysis has been labeled by indium using 1,4,7,10-tetraazacyclododecane-N,N′,N″,N‴-tetraacetic acid as complexing tag (In-DOTA). Accordingly, quantification of the free labeled compound was carried out by LC-ICP-MS and compared to LC-ESI-TOFMS measurement without labeling, applying identical chromatographic conditions. For aqueous standards both methods showed comparable results in terms of sensitivity and limit of detection (1.7 and 3.2 fmol, respectively).
In cell culture experiments, endothelial cells were incubated with the labeled and unlabeled peptide for 5 minutes. Immunohistochemistry on fixed cells revealed cytosolic fluorescence indicating internalization of the peptide. To quantify the amount of peptide uptake, cytoplasm was isolated via hyperosmolar cell lysis and either directly analyzed or subjected to different sample preparation techniques to obtain the low molecular mass fraction. Peptide concentrations were determined by LC-ICP-MS and LC-ESI-TOFMS. Despite the comparable limits of detection in aqueous samples, measurement of the cytoplasm samples revealed severe matrix effects in the case of LC-ESI-MS making quantification at the present concentration levels impossible. In this respect a clear advantage of LC-ICP-MS quantification of peptides in combination with elemental labeling was demonstrated.
Introduction
Elemental labeling of biomolecules in combination with atomic spectroscopy, particularly with regard to ICP-MS, has been recently recognized as an emerging analytical research field.1–4 Several studies addressing the evaluation and application of elemental labeling for ICP-MS linked immunoassays,5–10 metal coded affinity tags (MeCAT)11 and for imaging by laser ablation ICP-MS12,13 have been performed. A major advantage of the labeling approach is the potential to increase selectivity and sensitivity of biomolecule analysis. However, the development and application of labeled compounds in combination with elemental analysis is still in a preliminary phase. Fundamental studies comparing the analytical figures of merit of the labeling approach to conventional (bio)analytical methodologies are necessary.As a novelty, the present work addresses targeted peptide quantification in complex biological matrices in the context of preclinical drug development. Aim of the study was investigating the cellular uptake of a labeled peptide drug on a quantitative basis by LC-ICP-MS in cell model experiments. Analytical accuracy and precision are required for unambiguous quantitative analysis from very complex mixtures. Wide dynamic range and high sensitivity are critical for detecting low abundant proteins/ peptides in cell cultures. The potential of the novel ICP-MS based approach has still to be investigated in this respect.
Traditionally, bioassays such as a competitive enzyme-linked immunosorbent assay (ELISA) and a radioimmunoassay (RIA) have been used for targeted quantitative analysis of peptides or proteins in complex biological samples. Using liquid chromatography/mass spectrometry (LC-MS) in this context without labeling is challenging. However, in recent years, accompanying an increasing number of peptide drugs or biomarkers, there has been an increasing interest in the LC-MS method, and some methods utilizing triple quadruple, ion trap, and quadrupole time-of- flight (Q-TOF) mass spectrometry have been reported for the quantification of peptides. John et al. reviewed the published LC-MS methods.14 So far comparably few studies addressed integrated elemental analysis for protein/peptide quantification using heteroelements as selenium, sulfur or phosphorus.15
In the present work we have performed elemental labeling for accurate quantification of the peptide Bβ15–42 in cellular fractions. Bβ15–42 is a 28 amino acid cleavage product of fibrin of 3 kD (amino acid sequence GHRPLDKKRE EAPSLRPAPP PISGGGYR). Following thrombin-induced fibrin formation it is released from fibrin E1 fragments by the action of plasmin and represents a sensitive indicator of fibrinolytic activity.16–18 This peptide has a surprisingly effective tissue protective function.19 It reduces damage to the heart in situations of ischemia followed by reperfusion in several animal models. To prove efficacy of Bβ15–42 in humans, a multi-centre phase IIa clinical trial in patients with acute myocardial infarction undergoing primary percutaneous coronary intervention was initiated (F.I.R.E. study20) and recruitment was closed in 11/2007.
Bβ15–42 has been labeled with indiumvia complexation by 1,4,7,10-tetraazacyclododecane-N,N′,N″,N‴-tetraacetic acid (DOTA). The free labeled peptide was quantified in cytoplasm using LC-ICP-MS. The analogous experiment was performed with the unlabeled peptide followed by quantification via LC-ESI-TOFMS in order to investigate the advantages of the labeling approach and ICP-MS detection in comparison to peptide quantification by molecular mass spectrometry. The methodological approaches were evaluated in terms of sensitivity and uncertainty of measurement.
Experimental
Synthesis of In-DOTA labeled peptide
See ESI.†Incubation and immunofluorescence measurement
Human umbilical vein endothelial cells (HUVEC) were grown to confluence on Chamber Slides (Nunc, Roskilde, Denmark), incubated with Bβ15–42- FITC (50 µg mL−1) for 5 min and were then fixed with 4 % paraformaldehyde for 15 min at room temperature. To visualize cell borders monoclonal mouse anti-VE-Cadherin (TEA1/ 31, 1µg mL−1, Immunotech, Marseille-Cedex, France) were incubated for 40 min at room temperature followed by the appropriate secondary antibody TRITC-labeled goat anti-mouse IgG (Jackson Laboratories, West Grove, PA, USA). Sections were analyzed by a confocal Laser scan microscope (LSM 510, Zeiss, Oberkochen, Germany). The pinhole of the LSM was set to an airy unit of 1, resulting in a section thickness of 0.8 µm.Incubation and cytoplasmic protein preparation for MS analysis
HUVEC were grown in culture flasks (approx. 1.1·106cells) and incubated with 60 µg of In-DOTA-Bβ15–42 and Bβ15–42 respectively. After an incubation time of 5 min the cells were washed, collected and incubated in lysis buffer containing 10 mM NaOH-Hepes (Merck), pH 7.9, 1.5 mM MgCl2 (Merck) and 10 mM KCl (Merck) on ice followed by centrifugation at 800 × g for 5 min at 4 °C. Supernatants were taken, centrifuged at 10,000 × g for 5 min at 4 °C and frozen for further applications.Protein precipitation was carried out by adding 150 µL of ice-cold acetonitrile to 50 µL of cytoplasm. After mixing and centrifugation (13000 rpm) for 10 min at 4 °C the supernatants were taken and stored at -80 °C until measurement.
Protein separation by centrifugal filtration was performed at 4 °C and 13000 rpm using 10 kD centrifugal filters (Millipore).
Reagents and standards
For preparation of HPLC eluents suprapure formic acid (VWR) and methanol (LC-MS grade, Fisher scientific, Vienna, Austria) were used. Water was pre-cleaned by reverse osmosis followed by purification by a purification system (SG Ultra Clear Basic, SG Wasseraufbereitung und Regenerierstation GmbH, Barsbüttel, Germany).Instrumental
| Gradient program | ||
|---|---|---|
| Time [min] | A [%] | B [%] |
| 0 | 90 | 10 |
| 4 | 90 | 10 |
| 5 | 0 | 100 |
| 10 | 0 | 100 |
| 10.1 | 90 | 10 |
| 15 | 90 | 10 |
| Nebulizer | PFA-ST microconcentric |
| Spray chamber | Cyclonic, −5 °C |
| Nebulizer gas flow | 1.0 L min−1 |
| O2 additional flow | 30.0 mL min−1 |
| Aux. Gas | 1.25 L min−1 |
| Plasma gas | 15 L min−1 |
| ICP RF power | 1350 W |
| Scan mode | Peak hopping |
| m/z measured | 112.904, 114.904 |
| Dwell time per isotope | 200 ms |
| Datapoints | 2 s−1 |
| Nebulizer gas pressure | 20 psig |
| Drying Gas flow | 10 L min−1 |
| Gas temperature | 350 °C |
| Capillary voltage | 3850 V |
| Fragmentor voltage | 250 V |
| Skimmer voltage | 60 V |
| Octopole RF voltage | 250 V |
| Scans | 1 s−1 |
| Extracted mass range | 608.73–608.74 |
Data evaluation
Generation and export of HPLC-ICP-QMS chromatograms was carried out using Chromlink (Version 2.1, PE SCIEX) in combination with Totalchrom (Version 6.2, PE-SCIEX). Chromeleon software (Version 6.7, Dionex, Sunnyvale, CA, USA) was used for integration of all chromatographic data from ICP-MS detection. Agilent LC-ESI-TOFMS data was evaluated employing Agilent Qualitative and Quantitative Analysis software modules.Results and discussion
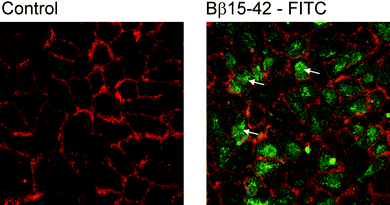
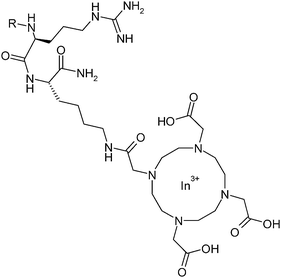
Cell culture experiments using human umbilical vein endothelial cells revealed that the fluorescence-labeled peptide Bβ15–42 was rapidly internalized by these cells as exemplified in Fig. 1. Consequently, the drug uptake of endothelial cells was addressed on a quantitative basis. Two methodological strategies were investigated: (1) incubation of endothelial cells with elemental labeled Bβ15–42peptide (Fig. 2) and subsequent LC-ICP-MS analysis was compared with (2) incubation of unlabelled Bβ15–42peptide in combination with LC-ESI-TOFMS analysis. | ||
| Fig. 1 Human umbilical vein endothelial cells; control staining for cell borders in red and incubation with Bß15–42-FITC (green). Arrows denote examples for Bß15–42 in the cells cytoplasm. | ||
 | ||
| Fig. 2 Structure of the indium labeled peptide In-DOTA–Bβ15–42. R corresponds to the sequence GHRPLDKKRE EAPSLRPAPP PISGGGY. | ||
Analytical figures of merit – Comparison of LC-ICP-MS versus LC-ESI-TOFMS
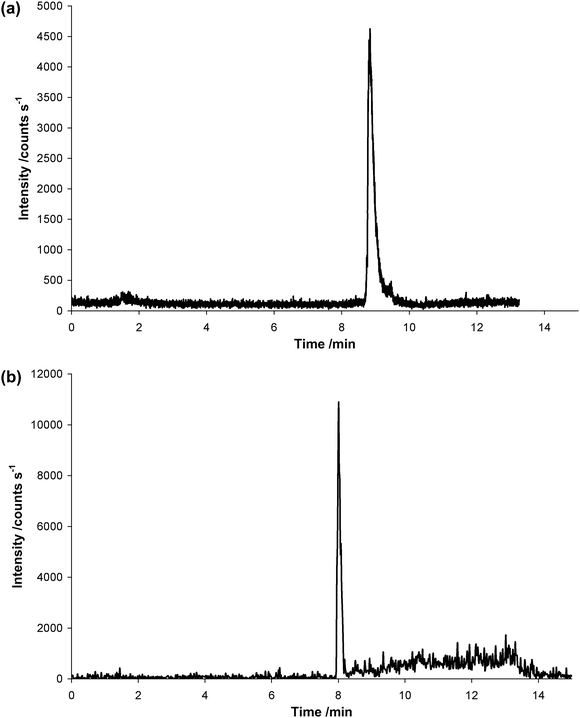
Most peptide separations employ reversed phase chromatography because of the beneficial compatibility of this highly selective separation mode with ESI-MS. Applications are protein digest separations, peptide mapping, and recently quantification of peptides in biological samples or trace peptide variants in peptide mapping. For the present study a chromatographic method employing a 1mm C8 reversed phase column with a H2O/MeOH eluent system was developed. The use of the 1mm column allowed compatibility with both ESI-TOFMS and ICP-MS detection. It has been previously shown that at flow rates of 60 µL min−1 sensitivity was optimal for hyphenated HPLC-ICP-MS analysis using organic solvents, since the lower amount of introduced sample (compared to normal bore 4mm columns) was compensated by decreased matrix suppression. At the same time the signal stability was improved.21Fig. 3a shows the separation of the labeled In-DOTA–Bβ15–42 determined by LC-ICP-MS and Fig. 3b the unlabelled Bβ15–42 measured by LC-ESI-TOFMS. Both signals were measured using identical HPLC operation parameter and separation column (Table 1). The ICP-MS signal of 115In shown in Fig. 3a corresponds to an In-DOTA–Bβ15–42 concentration of 0.5 mg L−1 (137 fmol on column). The extracted LC-ESI-TOFMS ion chromatogram (m/z 608.73–608.74) in Fig 3b was obtained for Bβ15–42 concentration of 0.5 mg L−1 (165 fmol on column). The corresponding LODs of the two methods were calculated as the quantified, 3-fold standard deviation of the baseline signal, revealing 0.0091 mg L−1 (2.5 fmol peptide on column) and 0.0098 mg L−1 (3.2 fmol peptide on column) for the ICP-MS detection of the labeled and ESI-TOFMS detection of the unlabeled peptide respectively. A working range of 0.5–50 mg L−1peptide was selected for both analytical techniques (5 calibration levels). In both cases quadratic calibration was applied with comparable correlation coefficients of R2 = 1.00 and R2 = 0.9993 for LC-ICP-MS and LC-ESI-TOFMS, respectively. LC-ESI-TOFMS was superior with respect to long term stability. For N = 5 measurements over day a reproducibility of 1.8 % was obtained compared to relatively poor 10% obtained for LC-ICP-MS. This poor reproducibility of ICP-MS was not related to memory effects, but to the use of up to 100 % MeOH as HPLC mobile phase resulting in a long-term drift of the signals, which could not be completely eliminated by addition of oxygen to the sample gas. In future studies the drift could be compensated by internal standardization or isotope dilution MS using a peptide labeled with 113In. | ||
| Fig. 3 a: Chromatogram of In-DOTA–Bβ15–42 measured by LC-ICP-MS. The signal corresponds to a concentration of 0.5 mg L−1 (137 fmol on column). b: Chromatogram of Bβ15–42 measured by LC-ESI-TOFMS. The signal obtained viaextraction of the mass range 608.73–608.74 corresponds to a concentration of 0.5 mg L−1Bβ15–42 (165 fmol on column). | ||
Hence, in pure peptide standard solutions the two methodologies could be considered as equivalent. However, this finding applied only to the use of matrix free peptide standards as the sensitivity of LC-ESI-MS generally depends on the purity of the sample.
Analysis of Bβ15–42 in cytoplasm
In fact, addressing quantification of the peptide in the cytoplasm of incubated cells revealed a different picture. The cell experiments involved HUVEC incubated with 60 µg of labeled and unlabeled Bβ15–42 for 5 minutes (cell number 1.1 106cells). The cytoplasm was isolated after hyperosmolar cell lysis and used directly without any further sample preparation steps for LC-ICP-MS and LC-ESI-TOFMS analysis.Despite the comparable limits of detection of both techniques, the peptide could be quantified in cytoplasm only by LC-ICP-MS. A peptide concentration of 0.70 ± 0.24 mg L−1 (3 independent replicates of the incubation procedure) was found by external calibration.
Sensitive analysis by LC-ESI-TOFMS was impeded by the complex matrix such as cytplasm. Generally, poor analyte selectivity together with matrix suppression can become a major issue in LC-ESI-MS resulting in low sensitivity. Often it is difficult to differentiate between the targeted peptide signal and matrix background, particularly when quantifying low abundant peptides. The selectivity is significantly increased through the high mass resolution capabilities of TOFMS. The peptide spectrum revealed an excellent full width at half maximum of 0.036 amu corresponding to a spectral resolution of 16900. Nevertheless, Bβ15–42 quantification at the present biological relevant concentration levels was not feasible with the used instrumental set-up.
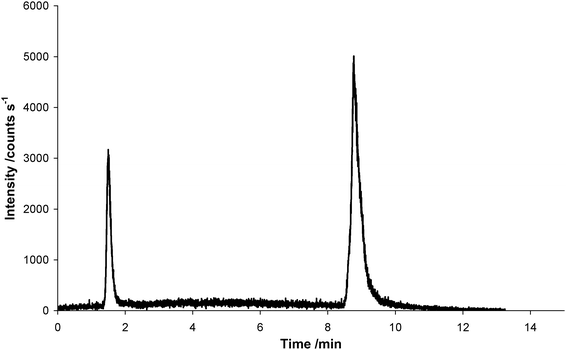
Consequently, different sample preparation methods were investigated as determination of the Bβ15–42peptide in cell lysates will depend on matrix removal. The low molecular mass fraction of the cytoplasm was obtained by (1) acetonitrile precipitation followed by centrifugation, (2) filtrationvia <10 kD centrifugal filters, and (3) filtration of cytoplasm diluted in MeOHvia <10 kD centrifugal filters. None of the prepared samples was suitable for LC-ESI-TOFMS determination. Moreover, the same procedures were applied to samples incubated with In-DOTA–Bβ15–42. Fig. 4 depicts the signal obtained for a cytoplasm sample, which was diluted with methanol and filtered via <10 kD centrifugal filters before measurement. As can be readily seen the sample preparation procedure resulted in unwanted minor loss of In (peak at 1.8 min). This is reflected by the high standard uncertainty obtained for the n = 3 independent determinations. Table 4 summarizes the obtained LC-ICP-MS results obtained from three independent incubations. The 10 kD filtration of the sample resulted in partial loss of the peptide due to hydrophobic interaction with the membrane. This could be compensated by diluting the sample in MeOH (1:2) prior to 10 kD filtration. With this preparation method the obtained peptide concentration of 0.93 ± 0.48 mg L−1 was in agreement with the concentration obtained by direct analysis. However, as can be readily observed in Table 4 the reproducibility was compromised by the additional sample preparation step. The acetonitrile precipitation was not suitable at all as the In-DOTA labeled compound was not stable. Future investigations will comprise direct analysis of cytoplasm samples by LC-ICP-MS as in the case of quantifying low abundant, highly reactive peptides all additional sample preparation steps significantly contribute to the total combined uncertainty.
| Direct injection | 10 kD filtration | 10 kD filtration + 50% MeOH | Acetonitrile precipitation | |
|---|---|---|---|---|
| In-DOTA- Bβ15–42 | 0.70 ± 0.24 | 0.44 ± 0.12 | 0.93 ± 0.48 | unstable |
 | ||
| Fig. 4 Chromatogram of In-DOTA–Bβ15–42 in cytoplasm of human umbilical vein endothelial cells after incubation of 60 µg In-DOTA–Bβ15–42 with approx. 1.1·106cells measured by LC-ICP-MS. The cytoplasm sample was diluted with methanol and filtered via <10 kD centrifugal filters before measurement. The signal at 9 min corresponds to a concentration of 0.28 mg L−1In-DOTA–Bβ15–42. | ||
The principle idea of this interdisciplinary study, which will open novel ICP-MS based strategies of drug development, is the identification of cellular targets of the peptide. The results clearly show that the method is capable to reliably identify the peptide in complex protein mixtures as given in cell lysates. This can be seen as a starting point for future analytical development to detect and identify peptide/protein adducts.
Conclusion
Peptide quantification in pre-clinical studies, i.e. cellular uptake experiments is an upcoming issue in drug development, since more and more peptides are recognized as promising drugs. Accordingly, accurate quantification methods are needed. As a matter of fact the biomedical community is aware of the potential of LC-MS in this context. We successfully applied LC-ICP-MS for the first time in this field. As with other methods addressing the cellular uptake of a candidate peptide drug, the LC-ICP-MS strategy relied on elemental labelled peptides. The quantitative LC-ESI-TOFMS approach failed in the case of complex samples (cell lysates). The advantage of the LC-ICP-MS based strategy was the selectivity of elemental detection, the higher robustness and ruggedness of ICP ionization at higher total dissolved solid concentrations. In LC-MS higher selectivity can only be achieved by increasing mass resolution (e.g. FT-MS).Acknowledgements
We gratefully acknowledge piCHEM R&D, Kahngasse 20, 8045 Graz, Austria for synthesis of In-DOTA-Bβ15–42.References
- V. I. Baranov, Z. A. Quinn, D. R. Bandura and S. D. Tanner, J. Anal. At. Spectrom., 2002, 17, 1148–1152 RSC.
- G. Licini and P. Scrimin, Angew. Chem. Int. Ed., 2003, 42, 4572–4575 CrossRef CAS.
- C. Hempen and U. Karst, Anal. Bioanal. Chem., 2006, 384, 572–583 CrossRef CAS.
- J. Bettmer, N. Jakubowski and A. Prange, Anal. Bioanal. Chem., 2006, 386, 7–11 CrossRef CAS.
- Z. A. Quinn, V. I. Baranov, S. D. Tanner and J. L. Wrana, J. Anal. At. Spectrom., 2002, 17, 892–896 RSC.
- S. Zhang, C. Zhang, Z. Xing and X. Zhang, Clinical Chemistry, 2004, 50, 1214–1221 Search PubMed.
- X. Lou, G. Zhang, I. Herrera, R. Kinach, O. Ornatsky, V. Baranov, M. Nitz and M. A. Winnik, Angew. Chem. Int. Ed., 2007, 46, 6111–6114 CrossRef CAS.
- M. Careri, L. Elviri, A. Mangia and C. Mucchino, Anal. Bioanal. Chem., 2007, 387, 1851–1854 CrossRef CAS.
- S. D. Tanner, O. Ornatsky, D. R. Bandura and V. I. Baranov, Spectrochim. Acta, Part B, 2007, 62, 188–195 CrossRef.
- O. I. Ornatsky, R. Kinach, D. R. Bandura, X. Lou, S. D. Tanner, V. I. Baranov, M. Nitz and M. A. Winnik, J. Anal. At. Spectrom., 2008, 23, 463–469 RSC.
- R. Ahrends, S. Piepe, A. Kuehn, H. Weisshoff, M. Hamester, T. Lindemann, C. Scheler, K. Lehmann, K. Taubner and M. W. Linscheid, Mol. Cell. Proteom., 2007, 6, 907–1916.
- R. W. Hutchinson, A. G. Cox, C. W. McLeod, P. S. Marshall, A. Harper, E. L. Dawson and D. R. Howlett, Anal. Biochem., 2005, 346, 225–233 CrossRef CAS.
- S. Hu, S. Zhang, Z. Hu, Z. Xing and X. Zhang, Anal. Chem., 2007, 79, 923–929 CrossRef CAS.
- H. John, M. Walden, S. Schaefer, S. Genz and W.-G. Forssmann, Anal. Bioanal. Chem., 2004, 378, 883–897 CrossRef CAS.
- A. Prange and D. Pröfrock, J. Anal. At. Spectrom., 2008, 23, 432 RSC.
- J. Fareed and et al., Clin. Chem., 1998, 44, 1845–1853 CAS.
- J. P. Roesner and et al., Crit. Care Med., 2007, 35, 1730–1735 CrossRef CAS.
- K. Zacharowski and et al., Shock, 2007, 27, 631–637 CrossRef CAS.
- P. Petzelbauer, P. A. Zacharowski, Y. Miyazaki, P. Friedl, G. Wickenhauser, F. J. Castellino, M. Gröger, K. Wolff and K. Zacharowski, Nat. Med., 2005, 11, 298–304 CrossRef CAS.
- D. Atar and et al., Cardiology, 2007, 108, 117–123 CrossRef CAS.
- Zs. Stefanka, G. Koellensperger, G. Stingeder and S. Hann, J. Anal. At. Spectrom., 2006, 21, 86–89 RSC.
Footnote |
| † Electronic supplementary information (ESI) available: Synthesis of the In-DOTA labeled peptide. See DOI: 10.1039/b807397j |
| This journal is © The Royal Society of Chemistry 2009 |
