Application of speciated isotope dilution mass spectrometry to evaluate methods for efficiencies, recoveries, and quantification of mercury species transformations in human hair
G. M. Mizanur
Rahman
*,
Timothy
Fahrenholz
and
H. M.
‘Skip’ Kingston
Department of Chemistry and Biochemistry, Duquesne University, Pittsburgh, PA 15282, USA. E-mail: rahman533@duq.edu; Fax: +1 412 396 5683; Tel: +1 412 396 4106
First published on 24th October 2008
Abstract
Nine different analytical extraction methods commonly used for mercury speciation in human hair samples were evaluated by analyzing hair certified reference material (IAEA-085) certified for the content of monomethyl mercury and total mercury. Extraction efficiencies, recoveries, as well as their potential of species transformations during sample processing, were evaluated by applying speciated isotope dilution mass spectrometry (SIDMS) as both a quantitative and diagnostic tool. The extraction methods evaluated in this study were based on acid leaching with HCl and HNO3. Detection of total mercury and mercury species from all extraction methods were carried out by inductivley coupled plasma mass spectrometry (ICP-MS) and high performance liquid chromatography-ICP-MS, respectively. Microwave-assisted extraciton (4 mol l−1 HNO3, at 100 °C for 10 min) and mechanical shaking (2 mol l−1HCl, at room temperature for 24 h) were found to be the most efficient protocols that demonstrated approximately 100% mecury recovery with less species transformations (6% or less). Ultrasound-assisted extraction (2% HCl + 10% ethanol, at 60 °C for 7 min) or extraction with 2 mol l−lHCl in a water bath (at 100 °C for 5 min) resulted in the second highest extraction efficiency (∼90%) with little or no mercury species transformations. Demethylation as high as 22% using 5 mol l−1 HNO3 in a water-bath heating (at 100 °C for 2 h) and 90% with cold acid digestion using concentrated HNO3 and H2O2 (room temperature for 24 h) were observed, however, all the extraction methods tested produced accurate quantitation when corrected in accordance with the SIDMS method standardized in the US Environmental Protection Agency's method 6800.
Introduction
Mercury in a variety of species is contributed to the environment from many sources both natural and anthropogenic. It exists naturally in mineral form, usually associated with ores and other geological materials. Mercury enters and is recycled in the environment from a variety of sources, including both natural and anthropogenic. Mercury occurs in the environment mainly in three species grouped in several categories such as metallic (elemental), inorganic and organic forms.1 The major routes of human exposure to mercury are by inhalation of mercury vapor (as Hg0), drinking water (as Hg2+), consumption of fish, fish products and marine mammals (as CH3Hg+) and usage of personal care products and pharmaceutical products such as vaccines and cleaning solutions for contact lenses (as CH3CH2Hg+).2,3 The different species of mercury have distinct toxicological effects and different routes of detoxification in the body.4Hg0 may penetrate cells where it forms Hg2+ and causes kidney toxicity.5 On the other hand, monomethyl mercury is easily absorbed from the gastrointestinal tract and distributed among various tissues, including the brain, through the neutral amino acid transport system, and induces neuronal cell damage.5 The permeability of CH3Hg+ at the blood-brain barrier is responsible for its hazardousness neurotoxic effects.4Mercury compounds, especially monomethyl mercury, are distributed in hair as well as in the liver, kidney and brain. To assess the human exposure, body fluids, such as blood and urine, or tissue, such as hair, have been analyzed. The contents of mercury species in hair may represent the cumulative exposure from the daily diet and/or occupational environment exposure. Although the level of total mercury in hair for a normal person is in the range of 0.4–6.0 µg g−1,5 a concentration greater than 50 µg g−1 is considered by the World Health Organization (WHO) to be neurotoxic.6 The United States Environmental Protection Agency (US EPA) estimates a lower threshold value of 10 µg g−1 to be neurotoxic.7 The level of mercury in hair for a normal person is about 300-times greater than that in blood, on the other hand, it is much lower in hair than that in blood for an autism spectrum disorder (ASD) person due to their inability of excreting mercury from their system.8 A hair sample is less invasive to acquire and it may be stored more easily and economically than blood. For long term exposure assessment and for the diagnosis of autisms, the concentrations of mercury species in hair are a more accessible measure of long term exposure biochemical marker.5
At present, mercury speciation in hair is analyzed through a multi-step procedure: digestion and/or extraction and determination. This study focuses on the digestion and extraction procedures applied in different published literature methods, because digestion and/or extraction is a critical quantitative step for the release of the mercury species bound to hair. In fact, the higher concentration of mercury species in hair is partially due to the presence of cysteine, which makes up approximately 14% of human hair by weight. Monomethyl mercury found in hair is bound to either the cysteine sulfur or the sulfhydryl (–SH) group present in other amino acids.9 Therefore, the digestion/extraction step has to be able to break the existing bonds between hair and monomethyl mercury, avoiding monomethyl mercury carbon-mercury bond cleavage. In the literature a numerous analytical methods, primarily based on two kinds of heated digestion/extraction protocols both acidic8,10–19 and basic20–27 followed by different solvent extraction, have been described for the determination of mercury species in hair samples. The final separation and detection techniques associated with these methods include gas chromatography (GC)10,12,14,16–18 or liquid chromatography (LC)9,28 coupled with element-selective detection techniques, e.g.graphite furnace atomic absorption spectrometry (GF-AAS),8,13,15inductively coupled plasma atomic emission spectrometry (ICP-AES),15 cold vaport atomic fluorescence spectrometry (CV-AFS),10,12,18inductively coupled plasma mass spectrometry (ICP-MS)9,15,28 or cold vapor atomic absorption spectrometry (CV-AAS).8,13,18 Most of the previously mentioned sample preparation methods use acids or bases with or without organic solvents for extraction, and after extraction most of them go through sample pre-concentration steps (e.g.ethylation or reduction with SnCl2, or hydride generation with NaBH4). Therefore, the possibility of bi- or unidirectional transformation from monomethyl mercury to inorganic mercury and/or inorganic mercury to monomethyl mercury may occur during the sample storage, shipment, extraction, pre-concentration, derivatization or analysis steps.29–31 As a result, the values obtained through these procedures frequently include positive or negative biases for either inorganic mercury or monomethyl mercury, or for both.
The present paper deals with the evaluation of nine diffenrt previously published extraction protocols for the accurate determination of mercury species in human hair samples. The methods evaluated in this study are based on acidic extraction applying different types of extraction techniques, e.g.sonication,29microwave-assisted extraction,30 heating in a water bath10,12–15 mechanical shaking13,18 and cold acid extraction.11,19Sample preparation with each of these methods is discussed in the Experimental Section. The real efficiency of these methods is generally unknown becasuse transformation of species is not assessed by standard extraction and sample preparation protocols. For this purpose, the authors compare the results obtained usign those methods both by applying external calibration and speciated isotope dilution analysis. Threfore, the primary goal of this paper is the study of the extraction efficiency and species transformations associated with each methods and the search for an optimum extraction methodology/conditions to perform the reliable mercury speciation analysis in human hair.
Using conventional analyses, critical comparison of these methods is difficult or impossible due to the different sources of errors that exist in mercury species determination. Since none of these methods can correct for any inter-conversion or transformation of mercury species, a newer analytical assessment technique, EPA Method 6800 (Elemental and Speciated Isotope Dilution Mass Spectrometry, SIDMS)32 was used. Then the second goal of this study was to apply the correction protocols for the comparison of the performance of various extraction procedures found in the literature to determine total mercury and mercury species using human hair certified reference material (IAEA 085) as a common sample. During this assessment, reagents and sample material were kept constant and analyses were carried out in the same clean laboratory and under the same conditions by a single analyst. With these conditions standardized, the performance of the overall methods could be reasonably attributed to variations in the efficiencies of the individual extraciton methods.33 SIDMS was used as a diagnostic tool and analytical determinative technique in this study. SIDMS is a unique tool capable of evaluating dual species transformation, can correct for both species simultaneously, and can also be used as a protocol step-evaluation tool, trapping errors from specific steps on procedures. Any inter-conversions that occur after spiking are traceable and can be quantitatively corrected by monitoring enriched reagent species isotopes equilibrated with each species. The SIDMS protocol is capable of measuring species concentrations at the time of spiking and by spiking a sample both before and after its extraction can assess transformation during this procedural step. SIDMS can be used to identify a procedure that alters species distribution in a multi-step protocol. The fundamental theory of SIDMS is established in environmental and biological samples, and has been well documented.31,32,34–51
Experimental
Reagents and chemicals
High-purity double deionized (DDI) water (18 MΩ cm−1) was prepared from a Barnstead NANOpure Ultrapure Water System (Dubuque, IA, USA) and used in the preparation of all solutions throughout this study. Reagent grade HNO3, HCl, H2O2, L-Cysteine and ethanol were obtained from Fisher Scientific (Pittsburgh, PA, USA). Nitric acid and hydrochloric acids were purified in-house prior to use by sub-boiling distillation of the reagent-grade acids in a quartz still (Milestone, Monroe, CT, USA).HPLC speciation mobile phase [0.4% (w/v) L-Cysteine, pH = 5], modified from Wan's procedure,52 was prepared by diluting 4.0 g of L-Cysteine (Fisher Scientific, Pittsburgh, PA, USA) in 1000 ml of DDI water.
Samples and standards
The sample used during this study was a hair certified reference material (IAEA-085) for total mercury and monomethyl mercury obtained from International Atomic Energy Agency (Vienna, Austria).A Method 6800-compliant mercury speciation analysis kit containing both naturally (isotopic) abundant and isotopically enriched inorganic mercury (199HgCl2) (91.95%), and both naturally (isotopic) abundant and isotopically enriched monomethyl mercury chloride (CH3200HgCl) (96.41%), and unique SIDMS-deconvolution software, were obtained from Applied Isotope Technologies, Inc. (Sunnyvale, CA, USA). All stock solutions were stored in amber glass bottle in a cold room at 4 °C. Working standards were made daily by proper dilution with DDI water. Caution:Mercury compounds, especially monomethyl mercury, are highly toxic materials. Proper knowledge and safety guidelines regarding working with mercury compounds are required to handle these compounds.
Instrumentation
A laboratory microwave system (Ethos 1600) (Milestone, Monroe, CT, USA), equipped with temperature and pressure feedback control and magnetic stirring capability was used in this study. This device is accurate in temperature sensing and control to within ± 2.0 °C of set temperatures, and automatically adjusts the microwave field output power to achieve preset temperatures. This device extracts ten or more samples simultaneously and the high pressure rotor was used with ten simultaneous extraction vessels per batch. The high-pressure (maximum operating pressure and temperature: 100 bar and 300 °C) closed digestion vessels (Model - SK10, Milestone, Monroe, CT, USA) used for both digestions and extractions are made of high purity TFM (a thermally resistant form of fluoropolymer) and have a capacity of 100 ml each. An ultrasonicator (Branson Co., Model 5210-DTH, power 185 W, frequency 47 kHz, USA) was used in this study.Caution: Safety guidelines regarding work with microwave fields in the laboratory must be observed. 53
The isocratic liquid chromatography system, consisting of a 709 IC polymeric inert pump (Metrohm Peak, Houston, TX, USA), an 838-advanced sample processor with a 100 µl sample loop was used to automate the sample delivery and sample handling using inert chemical components throughout the automation system (Metrohm Peak, Houston, TX, USA). Chromatography columns used were a Novapak™ C18 reverse-phase column (150 × 3.9 mm, 4 µm) supplied by Waters (Waters HPLC Columns, Milford, MA, USA) which were used in this study to separate inorganic mercury and monomethyl mercury prior to ICP-MS analysis. Because no special interface was required between the C18 column and the ICP-MS, one outlet of the column was directly interfaced to the nebulizer of the ICP-MS with a piece of PEEK tubing; the other end was connected to a 100 µl sample loop of the 838-advanced sample processor. The chromatography and automation equipment were housed in a high efficiency particulate air (HEPA) filter class 100 clean hood chamber constructed at Duquesne University located adjacent to the ICP-MS both located in a class 1000 instrument clean room laboratory.
An HP 4500 ICP-MS (Agilent Technologies, Palo Alto, CA, USA and Yokogawa Analytical System Inc., Tokyo, Japan) was used as detector for the HPLC system in this study. The sample delivery system consisted of a peristaltic pump and a Scott-type double-pass quartz spray chamber with concentric nebulizer and quartz torch. The instrument was fitted with platinum sampler and skimmer cones and optimized daily using 10 ng ml−1 tuning solution (Agilent Technologies, Palo Alto, CA, USA) containing Li, Y, Ce and Tl in 0.4% (w/v) L-cysteine (for speciation analysis) and in 1% (v/v) HNO3 (for total mercury analysis). The Spectrum mode was engaged for total mercury analysis: the Time Resolved Analysis (TRA) mode was engaged for speciation analysis. The ICP-MS operating conditions for total mercury and speciation analysis are given in Table 1.
| Measurement parameters of the HP-4500 ICP-MS system | |
|---|---|
| a Total Hg analysis. b Hg speciation analysis. c IDMS analysis. d SIDMS analysis. e External calibration. | |
| Acquisition mode | Spectrum a, Time resolved analysis (TRA)b |
| Isotope monitored | 199Hg c,d, 200Hgd, 202Hgc,d,e |
| Integration time per mass/s | 0.2a,b |
| Replicates | 5a, 1b |
| Total analysis time/s | 25a, 200b |
| HPLC conditions:Column | Novapak™ C18 RP, 150 × 3.9 mm, 4µm (Waters) |
| Injection volume/µl | 100 |
| Column temperature | Ambient |
| Mobile phase | 0.4% (w/v) L-cysteine, pH 5 |
| Elution | Isocratic |
| Flowrate/ml min−1 | 1.0 |
Sample preparation procedure
In order to perform the isotope dilution mass spectrometry (IDMS) analysis for the determination of total mercury content in the hair standard, approximately 0.5 g of representative aliquots of hair sample were weighed into four microwave vessels, then 0.5 g of 10.0 µg g−1199Hg2+ were added to each vessels followed by the addition of 9 ml of concentrated HNO3 and a magnetic stirrer bar. The vessels were sealed and digested according to EPA Method 3052. After digestion, the sample aliquots were filtered using a 0.22 µm Millipore glass fiber filter and stored at 4 °C until analysis.
| Extraction procedure | Mass of sample (mg) | Extraction solvent | Volume of extraction solvent (ml) | Extraction technique/extraction temperature | Total extraction time (min) | References |
|---|---|---|---|---|---|---|
| 1 | 50 | 2 mol l−1HCl | 5 | Water bath/100 °C | 5 | 16 |
| 2 | 100 | 2 mol l−1HCl | 2 | Water bath/100 °C | 15 | 12 |
| 3 | 200 | 4% (v/v) HCl | 3 + 2 | Mechanical shaker/room temperature (22 °C) | 4 | 13 |
| 4 | 100 | 2 mol l−1HCl | 5 | Mechanical shaker/room temperature (22 °C) | 240 | 18 |
| 5 | 200 | 2 mol l−1 HCl | 5 | Set on bench top/room temperature (22 °C) | 1440 | 19 |
| 6 | 50 | 5 mol l−1 HNO3 | 0.35 | Water bath/100 °C | 120 | 10 |
| 7 | 100 | 15 mol l−1 HNO3 and 30% H2O2 | 3 | Set on bench top/room temperature (22 °C) | 1440 | 11 |
| 8 | 500 | 4 mol l−1 HNO3 | 10 | Microwave/100 °C | 10 | 29 |
| 9 | 500 | 2% (v/v) HCl + 10% (v/v) Ethanol | 10 | Sonication bath/60 °C | 30 | 30 |
Procedure 1. For acid leaching with 2 mol l−1HCl,16 four 50 mg sub-samples of the hair reference material was placed in a 15-ml disposable glass centrifuge tube with snap on cap, to which two drops of ethanol, 5 ml of 2 mol l−1HCl were added. A small amount of mercury-free cotton was added to prevent the hair from floating. The centrifuge tube was tightly capped, and heated at 100 °C in a water bath for 5 min. The sample solution was then stirred well using a vortex mixer and then centrifuged for 5 min at 3200 rpm. The cooled extract was transferred into 50 ml polypropylene graduated centrifuge tube and diluted to 20 ml by adding DDI water.
Procedure 2. For acid leaching with 2 mol l−1HCl,12 a 100 mg portion of hair sample was placed in 15 ml disposable glass centrifuge tubes with snap-on caps, to which 2 ml of 2 mol l−1HCl was added. The centrifuge tubes were tightly capped and heated at 100 °C in a water bath for 15 min. The sample solutions were then centrifuged for 5 min at 3200 rpm. The cooled extract were transferred into 50 ml polypropylene graduated centrifuge tubes and diluted to 20 ml by adding DDI water.
Procedure 3. For acid leaching with 4% (v/v) HCl,13 a 3 ml portion of 4% (v/v) HCl was shaken on a mechanical shaker with 200 mg of hair for 2 min. The hair was then separated by centrifugation at 2700 rpm for 20 min. The supernatant containing the monomethyl mercury was transferred into 50 ml polypropylene graduated centrifuge tube. The process was repeated with 2 ml of 4% (v/v) hydrochloric acid, and the combined supernatants were made up to 20 ml with DDI water.
Procedure 4. For acid leaching with 2 mol l−1HCl,18 approximately 100 mg of hair sample was put into 50 ml polypropylene graduated centrifuge tubes and 5 ml of 2 mol l−1HCl was added. The tubes were closed and shaken on a mechanical shaker for 4 h. The tubes were then centrifuged at 2500 rpm for 20 min. The supernatant containing monomethyl mercury was transferred into a 50 ml polypropylene graduated centrifuge tube, and diluted with DDI water to 20 ml.
Procedure 5. For cold acid digestion with 2 mol l−1HCl,19 approximately 200 mg of hair sample was weighed into 50 ml polypropylene graduated centrifuge tubes and 5 ml of 2 mol l−1HCl was added into each tube. The tubes were closed and kept on bench top for 24 h. The tubes were then centrifuged at 2500 rpm for 20 min. The supernatant containing monomethyl mercury was transferred into a 50 ml polypropylene graduated centrifuge tube, and diluted with DDI water to 20 ml.
Procedure 6. For acid leaching with 5 mol l−1 HNO3,10 approximately 50 mg of hair sample was placed in a 15-ml disposable glass centrifuge tube with snap-on cap, to which 350 µl of 5 mol l−1 HNO3 was added. The centrifuge tube was loosely capped, and heated at 100 °C in a water bath for 120 min. The sample solution was then stirred well using a vortex mixer and then centrifuged for 5 min at 3200 rpm. The cooled extract was transferred into 50 ml polypropylene graduated centrifuge tube and diluted to 20 ml by adding DDI water.
Procedure 7. For cold acid digestion with concentrated HNO3 and 30% H2O2,11 approximately 100 mg portion of the sample was weighed into 15 ml centrifuge tubes; 2 ml of concentrated HNO3 and 1 ml of 30% H2O2 were added. The mixture was then vortexed for 1 min and kept on a bench-top overnight. The next day, the mixture was vortexed for 1 min and then centrifuged for 5 min at 3500 rpm. The extracts were transferred into 50 ml polypropylene sample vials, and diluted with DDI water to 20 ml.
Procedure 8. For microwave-assisted extraciton,29 four 500 mg sub-samples of the hair sample were weighed into individual pre-cleaned fluoropolymer digestion vessels. 10 ml of 4 mol l−1 HNO3 was placed in each of the microwave extraction vessels. A magnetic stirrer bar was added to each vessel for thorough mixing of solvent with the sample. The microwave vessels were sealed and irradiated at 100 °C for 10 min with magnetic stirring on. A 2 min ramping time was used to reach the desired temperature of 100 °C. After microwave irradiation, the vessels were cooled to room temperature, filtered through 0.22 µm glass fiber filter (Fisher Scientific, Pittsburgh, PA, USA) into 50 ml polypropylene graduated centrifuge tube, and diluted with DDI water to 20 ml.
Procedure 9. For ultrasound-assisted extraction,30 approximately 500 mg portions of the hair sample were weighed into four disposable glass centrifuge tubes; 2.5 ml of extraction solvent (2% (v/v) HCl + 10% (v/v) Ethanol) was added in each tube. The mixture was then vortexed for 1 min and sonicated at 60 ± 2 °C for 7 min in a bath-type sonicator. The extracts were then centrifuged at 3200 rpm for 5 min. The cooled extracts were transferred into 50 ml sample vials and the extraction process was repeated three more times. All of the extracts were added together and diluted to 20 ml with DDI water.
Total mercury determinatin by ICP-MS. In order to compare the certified total mercury value with those determined during this study were performed by the analysis of the digested and extracted mercury solutions using ICP-MS in spectrum mode. The plasma parameters used for the analysis are summerized in Table 1. Total mercury concentrations were determined by external calibration and IDMS. Calibration was performed by using 1–20 ng ml−1Hg2+ standards in 0.5% (v/v) HNO3. The most abundant mercury isotope, m/z 202, was used for data evaluation; similar results were obtained using the mercury isotopes m/z 199 and 200.
Mercury species determination by HPLC-ICP-MS. Analyses were performed in time resolved analysis mode. The experimental conditions are given in Table 2. Eas sample was analyzed four times to enable statistical evaluation of the samples (n = 4 × 4). Data evaluation was performed using the ChemStation software supplied with the instrument, and quantification was based on peak area by external calibration. The most abundant mercury isotope, m/z 202, was used for data evaluation; similar results were obtained using the mercury isotopes m/z 199 and 200.
Peak areas were used to calculate isotope ratios 199Hg/202Hg and 200Hg/202Hg, from which the Hg2+ and CH3Hg+ concentrations in IAEA-085 were calculated. All isotope ratios were corrected for the detector dead time, and a natural abundance standard solution of Hg2+ and CH3Hg+ was measured periodically between samples to calculate the mass bias correction factor. Further, this double spike approach allowed tracking of any artifact methylation/demethylation reactions that occurred during the sample preparation and/or analysis process. The calculations were carried out using the software provided by Applied Isotope Technologies, Inc. SIDMS protocol uses direct mathematical algorithmic solutions for isotope ratio calculations and quantitative determinations instead of conventional calibration curves. These direct solutions were used as specified in EPA Method 6800 for all species calculations.
Results and discussion
Evaluation of analytical protocols required a homogeneous reproducible sample that would not contribute to the method related bias and extraction efficiency. The choice of the hair certified reference material IAEA-085 provided the homogeneous and consistent sample to eliminate this bias from the evaluation of the extraction procedures. Homogeneity at the 50 mg sub-sample level is adequate to accomplish this goal with this particular material.Determination of total mercury with EPA Methods 3052 and 6800 (IDMS)
A much different sample preparation from the speciated extraction methods under evaluation is required to determine the total mercury content in the hair certified reference material (CRM), the hair CRM was digested according to EPA Method 3052.54 The digest was then analyzed with ICP-MS in spectrum mode. The concentration of total mercury was then determined from the external calibration curve produced from the mercury standard, and from the IDMS calculation software for total mercury provided by Applied Isotope Technologies, Inc. It was observed that the measured total mercury concentration (23.19 ± 0.73 µg g−1, external calibration curve, and 23.03 ± 0.37 µg g−1, IDMS) of the studied CRM overlapped with the IAEA certified value (23.2 ± 0.8 µg g−1) at its 95% confidence interval (CI) and it was therefore determined that the three values were statistically indistinguishable. The recovery of mercury was satisfactory in the range from 97 to 103% (external calibration); and 98 to 101% (IDMS) of the cetified value.Evaluation of the extraction efficiency of some selected mercury speciation methods using conventional extraction protocols
The aim of this study was to evaluate the extraction efficiency of nine selected extraction methods used for mercury speciation analysis in biological samples. The performance of these methods were evaluated by analyses of IAEA-085 with certified values for total mercury and monomethyl mercury, respectively. These nine extraction methods are independent and unique in their approaches to sample extraction of the mercury species (Table 2). All the procedures tested during this study were based on acid leaching using either HCl or HNO3 at different concentrations. Procedures 1, 2 and 6 used conventional heating in a water bath at 100 °C for different heating times. Procedures 3 and 4 both used mechanical shaking at room temperature (22 °C) with different acid concentrations as well as extraction times. Procedures 5 and 7 used the same extraction set up (set on bench top at room temperature) with different acid compositions. Furthermore, acid leaching using microwave-assisted extraction with 4 mol l−1 HNO3 (procedure 8) and ultrasound-assisted extraction with 2% (v/v) HCl + 10% (v/v) ethanol (procedure 9) were tested. Among the procedures, the use of 4% (v/v) HCl (procedure 3) resulted in the fastest method, compared with procedures 5 and 7 [acid leaching with 2 mol l−1HCl and a mixture of 15 mol l−1 HNO3 and 30% H2O2, respectively], which both require 24 h.After extraction of the sample (without isotopic labeling) with each of the extraction methods evaluated during this study, the extracts were analyzed with HPLC-ICP-MS for mercury speciation. The chromatographic method used for this analysis is based on the separation of Hg2+ and CH3Hg+ as cysteine-mercury complexes on a silica based C18 reverse phase column. The chormatographic conditions are reported in Table 1. A typical chromatogram of Hg2+ and CH3Hg+ in aqueous standard solution (10 ng ml−1 as Hg) using the optimal operating conditions is shown in Fig. 1. As shown, both mercury species were fully separated within 3 min. The column was flushed after use with an aqueous solution of 5% (v/v) methanol for at least 30 min at a flow rate of 1 ml min−1. The concentration of inorganic mercury and monomethyl mercury in different samples was determined by external calibration technique. The calibration curves based on peak area were linear for both mercury species in the range from 1 to 25 ng ml−1. The observed detection limits of 202Hg (calculated as 3σ of the baseline noise, based on peak height) were 0.58 ± 0.05 ng ml−1, and 0.78 ± 0.09 ng ml−1 for Hg2+ and CH3Hg+, respectively. The total mercury concentration was determined by the summation of inorganic mercury and monomethyl mercury concentrations measured from their corresponding peak areas using external calibration technique. The concentrations of inorganic mercury, monomethyl mercury and total mercury in IAEA-085 by HPLC-ICP-MS from using each of the studied methods are compiled in Table 3, and are evaluated and discussed as they relate to the different methods of extraction. The values reported in parentheses in Table 3 represent the percent recovery of the corresponding mercury species, calculated from the certified value.
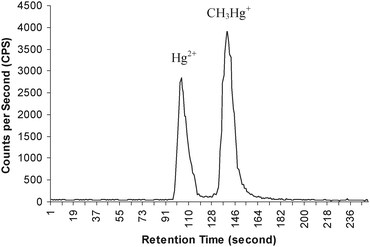 | ||
| Fig. 1 Typical chromatogram for speciation of inorganic mercury and monomethyl mercury from HPLC-ICP-MS. Flow rate: 1 ml min−1; eluent: 0.4% L-Cysteine (pH 5); column: C-18 RP (NovaPak™, 150 × 3.9 mm, 4 µm). | ||
| Extraction procedure | Hg2+ (as Hg) (µg g−1) | CH3Hg+ (as Hg) (µg g−1) | Sum of species (µg g−1) |
|---|---|---|---|
| a Certified total Hg is = 23.2 ± 0.8 µg g−1, certified CH3Hg+ is = 22.9 ± 1.0 µg g−1 and estimated Hg2+ is = 0.1 – 0.5 µg g−1. b The percent recoveries of total Hg and CH3Hg+ are indicated in parentheses. c DL (detection limit): Inorganic mercury = 0.58 ng ml−1; monomethyl mercury = 0.78 ng ml−1. | |||
| 1 | 0.63 ± 0.18 | 20.10 ± 0.26 | 20.73 ± 0.32 |
| (88 ± 1) | (89 ± 1) | ||
| 2 | 0.23 ± 0.02 | 19.88 ± 1.36 | 20.11 ± 1.36 |
| (87 ± 6) | (87 ± 6) | ||
| 3 | < DLc | 20.36 ± 1.05 | 20.36 ± 1.05 |
| (89 ± 5) | (88 ± 5) | ||
| 4 | 0.27 ± 0.29 | 22.36 ± 0.86 | 22.63 ± 0.91 |
| (98 ± 4) | (98 ± 4) | ||
| 5 | < DL | 18.38 ± 0.93 | 18.38 ± 0.93 |
| (80 ± 4) | (79 ± 4) | ||
| 6 | 8.89 ± 0.69 | 12.83 ± 0.68 | 21.72 ± 0.97 |
| (56 ± 3) | (94 ± 4) | ||
| 7 | 23.57 ± 0.78 | 1.62 ± 0.15 | 25.19 ± 0.79 |
| (7 ± 1) | (109 ± 3) | ||
| 8 | 1.80 ± 0.61 | 22.67 ± 1.54 | 24.67 ± 1.65 |
| (99 ± 7) | (106 ± 7) | ||
| 9 | 0.33 ± 0.06 | 20.87 ± 0.37 | 21.21 ± 0.38 |
| (91 ± 2) | (91 ± 2) |
For total mercury, it can be seen from Table 3 that no significant difference was found between the certified value and those produced by procedures 4, 7 and 8 [acid leaching using 2 mol l−1HCl, 15 mol l−1 HNO3 + 30% H2O2, and 4 mol l−1 HNO3]; the mercury extraction recovery were 98 ± 4, 109 ± 3 and 106 ± 7%, respectively. Procedures 1, 2, 3, 6 and 9 [2 mol l−1HCl, 4% (v/v) HCl, 5 mol l−1 HNO3 and 2% HCl + 10% ethanol] extracted approximately 90% of total mercury from the studied material. Mercury extraction recovery was lower for procedure 5 [2 mol l−1HCl]. The total mercury recovery was 79% in procedure 5. Although procedures 1 and 2 both used 2 mol l−1HCl and water bath as a heating source (100 °C) with different heating times, 5 and 15 min, respectively, but the mercury recovery in both procedures were statistically indistinguishable. Procedure 6 applied the same extraction protocol with HNO3 as a solvent and much longer heating time which almost dissolved the hair sample and as a result the mercury recovery was higher than procedures 1 and 2. Procedures 3 (4% HCl) and 4 (2 mol l−1HCl) both used mechanical shaking at room temperature but the mercury recovery was higher in procedure 4 (98 ± 4%) due to longer shaking time and more concentrated HCl which helps to break the S–Hg bond in hair. Although procedures 5 and 7 both used the cold digestion protocol, the mercury recovery in procedure 7 was higher (109 ± 3%) than procedure 5 (79 ± 4%). This anomaly was due to the application of different type of extraction solvent. Procedure 5 used 2 mol l−1HCl whereas procedure 7 used mixed solvent containing concentrated HNO3 and H2O2. The concentrated mixed solvent actually completely dissolved the hair sample whereas the 2 mol l−1HCl acted as a leaching solution which did not dissolve the hair sample. Procedure 8 (4 mol l−1 HNO3) produced higher mercury recovery (106 ± 7%) due to complete dissolution of hair sample than that of procedure 9 (2% HCl + 10% ethanol) (91 ± 2%) which is in fact an acid leaching protocol. The lower recoveries of mercury in different studied extraction methods suggest that those were due to the insufficient dissolution of the S–Hg bond in hair. In comparing the application of HNO3 and HCl, it is observed that HNO3 completely dissolve hair sample and produces higher mercury recovery than HCl at low concentrations (2 mol l−1 or less).
The extraction efficiencies for total mercury and monomethyl mercury in procedure 1 were 89 ± 1% and 88 ± 1%, respectively, of the certified value, and inorganic mercury was also in the range of the calculated value. These results confirm that the predominant species of mercury in the hair sample was monomethyl mercury, which, on the average, represents 90% of the total mercury. Diez et al.12 method (procedure 2) extracted 87 ± 6% of monomethyl mercury and inorganic mercury concentration. This was in the range of the calculated value of the certificate of analysis for IAEA-085. During the method development study, Diez et al. studied a human hair certified material from the National Institute of Environmental Studies (NIES CRM No. 13) for monomethyl mercury, their percent recovery was 95 ± 11%. No inorganic mercury data was reported in that reference.12 During this study, a different CRM (IAEA-085) was used and both inorganic mercury and monomethyl mercury were measured. The percent recovery of monomethyl mercury during this study was 87 ± 6% and which is statistically indistinguishable from the reported value by Diez et al. Procedures 3 and 5 extracted 89 ± 5% and 80 ± 4%, respectively, of monomethyl mercury, but no inorganic mercury was detected during analysis (DL = 0.78 ng ml−1). The Bermejo et al.13 (procedure 3) study used the IAEA-085, the reported percent recovery for total mercury and monomethyl mercury was 97 ± 1% and 101 ± 2, respectively. But in this study, the percent recovery for both total mercury and monomethyl mercury was lower, 89 ± 5% and 88 ± 5%, respectively, but very close to the value reported by Bermejo et al. Procedure 4 demonstrated better recoveries on both total mercury (98 ± 4%) and monomethyl mercury (98 ± 4%), but the recovery of the inorganic mercury was poor due to the higher uncertainty value. The finding from the current study is in good agreement with their reported results. The extraction efficiency of procedure 6 for total mercury was 94 ± 4%, but it induced a large amount of transformation from monomethyl mercury to inorganic mercury during extraction. As a result, the percent recovery of monomethyl mercury was low (56 ± 3%). Similarly, a more severe conversion was observed with procedure 7, reporting recoveries of total mercury and monomethyl mercury of 109 ± 3% and 7 ± 1%, respectively. The converted monomethyl mercury from both of these two aforementioned extraction methods (procedures 6 and 7) was detected as inorganic mercury during HPLC-ICP-MS analysis, indicating quantitative conversion of monomethyl mercury to inorganic mercury. The calculated value for the inorganic mercury in the studied material is in the range of 0.1–0.5 µg g−1. The measured concentration of inorganic mercury using procedures 6 and 7 was 8.89 ± 0.69 µg g−1 and 23.57 ± 0.78 µg g−1, respectively. Therefore, these two methods, if used with traditional quantitative analysis methods, appear to be unsuitable for mercury speciation analysis, as significant conversion of monomethyl mercury, for the test material in this study, is caused by these protocols.
Procedure 8 (4 mol l−1 HNO3), which was initially developed for mercury speciation in soils and sediments, was evaluated during the current study. The results demonstrated that the extraction efficiencies of this method for total mercury (106 ± 7%) and monomethyl mercury (99 ± 7%) are high and comparable with that of the procedure 4, although the inorganic mercury result was higher (1.80 ± 0.61 µg g−1) than the calculated value (0.1–0.5 µg g−1). Furthermore, procedure 9, which was also initially developed for mercury speciation in soils and sediments, was applied here for mercury speciation in hair sample. It is observed from this study that the extraction efficiency of procedure 9 for both total mercury and monomethyl mercury was 91 ± 2% of the certified value, and inorganic mercury was also in the range of the calculated value.
Since it is demonstrated from this study that the extraction efficiency of procedures 4 and 8 for monomethyl mercury was 98 ± 4% and 99 ± 7%, respectively, and did not induce monomethyl mercury to transform into inorganic mercury or vice versa, any one, or both, of these two extraction methods are appropriate (only based on the extraction efficiency) for the traditional analytical mercury speciation in hair sample matrices. On the other hand, if overall sample throughput and extraciton efficiency are considered to be the basis of specieation method selection then procdure 8 (10 min) is better than procedure 4 (240 min).
During the evaluation of Hg2+ concentration for the extraction methods, lower precision in these resutls was observed. The studied certified reference material (IAEA-085) is not certified for Hg2+, but is only for CH3Hg+ and total mercury. The concentration of the Hg2+ was calculated from the difference in these two values and found to be approximately 0.1 to 0.5 µg g−1 in the solid certified reference material. Due to low concentration, noncertified values and high uncertainties in the values of Hg2+ did not yield statistically meaningful comparision between extraction methods.
Evaluation of selected mercury speciation methods using diagnostic SIDMS procedure
The basic application of SIDMS depends on some fundamental operations: enriched stable speciated isotopic spike preparation and calibration and/or purchase of enriched stable isotopic spike analogue; sample collection and sample spiking; sample species and spike species equilibration; sample extraction; species separation; isotope ratio measurements of each speciated component; determination of species concentrations and mathematical deconvolution of species transformations. The method is a direct mathematical solution that does not use traditional calibration curves. Species transformations do not produce bias in SIDMS but are calculated and corrected for in the mathematical protocol specified in EPA Method 6800.To perform SIDMS analysis, completely new batch of samples were processed by each individual sample preparation methods applying fresh IAEA-085 material. A known amount of IAEA-085 was double spiked with known amounts of isotopically enriched stable inorganic mercury (199Hg2+) and monomethyl mercury (CH3200Hg+) in such a way that the desired isotope ratios 199Hg/202Hg and 200Hg/202Hg becomes close to the optimum required isotope ratio (0.1:1, sample:spike) in the mass spectrometer. After equilibration with the sample species, the samples were extracted using the corresponding studied method protocol and the extracts were analyzed with HPLC-ICP-MS. The deadtime and mass bias corrected isotope ratios for 199Hg/202Hg and 200Hg/202Hg were calculated for both inorganic mercury and monomethyl mercury in each of the sample replicates. The SIDMS calculations were performed to determine the concentration of inorganic mercury and monomethyl mercury, and to deconvolute the interspecies transformations using the SIDMS software provided by Applied Isotope Technologies, Inc., as a components of a Mercury Speciation Kit. The software that performs the concentration and correction calculations from the corrected isotopic ratios is keyed to the specific enriched isotopic reagent batch which is necessary as each batch has values that change with their production. A detailed description of data processing and application of SIDMS software algorithms has been reported elsewhere.31,42
The final concentrations of inorganic mercury and monomethyl mercury in IAEA-085, the percent transformation of inorganic mercury to monomethyl mercury, and vice versa, during extraction are summarized in Table 4. The sum of the mercury species was calculated and the percentage of recovery with respect to the certified values can also be evaluated. It is demonstrated in Table 4 that the percent recoveries of monomethyl mercury obtained using SIDMS protocol for eight out of nine extraction procedures evaluated (with the exception of procedure 9) were in good agreement with the certified reference value at 95% CI. Monomethyl mercury recoveries were corrected to within a range of 96 – 115%. The high percent recovery of monomethyl mercury using SIDMS protocol is due to the complete equilibration of sample species with the isotopically enriched species. For extraction procedure 9, the monomethyl mercury recovery was 87 ± 6%. A previous study incorporating procedure 9 observed that this method is capable of extracting approximately 90% of mercury species present in soil or sediment samples.31 The same trend was also observed during the current study, which is probably due to the poor extraction efficiency of the ultrasonic method as well as lack of complete equilibration of the sample species and the spike species isotopes. The concentrations of inorganic mercury obtained in different extraction methods are approximately 1 µg g−1, and are statistically indistinguishable at their 95% CI. However, the measured values with different extraction methods are higher than the calculated value (0.1–0.5 µg g−1). As expected, the SIDMS protocol was able to overcome nonquantitative recoveries and species transformations observed during evaluation of the extraction procedures.
| Extraction procedure | Hg2+ (as Hg) (µg g−1) | CH3Hg+ (as Hg) (µg g−1) | Sum of species (µg g−1) | Mean degree of transformation (%) | |
|---|---|---|---|---|---|
| Hg2+ to CH3Hg+ | CH3Hg+ to Hg2+ | ||||
| a Certified total Hg is = 23.2 ± 0.8 µg g−1, certified CH3Hg+ is = 22.9 ± 1.0 µg g−1 and estimated Hg2+ is = 0.1 – 0.5 µg g−1. b The percent recoveries of total Hg and CH3Hg+ are indicated in parentheses. | |||||
| 1 | 1.96 ± 0.59 | 23.81 ± 0.67 | 25.77 ± 0.89 | ≤ 0 | ≤ 0 |
| (104 ± 3) | (111 ± 4) | ||||
| 2 | 1.36 ± 0.39 | 24.82 ± 1.59 | 26.18 ± 1.64 | ≤ 0 | 4 ± 1 |
| (108 ± 7) | (113 ± 7) | ||||
| 3 | 1.32 ± 0.16 | 22.39 ± 0.49 | 23.71 ± 0.52 | 4 ± 1 | 2 ± 1 |
| (98 ± 2) | (102 ± 2) | ||||
| 4 | 1.15 ± 0.40 | 23.49 ± 0.49 | 24.64 ± 0.63 | 4 ± 2 | 3 ± 1 |
| (103 ± 2) | (106 ± 3) | ||||
| 5 | 1.00 ± 0.56 | 23.62 ± 0.57 | 24.62 ± 0.80 | 2 ± 2 | 5 ± 2 |
| (103 ± 3) | (106 ± 3) | ||||
| 6 | 1.15 ± 0.42 | 25.17 ± 0.96 | 26.32 ± 1.05 | 14 ± 2 | 22 ± 2 |
| (110 ± 4) | (113 ± 5) | ||||
| 7 | 1.09 ± 0.23 | 23.50 ± 1.21 | 24.59 ± 1.23 | ≤ 0 | 90 ± 5 |
| (103 ± 5) | (106 ± 5) | ||||
| 8 | 0.59 ± 0.22 | 23.65 ± 1.42 | 24.24 ± 1.44 | 4 ± 2 | 6 ± 1 |
| (103 ± 6) | (105 ± 6) | ||||
| 9 | 1.13 ± 0.25 | 19.80 ± 1.25 | 20.93 ± 1.28 | 9 ± 3 | 0 ± 1 |
| (87 ± 6) | (90 ± 6) | ||||
The percentage of mercury species transformations obtained using the studied extraction methods are also shown in Table 4. The mercury species transformation results agree with those obtained from the conventional extraction methods. It is observed that three out of nine extraction methods did not induce any methylation while six other extraction methods induced methylation. The degeree of methylation was not statistically significantly different in four extraction methods and were within the range of 2–4%. The largest amount of methylation was observed for procedure 6 (5 mol l−1 HNO3), in which the percentage of methylation was as high as 14%. Because of the relatively low ratio of Hg2+ to CH3Hg+ in hair sample, high methylation did not cause a significant error when external calibration was used. However, caution should be exercised with biological samples in which the ratio of Hg2+ to CH3Hg+ is high.
It can be observed from Table 4 that the demethylation occurred in seven out of nine of the extraction procedures evaluated. As a consequence, for determination of CH3Hg+ and Hg2+ concentrations, both reactions should be considered, particularly if both species are present in similar concentration range. Demethylation resulting from the application of procedures 1 and 9 are negligible. The degree of demethylation in five of the studied extraction methods were statistically indistinguishable and were within the range of 2–6%. However, for procedure 6 (5 mol l−1 HNO3), demethylation of up to 22% was observed. On the other hand, cold acid digestion using concentrated HNO3 and H2O2 (procedure 7) induced the highest degree of demethylation, where the degree of demethylation increased to 90 ± 5%. The higher measured value of inorganic mercury in procedures 6 and 7 using external calibration protocol reflects the influence of a potential demethylation reaction in those procedures. It is documented here that the SIDMS technique was able to quantify 100% accurate concentration of both species in the hair reference material, although a large amount of mercury species conversion took place during extraction with several of the studied methods. This is a unique benefit of the SIDMS technique, that it can correct and measure the true concentration of any species at the time and after spiking if the sample species and the isotopic analogue of the species are equilibrated before losses or species transformation takes place. Column 3 in Table 4 shows that the SIDMS corrected monomethyl mercury species transformation including where 90% of the monomethyl mercury species was transformed into inorganic mercury. Thus SIDMS used in conjunction with any of these extraction methods permits correct species quantification.
The conversion of a species that approach greater than 99% indicates near to or complete conversion of that species into another one. Such a complete species conversion demonstrates a matrix-effect that precludes the presence of the converted species under these conditions. Measurements of Eh, pH, and other matrix components do not accurately predict this situation. Under such a condition, SIDMS (EPA Method 6800) provides information about the species instability in this matrix definitively and accurately. In this case, however, quantitative species calculations can not be done since the completely converted species is not present in that matrix at a statistically detectable concentration. The determination of complete conversion is as valuable as quatitation of partial species conversion, since the determination provides a definitive, deterministic assessment of one species conversion to another.
It is demonstrated in Tables 3 and 4 that the procedures 4 and 8 have better extraction efficiency, with similar transformations between species compared with other extraction methods studied; however, the required extraction time was significantly reduced using the microwave method (procedure 8). Although procedures 1 and 2 induced no or less species transformations but the extraction efficiencies of these two methods were lower than procedures 4 and 8. Due to the greater amount of species transformations in procedures 6 and 7, the application of these two extraction processes in mercury speciation analysis will cause overestimation of the concentration of inorganic mercury and, concurrently, underestimation of the monomethyl mercury concentration if conventional calibration methods are used to quantify the species.
Conclusions
The evaluation of nine published extraction methods for mercury speciation in human hair samples has been performed using both conventional and SIDMS techniques. Results for procedures 4, 8 and 9 agreed in both techniques. Procedures 1, 2, 3 and 5 provided higher extraction recovery of both monomethyl mercury and total mercury with the SIDMS technique compared to those obtained in the conventional technique. The higher percent recovery of all the mercury species with the SIDMS technique is due to the complete equilibration of the sample species with the enriched isotopic spike species and correction of degraded species using mathematical algorithms. Seven out of nine extraction methods did induce no or less but similar transformations of monomethyl mercury to inorganic mercury or vice versa. Of these seven methods, procedures 4 and 8 demonstrated the optimal extraction efficiency for these mercury species. Procedures 6 and 7 demonstrated higher extraction efficiency on inorganic mercury with induced larger amount of monomethyl mercury transformation to inorganic mercury. These two methods induced significant conversions, approximately 22% and 90% of monomethyl mercury to inorganic mercury during extractions, respectively. Therefore, these two methods are not suitable for mercury speciation in hair samples by conventional calibration methods. However all of the methods tested could be corrected using isotopic correction using SIDMS protocol to prevent relative biases from being interpreted as accurate species measurement. This indicates that as long as isotopic equilibration is achieved that the sample preparation and extraction errors may be corrected and accurate legally defensible results can be obtained.Acknowledgements
This authors wish to thank and acknowledge the funding of this study by the Pittsburgh Life Sciences Greenhouse (PLSG). We thank Milestone Inc, Metrohm Peak, Applied Isotope Technologies, Inc., Agilent Technologies, and Duquesne University for instrumental and material support. Portions of this research are patented or have patents pending.References
- M. A. McDowell, C. F. Dillon, J. Osterloh, P. M. Bolger, E. Pellizzari, R. Fernando, R. Montes de Oca, S. E. Schober, T. Sinks, R. L. Jones and K. R. Mahaffey, Environ. Health Perspect., 2004, 112(11), 1165–1171 CAS.
- A. Yasutake, M. Matsumoto, M. Yamaguchi and N. Hachiya, J. Health Sci., 2004, 50(2), 120–125 CrossRef CAS.
- D. Gibicar, M. Logar, N. Horvat, A. Marn-Pernat, R. Ponikvar and M. Horvat, Anal. Bioanal. Chem., 2007, 388, 329–340 CrossRef CAS.
- T. Adachi and T. Kuwana, J. Health Sci., 2006, 52(4), 450–454 CrossRef CAS.
- W. Y. Chen, Y. C. Wang and M. S. Kuo, Anal. Sci., 2002, 18(3), 255–260 CAS.
- WHO. International Program on Chemical Safety. Environmental Health Criteria 101: Methylmercury, World Health Organization, Geneva, 1990 Search PubMed.
- U.S. EPA. Mercury Study Report to Congress, An Assessment of Exposure to Mercury in the United States, Vol. IV, EPA, Office of Air Quality Planning and Standards and Office of Research and Development, EPA/452/R-97–006, 1997 Search PubMed.
- M. C. DeSoto and R. T. Hitlan, J. Child Neurology, 2007, 22(11), 1308–1311 CrossRef.
- J. Morton, V. A. Carolan and P. H. E. Gardiner, Anal. Chim. Acta, 2002, 455, 23–34 CrossRef CAS.
- P. Montuori, E. Jover, R. Alzaga, S. Diez and J. M. Bayona, J. Chromatogr. A, 2004, 1025(1), 71–75 CrossRef CAS.
- J. Morton, V. A. Carolan and P. H. E. Gardiner, J. Anal. Atom. Spectrom.2002, 2002, 17(4), 377–381 Search PubMed.
- S. Diez and J. M. Bayona, J Chromatogr. A, 2002, 963(1–2), 345–351 CrossRef CAS.
- P. Bermejo-Barrera, E. M. Verdura-Constenla, A. Moreda-Pineiro and A. Bermejo-Barrera, Anal. Chim. Acta, 1999, 398(2–3), 263–272 CrossRef CAS.
- H. A. Kehrig, O. Malm and H. Akagi, Water, Air, Soil, Pollut., 1997, 97(1–2), 17–29 CAS.
- J. Yoshinaga, M. Morita and K. Okamoto, Fresenius J. Anal. Chem., 1997, 357(3), 279–283 CrossRef CAS.
- H. Akagi, O. Malm, Y. Finjo, M. Harada, F. J. P. Branches, W. C. Pfeiffer and H. Kato, Sci. Total Environ., 1995, 175(2), 85–95 CrossRef CAS.
- H. Akagi, O. Malm, F. J. P. Branches, Y. Kinjo, Y. Kashima, J. R. D. Guimaraes, R. B. Oliveira, K. Haraguchi, W. C. Pfeiffer, Y. Takizawa and H. Kato, Water, Air, Soil, Pollut., 1995, 80(1–4), 85–94 CAS.
- W. Y. Feng, C. F. Chai and Q. F. Qian, J. Radioanal. Nucl. Chem., 1996, 212(1), 61–68 CAS.
- C. Chai, W. Feng, Q. Qian, M. Guan, X. Li, Y. Lu and X. Zhang, Nucl. Sci. Tech., 1994, 5(2), 65–70 Search PubMed.
- S. B. Sarmani and I. Alakili, J. Radioanal. Nucl. Chem., 2004, 259(2), 261–264 CrossRef CAS.
- S. B. Sarmani and I. Alakili, J. Radioanal. Nucl. Chem., 2004, 262(1), 43–48 CrossRef CAS.
- S. B. Sarmani, R. B. Hassan, M. P. Abdullah and A. Hamzah, J. Radioanal. Nucl. Chem., 1997, 216(1), 25–27 CAS.
- N. Vural and H. Unlu, Bull. Environ. Contam. Toxicol., 1996, 57(2), 315–320 CrossRef CAS.
- L. Liang, N. S. Bloom and M. Horvat, Clin. Chem., 1994, 40(4), 602–607 CAS.
- T. Giovanoli-Jakubczak, M. R. Greenwood, J. C. Smith and T. W. Clarkson, Clin. Chem., 1974, 20(2), 222–229.
- S. Chiavarini, C. Cremisini, G. Ingrao and R. Morabito, Appl. Organomet. Chem., 1994, 8(7–8), 563–570 CrossRef CAS.
- M. Dermelj, M. Horvat, A. R. Byrne and P. Stegnar, Chemosphere, 1987, 16(4), 877–886 CrossRef CAS.
- D. S. Vidler, R. O. Jenkins, J. F. Hall and C. F. Harrington, Appl. Organomet. Chem., 2007, 21, 303–310 CrossRef CAS.
- G. M. M. Rahman and H. M. S. Kingston, J. Anal. At. Spectrom., 2005, 20, 183–191 RSC.
- Y. Han, H. M. Kingston, H. M. Boylan, G. M. M. Rahman, S. Shah, R. C. Richter, D. D. Link and S. Bhandari, Anal. Bioanal. Chem., 2003, 375, 428–436 CAS.
- G. M. M. Rahman and H. M. S. Kingston, Anal. Chem., 2004, 76, 3548–3555 CrossRef CAS.
- U.S. EPA Method 6800 in Test Methods for Evaluating Solid Waste, Physical/Chemical Methods SW 846, Update IVA, US Government Printing Office, Washington, DC, 2008 Search PubMed.
- P. Quevauviller and R. Morabito, Trends Anal. Chem., 2000, 19(2–3), 86–96 CrossRef.
- H. M. Kingston, U.S. Patent No. 5414259, 1995.
- D. Huo and H. M. Kingston, Anal. Chem., 2000, 72(20), 5047–5054 CrossRef CAS.
- D. Huo, H. M. S. Kingston and B. Larget, in Comprehensive Analytical Chemistry, Elemental Speciation: New Approaches for Trace Element Analysis, eds. J. A. Caruso, K. L. Sutton and K. L. Ackley, Elsevier, New York, vol. 33, 2000, p. 277 Search PubMed.
- H. M. Kingston, D. Huo, Y. Lu and S. Chalk, Spectrochim. Acta, Part B, 1998, 53(2), 299–309 CrossRef.
- D. Huo, Y. Lu and H. M. Kingston, Environ. Sci. Tech., 1998, 32(21), 3418–3423 CrossRef CAS.
- G. M. M. Rahman, H. M. S. Kingston, T. G. Towns, R. J. Vitale and K. R. Clay, Anal. Bioanal. Chem., 2005, 382(4), 1111–1120 CrossRef CAS.
- H. M. S. Kingston, R. Cain, D. Huo and G. M. M. Rahman, J. Environ. Monitor., 2005, 7, 899–905 RSC.
- H. M. Kingston, U.S. Patent No. 6790673 B1, 2004.
- G. M. M. Rahman, Ph.D. Dissertation, Duquesne University, 2004.
- L. Yang, E. Ciceri, Z. Mester and R. E. Sturgeon, Anal. Bioanal. Chem., 2006, 386, 1673–1680 CrossRef CAS.
- J. Meija, L. Yang, J. A. Caruso and Z. Mester, J. Anal. At. Spectrom., 2006, 21, 1294–1297 RSC.
- D. C. Baxter, I. Rodushkin, E. Engstrom, D. Klockare and H. Waara, Clin. Chem., 2007, 53(1), 111–116 CAS.
- G. Centineo, E. B. Gonzalez, J. I. G. Alonso and A. Snaz-Medel, J. Mass Spectrom., 2006, 41(1), 77–83 CrossRef CAS.
- P. Rodriguez-Gonzalez, J. M. Marchante-Gayon, J. I. G. Alonso and A. Sanz-Medel, Spectrochim. Acta, Part B, 2005, 60(2), 151–207 CrossRef.
- J. Meija and Z. Mester, Anal. Chim. Acta, 2008, 607(2), 115–125 CAS.
- E. Ciceri, S. Recchia, C. Dossi, L. Yang and R. E. Sturgeon, Talanta, 2008, 74(4), 642–647 CrossRef CAS.
- M. Monperrus, P. Rodriguez Gonzalez, D. Amouroux, J. I. Garcia Alonso and O. F. X. Donard, Anal. Bioanal. Chem., 2008, 390(2), 655–666 CrossRef CAS.
- P. Rodriguez-Gonzalez, M. Monperrus, J. I. Garcia Alonso, D. Amouroux and O. F. X. Donard, J. Anal. At. Spectrom., 2007, 22(11), 1373–1382 RSC.
- C. C. Wan, C. S. Chen and S. J. Jiang, J. Anal. At. Spectrom., 1997, 12(7), 683–687 RSC.
- H. M. S. Kingston, P. J. Walter, W. G. Engelhart and P. J. Parsons, in Microwave Enhanced Chemistry: Fundamentals, Sample Preparation, and Application, eds. H. M. S. Kingston and S. J. Haswell, American Chemical Society, Washington DC, 1997, pp. 697–745 Search PubMed.
- US EPA Method 3052 in Test Methods for Evaluating Solid Waste, Physical/Chemical Methods SW 846, U.S. Government Printing Office, Washington, DC, 1996 Search PubMed.
- J. I. Garcia-Alonso, Anal. Chim. Acta, 1995, 312, 57–78 CrossRef.
| This journal is © The Royal Society of Chemistry 2009 |