Hydrogen production from methane in the presence of red mud –making mud magnetic
M.
Balakrishnan
a,
V. S.
Batra
a,
J. S. J.
Hargreaves
*b,
A.
Monaghan
b,
I. D.
Pulford
b,
J. L.
Rico
c and
S.
Sushil
a
aCentre for Energy and Environment, TERI University, Darbari Seth Block, Habitat Place, Lodhi Road, New Delhi, 110003, India
bWestCHEM, Department of Chemistry, Joseph Black Building, University of Glasgow, Glasgow, G12 8QQ, UK. E-mail: justinh@chem.gla.ac.uk; Fax: +44-141-330-4888
cLaboratorio de Catalisis, Facultad de Ingeniería Química, Universidad Michoacana, Edificio E, CU, Morelia Mich, C.P., 58060, México
First published on 12th November 2008
Abstract
Red mud, a waste product of the aluminium industry, has been shown to possess significant activity for the decomposition of methane, a by-product of oil refining and landfill, generating hydrogen and a carbon containing magnetic material. It is envisaged that the latter material could be of interest in terms of downstream purification processes and that its magnetic properties may facilitate separation/handling. In this way, two valuable end products can be generated from two waste products.
Introduction
Red mud is a waste by-product of bauxite processing using the Bayer process. It is a highly alkaline material of variable composition dependent upon source. However, irrespective of its source, the principal components of red mud are iron oxides/oxyhydroxides/hydroxide, aluminium oxide/oxyhydroxide/hydroxide, silica, titania and a range of alkali and alkaline earth metal compounds such as sodium oxide and calcium oxide. Of these, the iron compounds are generally the major phase constituents. The world-wide production of red mud is currently ca. 70 Mtonnes per annum1 and the exploitation of it, as an alternative to landfill or dumping at sea, is an area of current interest as reviewed recently elsewhere.2,3 Potential applications which have attracted attention are its use in construction materials,4 ceramics,1 as a sorbent and coagulant for gas and water purification3,5–7 and as a catalyst.2,8–15 In the latter respect, investigations of catalytic activity of various red muds, and their pre-treated forms, have been made for hydrogenation,13–15 hydrodechlorination8–11 and hydrocarbon oxidation. In terms of oxidation, interest has centred upon the catalytic combustion of methane.12 This area is topical since methane is known to be about 23 times more potent as a greenhouse gas than CO2,16 and it is often the undesirable by-product of landfill dumping and refinery operations where, in the latter case, it is flared. Anthropogenic sources are estimated to contribute 0.2–0.3 Gt CH4 to the atmosphere every year. There has also been significant interest in the valorisation of methane, the principal component of natural gas, by catalytic conversion routes both in the presence or the absence of gas-phase co-fed oxidants and a number of reviews in these areas are available, e.g.ref. 17–20. One potential route for methane utilisation is catalytic decomposition where interest centres on both the production of carbon and hydrogen.21 Although it does not display the highest efficacy, iron is known to be an active catalyst for this reaction, e.g.ref. 22,23. In addition, some of the other components of the red mud may be anticipated to exhibit methane decomposition activity. Accordingly, we thought it worthwhile to investigate red mud for methane decomposition. In this manuscript, we show that various non-modified red mud samples exhibit significant hydrogen production rates, generating carbon containing materials in which graphite, Fe and Fe3C are the predominant phases identified by powder X-ray diffraction. The presence of metallic iron and iron carbide imparts magnetic behaviour to the material, which may facilitate its separation/handling in various envisaged downstream applications, such as water and gas pre-treatment.Results and discussion
The elemental composition of the three red mud samples, determined by ICP, are presented in Table 1. As has been common in the literature, e.g.ref. 3, the data are reported in terms of the weight percentage of the various elements assuming that they are present as the pure oxides. This is, of course, a simplification, and it is notable that the total weight percentages for each sample fall short of 100% and that there is mass loss upon ignition which is indicative of the presence of components such as oxyhydroxides and/or carbonates. However, the differences in composition are evident from these data. In all cases, iron, aluminium and silicon compounds are major constituents. However, the composition of RM4 and RM7, both obtained from the same site but with a two year gap, can be seen to differ fairly significantly. Pronounced differences, particularly in titanium content, can be seen for RM6, which was obtained from a different site. The variation of composition is likely to be a reflection of that for the bauxite ore used in the Bayer process at each particular time or site. Powder X-ray diffraction has been performed upon the three samples and the results are presented in Fig. 1. As expected, complex multi-component patterns are produced. With such complex patterns, it is possible to fit a number of different combinations of phases. Accordingly, we have indicated the positions of goethite, haematite, silica and gibbsite, which are known to be major components of red mud.3 It can be seen that most of the major reflections can be accounted for by the presence of these phases. In the case of RM6, the significant reflections which cannot be attributed to these phases can be matched to the anatase polymorph of TiO2 (JCPDS 21–1272).| Sample code | Major elements | ||||||||||
|---|---|---|---|---|---|---|---|---|---|---|---|
| SiO2 | Al2O3 | Fe2O3 | TiO2 | CaO | MgO | Na2O | K2O | P2O5 | MnO | LOI | |
| RM4 | 16.40 | 10.44 | 42.70 | 6.44 | 2.85 | 1.56 | 3.72 | 0.05 | 0.02 | — | 15.30 |
| RM6 | 12.40 | 10.12 | 36.40 | 18.70 | 2.65 | 2.52 | 3.85 | 0.09 | 0.02 | — | 12.80 |
| RM7 | 14.60 | 23.51 | 36.79 | 0.74 | 1.18 | 0.07 | 6.08 | 0.02 | 0.15 | 0.12 | 16.47 |
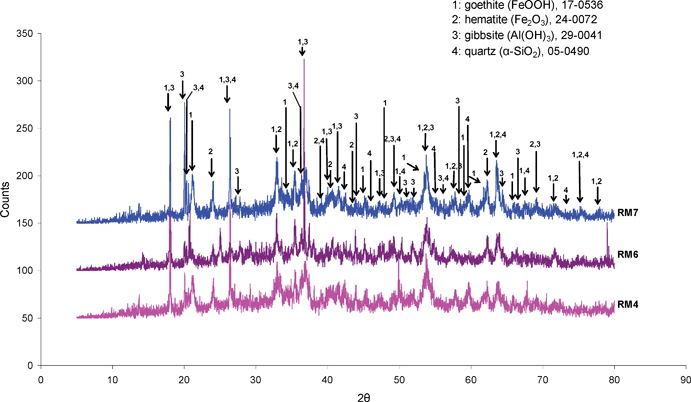 | ||
| Fig. 1 Powder X-ray diffraction patterns of the RM4, RM6 and RM7 red mud samples as received (Cu Kα radiation). | ||
Methane decomposition experiments have been performed on the samples. The samples have been used as obtained, without further modification, and no pre-reduction procedure was performed. It is notable that pre-reduction to generate highly active metallic catalysts is often employed in methane decomposition, although frequently no quantification of the offset of hydrogen employed in this procedure versushydrogen formed in the subsequent catalytic step has been made. Methane itself is a reductant and in view of the aim of our study, which is to valorise two waste resources, we have applied it directly. Therefore, all the hydrogen observed represents net production. It is notable that Otsuka and co-workers23 and Muradov24 have also employed this approach in their investigation of supported Fe2O3 systems. The results of hydrogen production at 800 °C for all three red mud samples are presented in Fig. 2. The data is presented in terms of mass normalised rates, and the activity is generally high. For example, rates of ca. 10 × 10−7 and 50 × 10−7 mol H2 g−1 s−1 have been determined for methane conversion at 700 °C in the presence of 3 wt% MoO3/H-ZSM-5 and 3 wt% Pd/H-ZSM-5 respectively, using the same grade of methane in the same microreactor.25 It is hard to find comparative data for hydrogen formation rates in the presence of methane, but rates of 4.17 × 10⁻⁵, 4.58 × 10⁻⁴ and 2.08 × 10⁻⁴ mol H2 g−1 s−1 at 800 °C have been reported for 14, 38 and 77 wt% Fe2O3/Al2O3 respectively.23 It is notable that there is variation of performance between the three red mud samples, which is not surprising given the differences in their composition. RM4 is by far the most active sample, followed by RM7. The peak CH4 conversion for RM4 is 19.8%. The profiles of RM4 and RM7 are similar in that after an induction period, hydrogen productivity rapidly increases, followed by a deactivation period, although the activation times and peak hydrogen production rates are markedly different. We are currently investigating the reaction pathways associated with these profiles by employing in-situTGA with evolved gas-analysis. Similar profiles have been reported by both Otsuka and co-workers and Muradov in their studies of supported Fe2O3 systems. Indeed in the latter case, four periods of activity were identified. The activation period was stated to correspond to the reduction of iron oxide to iron metal, the peak hydrogen production period to iron catalysed decomposition of methane, the rapid deactivation to depletion of the catalytically active metal and carbide phase which is followed by a steady state methane decomposition period. COx formation was reported to occur during activation. Otsuka and co-workers directly followed COx formation which was observed to die off as activity peaked, resulting in COx-free H2 production beyond this point. In comparing RM4 and RM7, it is notable that there is a higher concentration of iron and a lower concentration of alkali metal in the former sample, which can explain its higher efficacy both in terms of the greater peak production of H2 and the shorter lag period. Elsewhere, alkali metals have been reported to be very effective poisons for the methane decomposition reaction.22 In view of the very high activity of the RM4 sample, it was of interest to see if significant activity could be observed at a lower reaction temperature. A temperature programmed reaction was performed in which the temperature was increased from 600 °C using the regime summarised in Fig. 3. It can be seen that at 600 °C low levels of hydrogen are produced, which increase with temperature increments. At 700 °C, the system slowly activates in a manner similar to that observed for the sample at 800 °C, with comparable rates of hydrogen production. However, beyond 440 minutes on stream, pressure drop effects due to carbon deposition became severe and the experiment was terminated.
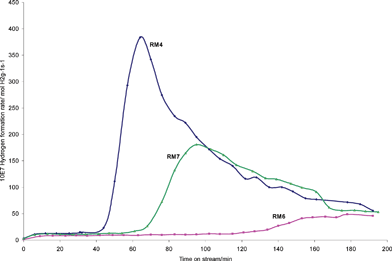 | ||
| Fig. 2 Mass normalised hydrogen formation rates at 800 °C as a function of time on stream for the RM4 (BET surface area 15 m2 g−1), RM6 (BET surface area 8 m2 g−1) and RM7 (BET surface area 14 m2 g−1) red mud samples. Lines joining experimental points are guides for the eye. Peak CH4 conversion rates of 18.0 × 10⁻⁶, 7.7 × 10⁻⁶ and 3.5 × 10⁻⁶ mol CH4 g−1 s−1 were measured for RM4, RM7 and RM6, respectively. | ||
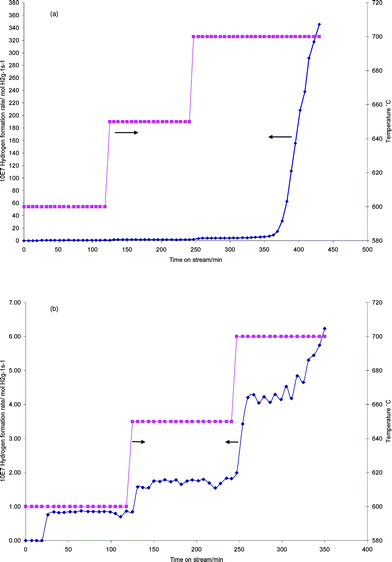 | ||
| Fig. 3 Mass normalised hydrogen formation rates for red mud RM4 during temperature programmed reaction (a) entire profile, (b) profile before “light off” showing the changes occurring. Lines joining experimental points are guides for the eye. | ||
From Fig. 2, it is apparent that despite having a similar iron content to RM7 and alkali metal content to RM4, RM6 is much less active at 800 °C, although its activity is still reasonable. It is also apparent that the activation process is much less marked. In order to assess whether this was simply due to a more delayed activation, the reaction time with this sample was extended to 9 hrs. However, during this period the hydrogen production rate remained relatively steady at a value of ca. 40 × 10−7 mol H2 g−1 s−1 (results not shown). There are two apparent major differences between this sample and the others in Table 1. It possesses both a higher titanium content and a lower loss on ignition. The former is reflected in the additional reflections noticeable in Fig. 1 and the latter may relate to a lower hydroxide, oxyhydroxide and/or carbonate content. At present, the exact origin of the different activity pattern for this sample with respect to the other two is unclear. However, in the context of the present observations, it is interesting to note that TiO2 is reducible and one explanation of the so-called strong metal-support interaction effect (SMSI) is the mobility of its reduced phase decorating active metal particles.26,27
Post-reaction X-ray diffraction patterns are presented in Fig. 4. The positions of reflections corresponding to Fe and Fe3C, in addition to graphite, quartz and alumina have been marked on the patterns, which can be satisfactorily fitted with these phases. The presence of Fe3C, in addition to Fe, has been widely reported in the literature related to hydrocarbon decomposition over iron based systems, e.g.ref. 28. CHN analysis indicated that the RM4, RM6 and RM7 post-reaction samples contained 47.71, 43.49 and 38.06 wt% carbon, respectively. Only traces of hydrogen were determined, and are therefore not reported. It is worth mentioning that the relatively high percentage of carbon present in RM6 resulted as a consequence of exposing this sample to methane for a longer time than the others. TEM analysis of all samples did not show any evidence of tubular forms of carbon as seen in other iron based systems, e.g.ref. 22. Instead, amorphous type structures were apparent and these are the subject of continuing investigation. TGA oxidation studies were performed and these are shown, along with the corresponding first derivative profiles, in Fig. 5. It is interesting to note the general differences between the samples. RM4 and RM7, both of which passed through activity maxima during testing, show an initial mass increase followed by a decrease which extends beyond 800 °C. The temperature at which mass increase occurs is equivalent for both samples and presumably corresponds to oxidation of the Fe3C and/or Fe phases. The mass decrease can be attributed to oxidation of carbon, in agreement with the CHN analysis, and the breadth of this feature indicates a wide distribution in the nature of the species present. This aspect is also under investigation. In the case of RM6, there is no initial mass increase and the sharp mass decrease occurs over a narrower temperature range, at about 450–700 °C. It is suggested that these features are related to the absence of the reduced and re-oxidisable phases present in RM4 and RM7, which is consistent with the absence of a pronounced activity maximum in Fig. 2. The relative sharpness of the loss feature in this sample indicates a narrower distribution of carbon species. In relation to the latter point, it is notable that there are several maxima apparent on the derivative profile for this sample and these appear to be related to carbon species of differing reactivity. On comparing RM4 with RM7 more closely, inspection of Fig. 5 shows that the overall increase in mass is greater for RM4 than that observed for RM7. This is consistent with the different levels of iron phase(s) present in each sample. Differences in the gradient of the mass loss are evident in RM4 and RM7 and this may indicate differing reactivity of the carbon itself, although the difference in phase composition may be significant in this respect.
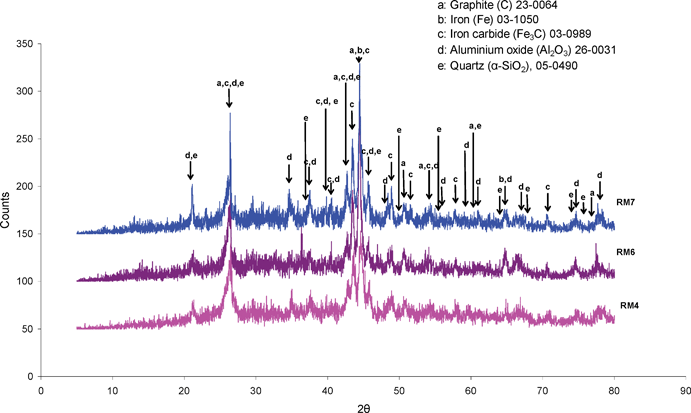 | ||
| Fig. 4 Post-reaction (800 °C) powder X-ray diffraction patterns for red mud samples: RM4, RM6 and RM7. (Cu Kα radiation). RM4 and RM7 were run for ca. 200 min on stream whereas RM6 was run for 540 min on stream. | ||
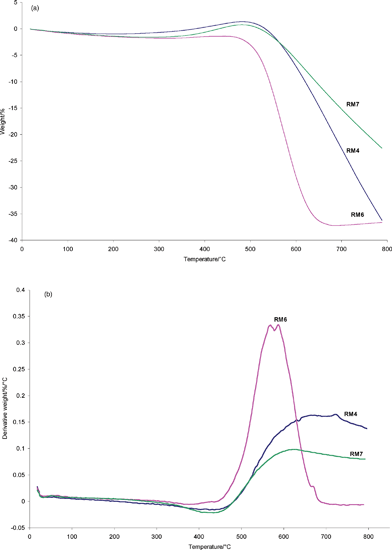 | ||
| Fig. 5 (a) TGA oxidation profiles of RM4, RM6 and RM7 samples following reaction at 800 °C, and (b) corresponding first derivative patterns. | ||
An interesting ramification of the presence of both Fe and Fe3C (which is ferromagnetic)29 in the post-reaction samples is that magnetism is imparted. In a series of experiments we have observed that the post-reaction samples are attracted by magnetic fields. Careful observations have shown that the sample is drawn to the applied magnetic field in its entirety (i.e. there are no portions of the sample which are not attracted.) In fact, it is possible to suspend a sample vial containing the post-reaction samples from the pole of a permanent magnet (a photograph of this effect has been used as the graphical abstract to this paper.) This effect is seen for all three red mud samples. This property has important consequences in terms of potential downstream utilisation, and hence further valorisation, of post-reaction samples. It is our intention to investigate them for their water treatment potential and it is envisaged that magnetic separation will be employed.
Conclusion
The utility of red mud samples for methane decomposition to generate hydrogen has been demonstrated. A magnetic carbon containing material, of possible interest for a variety of potential further applications such as water treatment, is the co-product. The efficacy of the red mud samples is variable, which is related to differences in their composition which in turn reflects the purity of the bauxite ores from which they are produced. Iron, a major component of red mud, is the active phase. On the basis of previous literature, it can be anticipated that the activity is a strong function of alkali metal content, since alkali metals are known to be highly effective poisons of the decomposition reaction. In the present study, a sample which contains a relatively high content of titanium phase(s) seems to have reduced activity compared to a sample containing a comparable proportion of iron phase(s). The maximum hydrogen formation rate we have observed, 3.80 × 10⁻⁵ mol H2 g−1 s−1, is associated with a sample containing the highest proportion of iron. Studies into this system, concentrating upon the transformation pathways, the influence of phase fractions within the red mud samples and their interactions with one another, the form and nature of the deposited carbon, and potential downstream uses of the magnetic carbon containing product are currently in progress.Experimental
Three red mud samples collected in India and designated RM4, RM6 and RM7 were used without modification in the present study. RM4 was collected from a site in Southern India in 2006, RM6 was collected from a site in Eastern India in 2006 and RM7 was collected from the same place as RM4 but after a two year interval.Samples were analysed by inductively coupled plasma analysis (ICP), powder X-ray diffraction (XRD), BET surface area analysis, CHN analysis and thermogravimetric analysis (TGA). ICP was performed using a Varian ICP Vista MPX model ICPAES radial. Samples were investigated as known masses of fine powders dissolved in mixed acids, with any insoluble portions having been given fusion treatment. Simultaneous analysis against known standards was performed. Mass loss on ignition (LOI) studies were also performed to determine the content of decomposable species. Powder X-ray diffraction measurements were performed using a Siemens D5000 diffractometer with Cu Kα radiation. A 2θ range between 5 and 80° was scanned using a counting rate of 1 s per step with a step size of 0.02°. Samples were prepared by compaction into a Si sample holder. BET surface areas were determined where appropriate from N2 physisorption isotherms measured at 77 K following out-gassing, using a Micromeritics Gemini. CHN analysis was performed by combustion using a CE 440 elemental analyzer. TGA was performed on a TA Instruments SDT Q600 instrument. Post-reaction samples were investigated using a 2% O2/Ar mixture (BOC gases), and a temperature ramp rate of 10 °C min−1 from ambient temperature up to 800 °C was applied.
Microreactor testing has been described in detail elsewhere.25 In summary, catalysts were used in the form of powders held centrally within the heated zone of a quartz microreactor between quartz wool plugs. The feed gas composition applied was 80% CH4 (BOC, 99.5%) and 20% N2 (BOC, 99.98%) which were flowed at a total rate of 60 ml min−1 over a ca. 0.4 g catalyst charge, typically resulting in a GHSV of 7200 h−1. Product analysis was performed by on-line GC for H2 quantification, Hewlett Packard 5980A, provided with a TCD and a mol sieve 3X packed column of 12′ long and 1/8″ O.D. GC analyses were performed approximately every six minutes. Background experiments, performed using an empty reactor tube containing quartz wool plugs only, confirmed that at temperatures reported here, H2 production only occurred in the presence of the catalysts studied.
Acknowledgements
We wish to acknowledge the generous support of the British Council, India for a project grant awarded to MB, VSB, JSJH and IDP under the UKIERI scheme (Project SA07-019). SS gratefully acknowledges the financial support in the form of Senior Research Fellowship provided by CSIR, India. Furthermore, JLR would like to acknowledge the generous support of Conacyt and Universidad Michoacana in allowing him to spend a sabbatical period at the University of Glasgow.References
- Y. Pontikes, C. Rathossi, P. Nikolopulos, G. N. Angelopoulos, D. D. Jayaseelan and W. E. Lee, Ceram. Int., 2008 DOI:10.1016/jceramint.2007.11.013.
- S. Sushil and V. S. Batra, Appl. Catal. B: Env., 2008, 81, 64–77 CrossRef CAS.
- S. Wang, H. M. Ang and M. O. Tade, Chemosphere, 2008, 72, 1621–1635 CrossRef CAS.
- A. Pappu, M. Saxena and S. R. Asolekar, Building and Env., 2007, 42, 2311–2320 Search PubMed.
- E. Poulin, J.-F. Blais and G. Mercier, Hydrometallurgy, 2008, 92, 16–25 CrossRef CAS.
- Y. Li, C. Liu, Z. Luan, X. Peng, C. Zhu, Z. Chen, Z. Zhang, J. Fan and Z. Jia, J. Hazard Mater., 2006, 137, 374–383 CrossRef CAS.
- J. Pradhan, S. N. Das and R. S. Thakur, J. Colloids Interf. Sci., 1999, 217, 137–141 Search PubMed.
- S. Ordonez, H. Sastre and F. V. Diez, Stud. Surf. Sci. and Catal., 1999, 126, 443–446 CAS.
- S. Ordonez, H. Sastre and F. V. Diez, J. Hazard. Mater., 2001, 81, 103–114 CrossRef CAS.
- S. Ordonez, H. Sastre and F. V. Diez, Appl. Catal. B: Env., 2001, 29, 263–273 CrossRef CAS.
- S. Ordonez, H. Sastre and F. V. Diez, Appl. Catal. B: Env., 2001, 34, 213–226 CrossRef CAS.
- J. R. Paredes, S. Ordonez, A. Vega and F. V. Diez, Appl. Catal. B: Env., 2004, 47, 37–45 CrossRef CAS.
- J. Alvarez, S. Ordonez, R. Rosal, H. Sastre and F. V. Diez, Appl. Catal. A: Gen., 1999, 180, 399–409 CrossRef CAS.
- J. Alvarez, R. Rosal, H. Sastre and F. V. Diez, Appl. Catal. A: Gen., 1995, 128, 259–273 CrossRef CAS.
- J. Alvarez, R. Rosal, H. Sastre and F. V. Diez, Appl. Catal. A: Gen., 1998, 167, 215–223 CrossRef CAS.
- I. Pulford and H. Flowers, Environmental Chemistry at a Glance, Blackwell Publishing, Oxford, 2006, ISBN 1405135328, 9781405135320 Search PubMed.
- G. J. Hutchings, M. S. Scurrell and J. R. Woodhouse, Chem. Soc. Rev., 1989, 18, 251–283 RSC.
- T. J. Hall, J. S. J. Hargreaves, G. J. Hutchings, R. W. Joyner and S. H. Taylor, Fuel Proc. Technol., 1995, 42, 151–178 Search PubMed.
- T. V. Choudhary, E. Aksoylu and D. W. Goodman, Catal. Rev. Sci. Eng., 2003, 45, 151–203 CrossRef CAS.
- Y. Xu, X. Bao and L. Lin, J. Catal., 2003, 216, 386–395 CrossRef CAS.
- T. V. Choudhary and D. W. Goodman, Catalysis, 2006, 19, 164–183 Search PubMed.
- M. A. Ermakova, D. Y. Ermakov, A. L. Chuvilin and G. G. Kuvshinov, J. Catal., 2001, 201, 183–197 CrossRef CAS.
- S. Takenaka, M. Serizawa and K. Otsuka, J. Catal., 2004, 222, 520–531 CrossRef CAS.
- N. Z. Muradov, Energy Fuels, 1998, 12, 41–48 CrossRef CAS.
- S. Burns, J. G. Gallagher, J. S. J. Hargreaves and P. J. F. Harris, Catal. Lett., 2007, 116, 122–127 CrossRef CAS.
- G. L. Haller and D. E. Resasco, Adv. Catal., 1989, 36, 173 CAS.
- T. Uchijima, Catal. Today, 1996, 28, 105–117 CrossRef CAS.
- B. J. Cooper and D. L. Trimm, J. Catal., 1980, 62, 35–43 CrossRef CAS.
- B. David, O. Schneeweiss, M. Mashlan, E. Santava and I. Morjan, J. Mag. Mag. Mater., 2007, 316, 422–425 CrossRef CAS.
| This journal is © The Royal Society of Chemistry 2009 |
