Characterization of the planktonic shrimp, Acetes intermedius, as a potential biomonitor for butyltin
Chuan-Ho
Tang
a,
Tien-Chi
Hsu
a,
Chung-Wei
Tsai
a and
Wei-Hsien
Wang
*ab
aDepartment of Marine Biotechnology and Resources, National Sun Yat-Sen University, 70 Lien-hai Rd, Kaohsiung, Taiwan 80424, ROC. E-mail: whw@mail.nsysu.edu.tw
bNational Museum of Marine Biology and Aquarium, 2 Hou-wan Rd, Pingtung, Taiwan 80944, ROC
First published on 7th November 2008
Abstract
Acute toxic responses as well as uptake and depuration rates for tributyltin (TBT) and dibutyltin (DBT) were examined in the small planktonic shrimp, Acetes intermedius. The 72-h LC50 values of TBT and DBT for the shrimp were found to be 18.6 and 82.6 µg L−1 as tin. The uptake rate constants of TBT and DBT in the shrimp were 0.0006 and 0.0002 L g−1 h−1, and the corresponding depuration rate constants were 0.0303 and 0.0106 h−1, respectively. It appears that real-time ambient TBT pollution status can be more closely reflected in this species. The shrimp may serve as a biomonitor to indicate short-term fluctuations in ambient TBT pollution. A field survey was also conducted to distinguish contrasts in butyltin accumulation under different ambient conditions. These observations provide valuable information for the evaluation of TBT pollution status in the environment using A. intermedius as a biomonitor.
Introduction
Tri-organotin compounds are extensively used as biocides, including as fungicides, pesticides, and additives in antifouling paints.1 Tri-organotins enter the marine environment directly and continuously due to their use in antifouling paints on ships and channel facilities. The principal active biocide is tributyltin (TBT), which when released from antifouling paints often causes significant pollution in ambient waters.1Tributyltin has been shown to cause deleterious effects in a variety of non-target organisms. These effects include shell thickening and reduced growth in oysters,2 reproductive impairment in dogwhelks and other gastropod species3 and acute mortality of larval fish.4 As a consequence, legislation has been introduced to restrict the use of TBT on ships in most developed countries since the 1980s, and in Taiwan from 2003. Even so, TBT pollution is still a serious problem in many marine environments worldwide, especially in developing Asian nations.5Studies on TBT accumulation in marine invertebrates have often focused on molluscs and crustaceans due to the fact that these species are important seafood resources and are the most abundant species in most marine habitats. In addition, molluscs and crustaceans are used in TBT accumulation experiments because of their high sensitivity to butyltin compounds. Marine bivalves (molluscs such as mussels, clams and oysters) in particular accumulate much higher TBT quantities than crustaceans and fish because their enzymatic systems are less effective at breaking down TBT in the body.6 In addition, because of their wide geographical distribution, easy sampling, sessile lifestyle, and resistance to stress, marine bivalves have often been used as biomonitors to reflect the spatial distribution and temporal variation of TBT pollution in the ambient environment.7 These species may also be suitable for monitoring the long-term integrated pollution status. Since government enforcement of the TBT ban requires more real-time information regarding ambient pollution, it is necessary to find a biomonitor more sensitive to variations in TBT pollution.
The genus Acetes consists of small planktonic shrimps that are extensively distributed in both tropical and temperate estuaries and coastal waters.8 The Taiwanese mauxia shrimp, Acetes intermedius, is one of the most important fishery resources in southwestern Taiwan. This shrimp species is caught in estuaries year round with an annual catch reaching 2000–2500 tons in Tungkang, Taiwan. Moreover, A. intermedius is also an important food source for many aquatic organisms9 and the species plays an important role in the coastal food web of southwestern Taiwan. The biological effects of TBT on A. intermedius should be studied to understand the possible impacts of TBT on other aquatic organisms and ecosystems.
In order to estimate the extinction risk to A. intermedius populations posed by butyltin pollution (resistance to butyltin), acute toxicity experiments were conducted on A. intermedius with TBT and its metabolite, dibutyltin (DBT). We also conducted a field survey and laboratory experiments to investigate the accumulation of butyltin compounds in A. intermedius. We examined the kinetic parameters of uptake and elimination as well as accumulation characteristics to assess the suitability of using A. intermedius as a biomonitor for butyltin pollution.
Materials and methods
Reagents and chemicals
We used analytic grade acetic acid (99.7%) and nitric acid (69.0–70.0%) from J. T. Baker (Phillipsburg, NJ, USA), ethylmagnesium bromide (39% w/v solution in ethyl ether) from T.C.I. (Tokyo, Japan), sodium tetraethylborate (NaBEt4, > 98%) from Strem Chemical (Bischheim, France), dibutyltin dichloride (97%) and monobutyltin trichloride (95%) from Aldrich (Milwaukee, WI, USA), and tripropyltin chloride (98%), tributyltin chloride (98%), sodium acetate (> 99.5%), hexane and methanol (analytical reagent grade) from Merck (Darmstadt, Germany). Ethylated organotin standards were prepared in hexane by direct Grignard ethylation of the corresponding organotin chlorides, according to the method described earlier.10 Reagent water of Milli-Q quality was obtained from Millipore (Bedford, MA, USA).Field survey
Planktonic shrimps (A. intermedius) and surface seawater samples (1 m beneath the surface) were collected from Kaohsiung Port, Taiwan (Xinbin Wharf (Station A) and the second port entrance (Station B)) during 2004 and 2005. In addition, planktonic shrimps were also collected from a deeper sea area (90–100 m) offshore of Tungkang (Station C), Taiwan during August and October of 2004. The shrimp and seawater samples were all collected at flood tide. Sampling locations are shown in Fig. 1.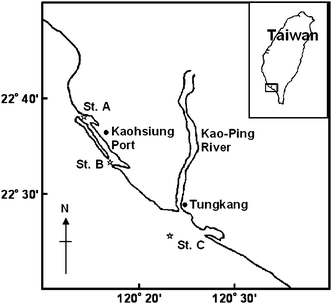 | ||
| Fig. 1 Map of the field survey locations with the sampling stations marked. | ||
Residual salinity in the shrimps was first rinsed away using reagent water, and then the shrimps were weighed after the remaining water had been wiped from the body surface. After oven drying at 103 °C for 2 h, the dry weight of the shrimps was also measured and the shrimps were stored in the dark at −20 °C prior to butyltin analysis. Sample details for the shrimps are listed in Table 1. The water samples were acidified with 1.5 mL concentrated nitric acid per litre of sample and stored in dark glass bottles at 4 °C prior to butyltin analysis for no more than 3 d to prevent alteration of butyltin composition in seawater.11
| Sampling month | Water depth (m) | Sample number | Body weight (mg)a | |
|---|---|---|---|---|
| Wet | Dry | |||
| a Values are mean ± standard deviation. | ||||
| Station A | ||||
| Aug. 2004 | 9.0 | 29 | 72.5 ± 23.3 | 16.8 ± 5.6 |
| Sep. 2004 | 9.0 | 28 | 60.4 ± 18.5 | 13.9 ± 4.4 |
| Oct. 2004 | 9.0 | 26 | 66.9 ± 19.7 | 15.5 ± 4.7 |
| Nov. 2004 | 9.0 | 26 | 75.8 ± 25.9 | 17.6 ± 6.2 |
| Dec. 2004 | 9.0 | 29 | 66.6 ± 20.7 | 15.4 ± 4.9 |
| Feb. 2005 | 9.0 | 29 | 77.0 ± 20.4 | 17.9 ± 4.9 |
| Mar. 2005 | 9.0 | 31 | 85.8 ± 25.3 | 20.0 ± 6.0 |
| Apr. 2005 | 9.0 | 31 | 88.0 ± 29.7 | 20.5 ± 7.1 |
| May 2005 | 9.0 | 32 | 78.9 ± 23.1 | 18.3 ± 5.5 |
| Station B | ||||
| Sep. 2004 | 14.0 | 32 | 58.0 ± 12.4 | 13.4 ± 3.0 |
| Dec. 2004 | 14.0 | 25 | 69.4 ± 16.6 | 16.1 ± 4.0 |
| Mar. 2005 | 14.0 | 34 | 85.4 ± 23.6 | 19.9 ± 5.6 |
| May 2005 | 14.0 | 29 | 78.1 ± 30.2 | 18.2 ± 7.2 |
| Station C | ||||
| Aug. 2004 | 90.0 | 29 | 82.3 ± 22.9 | 19.2 ± 5.5 |
| Oct. 2004 | 90.0 | 27 | 90.1 ± 23.5 | 21.0 ± 5.6 |
Acute toxicity experiments
Shrimps were collected from Xinbin Wharf and transported to the laboratory for the acute toxicity experiments within 12 h of collection. Glass beakers containing 5 L of each test solution were prepared 8 h prior to the acute toxicity experiments. Thirty individual shrimps were randomly exposed to each test solution (2 replicates) at the same salinity (32.5 ± 0.5), temperature (22.5 ± 1.0 °C) and pH value (8.15 ± 0.05) with gentle aeration using a glass tip (dissolved oxygen > 90% of the saturation), and without feeding during the experimental period. The subsequent number of deaths was recorded over a 72-h period. With TBT and DBT concentrations and mortality data, the median lethal concentration (LC50) for 72 h was calculated from the dose-response curve using a probit analysis.12 The body weight of each shrimp for the TBT (73.5 ± 22.3 mg wet wt.) and DBT (74.8 ± 24.9 mg wet wt.) acute toxicity experiments was measured during the experimental period. In addition, the butyltin concentration in the surviving shrimps (replicated five times) was also analyzed after the 72-h test period.The seawater for preparation of the test solution was collected from Kenting National Park, at the southern tip of Taiwan where anthropogenic pollution was expected to be low (organotins were not detectable). The seawater was filtered through a 0.45 µm Millipore filter prior to preparation of the test solution. The six test concentrations (1.8, 3.6, 7.3, 18.2, 36.4 and 72.8 µg L−1 as tin for TBT, and 23.3, 38.8, 77.5, 194, 388 and 775 µg L−1 as tin for DBT) were made by adding different amounts of tributyltin chloride or dibutyltin dichloride to 5 L of seawater, respectively. Due to the high hydrophobicity of butyltins, methanol was used to dissolve the butyltin compounds in seawater, and the methanol concentration in each test solution (including the control) was set at 0.05 mL L−1. Each test solution was analyzed daily before and during the experiments to confirm the accuracy of the butyltin concentrations. The acute toxicity experiments were based on the ecological effect testing method from the risk assessment program of the Organization for Economic Cooperation and Development.13 Some modifications were made, such as using methanol as the carrier to make butyltins dissolve in the test solution and collecting the test organisms directly from the field for testing within a short duration.
Uptake and depuration experiments
Shrimps were also collected from Xinbin Wharf for uptake and depuration experiments within 12 h of collection. In the uptake experiments, fifty individual shrimps were exposed to 10 L of TBT (10.9 µg L−1 as tin) and DBT (38.8 µg L−1 as tin) solutions in a glass beaker. At 0, 24, and 48 h of exposure, five shrimps were sampled from the beaker for butyltin analysis. Feeding was not performed during the uptake experimental period. After the uptake experiments, the remaining shrimps were immediately transferred to another glass beaker containing 10 L of clean seawater to perform the depuration experiments. During the depuration experiment, the shrimps were fed live nauplii of small crustacea (Artemia sp.), and five shrimps were also sampled from the beaker for butyltin analysis after 6, 24, and 48 h for the TBT test and 24, 48, and 72 h for the DBT test. The body weight of each shrimp for the TBT (67.9 ± 18.7 mg wet wt.) and DBT (67.6 ± 19.7 mg wet wt.) uptake and depuration experiments were also measured during the experiment. The uptake and depuration experiments were conducted at the same salinity (33.0 ± 0.5), temperature (25.0 ± 1.0 °C) and pH value (8.20 ± 0.05) with gentle aeration by a glass tip (dissolved oxygen > 90% of the saturation). At the conclusion of the experiments, the total fraction of dead shrimps was less than 10%.The seawater for the preparation of the exposure solution was also collected from Kenting National Park and the same pre-treatment process was conducted as for the acute toxicity experiments. In the uptake experiments, the solutions were analyzed daily before and during the experiments to confirm the accuracy of the butyltin concentrations. The selected exposure butyltin concentrations were based on experiments with planktonic crustacea (Daphnia magna) where the exposure concentration was approximately half that of the LC50 used in this study.14 This provides more stable butyltin concentration in the exposure solution during the experiment, and clearly elevate butyltin content in the organisms during the short exposure period.
Butyltin analysis
Analysis of butyltin compounds in individual shrimps (not pooled) was based on the method described in a previous study.15 The dried shrimp sample was homogenized into a powder in a glass centrifuge tube by using a stirring rod. The shrimp powder sample was leached with 3 mL solution of 0.1 M sodium acetate and 0.1 M acetic acid in methanol. The mixture was sealed, placed in a platform shaker and shaken for 4 h at 200 rpm. Ten millilitres of reagent water were added and the mixture was adjusted to pH 5.0. After the addition of 1 mL of hexane and 1 mL of 0.5% (w/v) NaBEt4 solution, the glass centrifuge tube was shaken using a platform shaker for 4 h at 200 rpm (simultaneous ethylation and extraction). Once the hexane phase was collected, this solution was injected into a gas chromatograph (Model G-14A of Shimadzu (Kyoto, Japan)) equipped with a flame photometric detector (GC-FPD) for the butyltin analysis.The GC-FPD was operated in the tin mode (with a 610 nm optical filter) and the extract was injected at 250 °C using the split/splitless mode. A DB-5 capillary column (inside diameter 0.530 mm, length 25 m, film 1.5 µm from J & W Scientific, Folsom, CA, USA) was used for alkyltin separation. The gas chromatograph oven temperature was programmed for 100 °C to 180 °C at 8 °C min−1 and then heated to 280 °C (5 min hold) at 25 °C min−1. Helium was used as the carrier gas (12 mL min−1). The detector was operated at 250 °C with an air/hydrogen flame with the air/hydrogen gas pressures at 0.9 and 1.3 kg cm−2, respectively.
Analysis of butyltin compounds in water was based on a previous study16 with some modifications. The water sample (400 mL) was adjusted to pH 5.0 using an acetic buffer solution, and the water sample was then placed in a reaction vessel (500 mL volumetric flasks) and 1 mL of hexane and 1 mL of 0.5% NaBEt4 solution were added. The reaction vessel was shaken using a platform shaker for 4 h at 200 rpm (simultaneous ethylation and extraction). The hexane phase was collected and injected into the GC-FPD for the butyltin analysis. The test solutions for the acute toxicity and uptake experiments were diluted with reagent water prior to butyltin analysis.
Butyltin concentrations of shrimp and water samples were quantified by calibration graphs with GC-FPD peak height. Butyltin recovery tests were performed using spiked samples during each experiment. The recovery of butyltins ranged from 92–111% and 72–119% for shrimps and water, respectively. Butyltin concentrations were corrected for the recovery. The ethylated tripropyltin internal standard (50 ng mL−1 in hexane) was used in the simultaneous ethylation and extraction step to detect possible errors of hexane volatilization and GC-FPD measurement. The relative standard deviations of the ethylated tripropyltin internal standard signal intensity were less than 10% in each experiment. The relative standard deviations for three replicate shrimp samples using the complete analytical procedure were less than 10% for butyltins in each experiment. The results of the blanks test were below the detection limit during each experiment. The detection limit of butyltins for shrimps ranged from 3.8–10.7 ng g−1 as tin (wet wt.); and for water, they ranged from 2.6–6.2 ng L−1 as tin.
Results
Field survey
Concentrations of TBT and DBT were detected in seawater at Stations A and B during the survey (Table 2). The ranges of concentration were 16.0–61.6 and 79.4–171 ng L−1 as tin for TBT and DBT at Station A, which appeared significantly higher (t-test, p < 0.05; except for an insignificant difference in TBT content during March 2005) than those at Station B (6.3–24.7 and 49.8–76.4 ng L−1 as tin for TBT and DBT). Surprisingly, DBT was the predominant compound in the seawater at both stations during the survey (the DBT/TBT ratio ranged 2.3–7.9). Furthermore, the concentrations of TBT and DBT in the seawater presented a significant temporal difference at Station A (Duncan's test, p < 0.05); that is, levels were lower during November 2004-April 2005 (cooler period) than during August 2004-October 2004 and in May 2005 (warmer period).| Sampling month | Water b | Shrimps | ||||
|---|---|---|---|---|---|---|
| Tributyltin | Dibutyltin | Tributyltin | Dibutyltin | ne | BAFsf of tributyltin | |
| a Values are mean ± standard deviation. b Three times replicate measured (n = 3). c n = 1. d Not measured. e Analytical number of independent replicate individual samples (not pooled). f BAFs = bioaccumulation factors. | ||||||
| Station A | ||||||
| Aug. 2004 | 61.6 ± 15.4 | 170 ± 23.0 | 126 ± 63.2 | 77.2 ± 34.7 | 29 | 2049 |
| Sep. 2004 | 50.7 ± 7.7 | 162 ± 31.1 | 133 ± 72.5 | 100 ± 43.6 | 28 | 2615 |
| Oct. 2004 | 42.0c | 127 | 125 ± 59.7 | 76.3 ± 33.3 | 26 | 2975 |
| Nov. 2004 | 33.4 ± 3.0 | 104 ± 7.2 | 171 ± 80.9 | 66.3 ± 25.5 | 26 | 5119 |
| Dec. 2004 | 39.8 ± 0.9 | 91.3 ± 2.7 | 146 ± 105 | 105 ± 55.3 | 29 | 3675 |
| Feb. 2005 | 21.0 ± 6.7 | 107 ± 19.6 | 139 ± 101 | 77.4 ± 22.7 | 29 | 6619 |
| Mar. 2005 | 19.2 ± 8.4 | 79.4 ± 7.0 | 118 ± 86.0 | 70.7 ± 21.1 | 31 | 6173 |
| Apr. 2005 | 16.0 ± 0.8 | 101 ± 15.3 | 111 ± 76.3 | 50.6 ± 32.0 | 31 | 6946 |
| May 2005 | 55.0 ± 0.9 | 171 ± 8.6 | 125 ± 91.6 | 49.0 ± 32.6 | 32 | 2281 |
| Station B | ||||||
| Sep. 2004 | 24.7 ± 1.0 | 76.4 ± 13.7 | 185 ± 49.7 | 128 ± 31.8 | 32 | 7482 |
| Dec. 2004 | 23.9 ± 3.0 | 59.3 ± 10.4 | 182 ± 107 | 169 ± 56.5 | 25 | 7624 |
| Mar. 2005 | 21.2 ± 1.8 | 57.0 ± 1.0 | 173 ± 102 | 123 ± 39.4 | 34 | 8161 |
| May 2005 | 6.3 ± 1.1 | 49.8 ± 4.3 | 119 ± 66.5 | 72.9 ± 27.1 | 29 | 18939 |
| Station C | ||||||
| Aug. 2004 | -d | — | 29.8 ± 5.0 | < 10.7 | 29 | — |
| Oct. 2004 | — | — | 24.4 ± 5.9 | < 10.7 | 27 | — |
Tributyltin and DBT concentrations in the shrimps are also shown in Table 2. Concentrations ranged from 111–171 and 49.0–105 ng g−1 as tin (wet wt.) for TBT and DBT in the shrimps at Station A; at Station B they were 119–185 and 72.9–169 ng g−1 as tin (wet wt.), respectively. The contents of TBT and DBT in the shrimps showed insignificant differences (Duncan's test, p > 0.05) between each month at Stations A and B (except for May 2005 at Station B). The butyltin content in the shrimps at Station A appeared significantly lower (t-test, p < 0.05) than at Station B (except for an insignificant difference in TBT content during December 2004 and May 2005), which was contrary to the butyltin pollution status in the water. In addition, the content of TBT in the shrimps collected from Station C were 24.4 and 29.8 ng g−1 as tin (wet wt.) during August and October 2004 (the contents of DBT were below the detection level), respectively, and appeared significantly lower (t-test, p < 0.05) than in those collected from Kaohsiung Port (Station A).
The bioaccumulation factors (BAFs) of TBT for the shrimps are shown in Table 2. All BAF values were described as follows:
| BAF = 1000 Cb/Cw | (1) |
Acute toxicity in shrimps
The values of mortality and butyltin content in surviving shrimps for each test concentration are given in Figs. 2 and 3 for TBT and DBT, respectively. The respective 72-h LC50 values of TBT and DBT determined for the shrimps were 18.6 and 82.6 µg L−1 as tin, and the 95% confidence intervals were 11.7–29.6 and 66.1–103 µg L−1 as tin. In the control test, survival rates were 97–100% during the TBT and DBT acute toxicity experiments.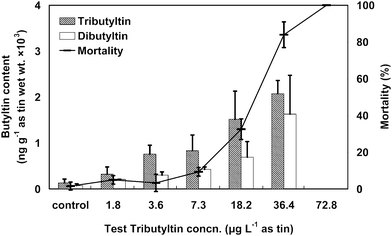 | ||
| Fig. 2 Shrimp mortality (line) corresponding with tributyltin (slashed column) and dibutyltin (white column) contents in the surviving shrimps for each tributyltin concentration after a 72 h test period. The error bars indicate standard deviations. | ||
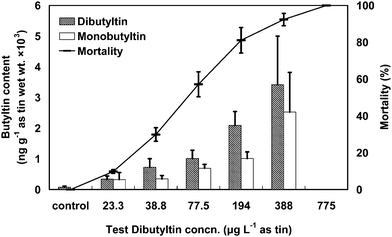 | ||
| Fig. 3 Shrimp mortality (line) corresponding with dibutyltin (slashed column) and monobutyltin (white column) contents in the surviving shrimps for each dibutyltin concentration after a 72 h test period. The error bars indicate standard deviations. | ||
Butyltin contents in the surviving shrimps at each test concentration were analyzed after the exposure tests. The respective contents of TBT and DBT in the shrimps ranged from 322–2072 and 210–1630 ng g−1 as tin (wet wt.) in the TBT exposure test. In the DBT exposure test, the contents of DBT and monobutyltin in the shrimps were in the ranges of 339–3416 and 328–2525 ng g−1 as tin (wet wt.), respectively. The contents of butyltin and its metabolite in the shrimps were significantly correlated with the test concentration (r = 0.968–0.993, p < 0.01). The bioconcentration factors (BCFs) of butyltin for the shrimps at the end of the 72-h test periods were also described by the formula (1) (with test concentrations, Cw). The BCF values of TBT for the shrimps were 179, 211, 114, 83.5 and 56.9 with test concentrations of 1.8, 3.6, 7.3, 18.2 and 36.4 µg L−1 as tin, respectively. The BCF values of DBT for the shrimps were 14.5, 18.8, 13.1, 10.8 and 8.8 with test concentrations of 23.3, 38.8, 77.5, 194 and 388 µg L−1 as tin, respectively.
Uptake and depuration of butyltin in shrimps
The data for butyltin accumulation and depuration in the shrimps were analyzed using the following kinetics model:17| dCb/dt = KuCw − KdCb | (2) |
| Cb = KuCwt + Cb0 | (3) |
For the depuration phase, where Cw = 0, integration of
| dCb/dt = −KdCb | (4) |
yields
| lnCb = −Kdt + lnCb0 | (5) |
As shown in Fig. 4, the butyltin content in the shrimps showed clear changes during the TBT uptake experiment and depuration periods. An increase in the TBT content of the shrimps with exposure time was noted, and TBT uptake was linear up to 48 h with an exposure concentration of 10.9 µg L−1 as tin, but it never reached a steady state. The TBT content of the shrimps increased from 48.4 to 386 ng g−1 as tin (wet wt.), and the BCF value at the end of the uptake period was 35.4 for the shrimps. The uptake rate constant was 0.0006 L g−1 h−1 (wet wt.) during the exposure period. During the depuration period, a clear decrease in the TBT content of the shrimps was observed with the TBT content dropping from 386 to 211 ng g−1 as tin (wet wt.) within 48 h. However, the initial linear decrease in the TBT content with depuration was followed by a steady state in which the TBT content showed small variations. The final TBT content at the end of the experiment was approximately 200 ng g−1 as tin (wet wt.). There was no return to the background TBT level: the shrimps still contained approximately five times as much TBT as the reference content. Hence, the depuration rate constant of TBT in the shrimps was 0.0303 h−1 within a linear range during the initial 24 h of depuration.
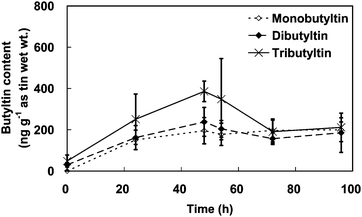 | ||
| Fig. 4 The change of butyltin content in the shrimps over the course of the tributyltin accumulation and depuration experiments. The error bars indicate standard deviations. | ||
The DBT content of the shrimps also clearly changed during the DBT uptake experiment and depuration periods. As shown in Fig. 5, DBT uptake was linear with an exposure concentration of 38.8 µg L−1 as tin within a 48-h period, while the DBT content in the shrimps increased from 30.1 to 331 ng g−1 as tin (wet wt.). The BCF value at the end of the uptake period was 8.5 for the shrimps. The uptake rate constant of DBT in the shrimps was 0.0002 L g−1 h−1 (wet wt.). A clear linear decrease in the DBT content with DBT depuration was also observed for up to 96 h, during which time the DBT content dropped from 331 to 124 ng g−1 as tin (wet wt.). The depuration rate constant of DBT in the shrimps was 0.0106 h−1.
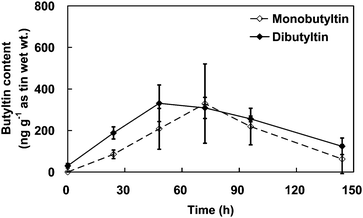 | ||
| Fig. 5 The change of butyltin content in the shrimps over the course of the dibutyltin accumulation and depuration experiments. The error bars indicate standard deviations. | ||
Butyltin concentration in the test seawater solution
The test TBT concentrations for the acute toxicity experiment (1.8, 3.6, 7.3, 18.2, 36.4 and 72.8 µg L−1 as tin) and the uptake experiment (10.9 µg L−1 as tin) were analyzed daily during the experiments and the average concentrations were 2.0 ± 0.7, 4.0 ± 0.7, 7.9 ± 1.5, 19.6 ± 1.1, 40.0 ± 3.5, 78.3 ± 2.9 and 11.1 ± 1.2 µg L−1 as tin, respectively. The DBT concentration of test solutions for the acute toxicity experiment (23.3, 194 and 775 µg L−1 as tin) and the uptake experiment (38.8 µg L−1 as tin) were also analyzed and the average concentrations were 24.9 ± 1.3, 204 ± 4.5, 846 ± 7.2 and 39.6 ± 2.2 µg L−1 as tin, respectively. These results confirmed that butyltin concentrations remained the same during the experimental period. Hence, the accuracy of the butyltin concentration of test solutions was assured.Discussion
Chemical substances can accumulate in aquatic organisms when water flows through exposed tissues like gills in gill-breathing organisms and by food ingestion via the mouth. The results of TBT exposure experiments in crabs (Callinectes sapidus) indicate that the route of TBT accumulation depends on the organs.18 In the present study, feeding was not performed during the uptake and acute toxicity experiments; butyltin uptake in the shrimps occurred mainly through the gills and the toxic effects of butyltin were reflected on the shrimps.Comparison of the accumulation factors of TBT from the uptake and acute toxicity experiments (35.4–211) with those from the field survey (2049–18,939) shows that accumulation was clearly greater under field conditions than under experimental conditions by one to two orders of magnitude. This is similar to the reported TBT accumulation status of marine bivalves, where the accumulation factors of TBT are reduced in an ambient environment with high TBT pollution levels.19 The difference may be attributed to the alteration of physicochemical characteristics in the shrimps at higher TBT concentration levels. For instance, the respiration rate of the crab Callinectes sapidus was clearly reduced at a high TBT dosage,20 which may lead to a decrease in the TBT uptake efficiency through the gills. The present laboratory experiments did not include feeding, so TBT mainly accumulated in the shrimps through the gills. In the real environment accumulation is also likely to occur from food, suggesting that the shrimps likely have a lower ability to acquire TBT from the dissolved phase than from food. A similar result was also reported for metal lead exposure in a species of shrimp (Palaemonetes varians) where the shrimps have a lower ability to take up lead from the dissolved phase. Lead in the tissues was determined to have mainly accumulated through food intake.21 Moreover, the lower accumulation factors of TBT found in the uptake and acute toxicity experiments may also have been due to a failure to reach a steady state.
The BAFs of TBT in the shrimps at Xinbin Wharf (Station A, 2049–6946) appeared to be lower than others such as from the second entrance to Kaohsiung Port (Station B, 7482–18,939). These differences may have been related to the source of TBT uptake in the shrimps. At Station B, the port entrance, frequent dredging led to the sediment being resuspended from the bottom into the water column making abundant particles with high TBT content more readily available for suspension-feeding animals. In this case, the shrimps had likely eaten the butyltin component in resuspended particles at Station B. Thus, the accumulation of TBT was more clearly elevated in the shrimps taking in an abundant food source with high TBT levels. This effect should be taken into account when evaluating or comparing TBT pollution in the environment using shrimps as biomonitor, especially when small differences in TBT pollution are present between the locations. However, the greater difference of TBT pollution status between the harbor (Stations A and B) and the deeper sea (Station C, where TBT pollution was expected to be lower) was still clearly reflected in the shrimps.
The TBT concentration in seawater showed significant temporal variation at Xinbin Wharf (Station A). The concentration of TBT in seawater appeared to be significantly higher during the periods of August-October 2004 and May 2005 (during the warmer season when monthly mean temperatures range from 25.8–29.1 °C) than during the periods of November 2004-April 2005 (during the cooler season when monthly mean temperatures range from 18.6–26.0 °C). The Xinbin Wharf is mainly for warship traffic, increased amounts of TBT content in the water body during the warmer season are ascribed to the more frequent boating activities during that period. However, this influence was not clearly reflected in the TBT content of the shrimps. Bryan et al.22 indicated that the TBT content of organisms may be affected by their sexual condition, because spawning leads to the elimination of organotin from the bodies of organisms. The spawning of the shrimp A. intermedius in the southwestern coastal area off Taiwan is stronger during warmer periods.23 The shrimps may have eliminated butyltin from their bodies during the spawning process, and therefore the higher TBT pollution status in the seawater was not completely reflected in the TBT burden of the shrimps during these warmer spawning periods. This observation should also be considered when evaluating or comparing TBT pollution in the environment using the shrimps as a biomonitor. The spawning process may introduce noise when using the shrimps as a biomonitor to reflect the TBT pollution status in the environment. As shown in Fig. 6, while the content of TBT in the shrimps was significantly correlated with the TBT concentration in the seawater at Station A during the cooler period (r = 0.780, p < 0.05) and Station B (r = 0.999, p < 0.01). These strong correlations might offer information about what the given TBT content in the shrimps implies about TBT levels in the environment, and whether it should be restricted to specific water conditions.
![The correlations of tributyltin content in the seawater with tributyltin content in the shrimps at Station A during the cooler period (filled triangle; Y = 1.8 X + 89.9 [r = 0.780, p < 0.05]) and Station B (open triangle; Y = 3.6 X + 96.6 [r = 0.999, p < 0.01]).](/image/article/2009/EM/b807864e/b807864e-f6.gif) | ||
| Fig. 6 The correlations of tributyltin content in the seawater with tributyltin content in the shrimps at Station A during the cooler period (filled triangle; Y = 1.8 X + 89.9 [r = 0.780, p < 0.05]) and Station B (open triangle; Y = 3.6 X + 96.6 [r = 0.999, p < 0.01]). | ||
It is important to obtain the rates of uptake and depuration of the pollutant for a selected biomonitor. This allows demarcation of the period during which the biomonitor best reflects the ambient pollution status. Bivalves exhibit stronger TBT accumulation abilities compared with other aquatic organisms, and they have been widely utilized as biomonitors of TBT pollution in the marine environment. The high accumulation ability of TBT in bivalves reflects a much higher uptake rate constant than the corresponding depuration rate constant. For instance, the uptake rate constants of bivalves range across 0.0026–0.0125, 0.0310–0.0356, and 0.0225–0.1238 L g−1 h−1 (dry wt.), and the corresponding depuration rate constants range over 0.0008–0.0014, 0.0009–0.0028, and 0.0003–0.0004 h−1 for Mytilus edulis, Venerupis decussata, and Mya arenaria, respectively.24,25 The shrimp A. intermedius presents the opposite response in the current study, in which the depuration rate constant of TBT in the shrimps (0.0303 h−1) is clearly higher than the corresponding uptake rate constant (0.0006 L g−1 h−1 wet wt. (0.0027 L g−1 h−1 dry wt.)). This indicates that the shrimps have a higher rate of TBT elimination than the mentioned bivalves. Thus, real-time ambient TBT pollution status is better reflected by the shrimps than by bivalves. The shrimp should be adopted as a biomonitor to indicate short-term fluctuations in ambient TBT pollution; bivalves, however, are suitable for monitoring long-term ambient TBT pollution status. Nevertheless, butyltin uptake occurred mainly through the gills for the shrimps in these laboratory experiments. Considering the field results, butyltin can accumulate in the shrimps not only through the gills but also by food ingestion via the digestive gland, and this may enhance the butyltin uptake rate. Therefore, further studies are still needed to confirm the circumstances for the butyltin uptake via the digestive gland in the shrimps.
As shown in Table 3, the LC50 values for various crustaceans and bivalves were compared to elucidate the acute toxicity of TBT. The 48-h to 96-h LC50 values in bivalves (15.2–748 µg L−1 as tin) were clearly higher than those in crustaceans (0.1–18.6 µg L−1 as tin). In a comparison of the LC50 values of TBT between the various crustaceans, the decapoda (72-h to 96-h LC50: 12.7–18.6 µg L−1 as tin) exhibited higher tolerance of TBT levels than others organisms such as the mysidacea (96-h LC50: 0.1–0.8 µg L−1 as tin), copepoda (48-h to 96-h LC50: 0.1–0.6 µg L−1 as tin) and amphipoda (48-h LC50: 0.5–8.4 µg L−1 as tin). The shrimp (A. intermedius) is one of the decapoda and exhibited high tolerance of TBT levels (72-h LC50: 18.6 µg L−1 as tin), which may be related to a faster rate of TBT elimination in the shrimp. The ability to tolerate high TBT levels is a basic criterion for an ideal biomonitor. A. intermedius, although not as tolerant as bivalves, is still a resistant species. Moreover, the shrimp A. intermedius is abundantly distributed throughout the estuaries and along the coast of the Taiwan Strait.9 Specimens are easy to obtain, transplant, and handle in laboratory studies because of their small size (1–3 cm, yet they are still large enough to identify and analyze), which provides an advantage for using the shrimp over bivalves for TBT monitoring.
| Species | LC50 | Reference |
|---|---|---|
| Crustacea, Mysidacea | ||
| Neomysis integer | 0.1 (96 h) | 26 |
| Acanthomysis sculpta | 0.2 (96 h) | 27 |
| Mysidopsis bahia | 0.4–0.8 (96 h) | 28 |
| Crustacea, Copepoda | ||
| Tigriopus japonicus | 0.1 (96 h) | 29 |
| Eurytemora affinis | 0.2 (72 h) | 30 |
| 0.6 (48 h) | 30 | |
| Acartia tonsa | 0.4 (96 h) | 31 |
| 0.5 (48 h) | 12 | |
| Crustacea, Amphipoda | ||
| Jassa slatteryi | 6.5 (48 h) | 12 |
| Cerapus erae | 7.7 (48 h) | 12 |
| Eohaustorioides sp. | 8.4 (48 h) | 12 |
| Caprellidea verrucosa | 0.5 (48 h) | 12 |
| Caprellidea subinermis | 1.7 (48 h) | 12 |
| Caprellidea danilevskii | 2.2 (48 h) | 12 |
| Caprellidea equilibra | 2.4 (48 h) | 12 |
| Crustacea, Branchiopoda | ||
| Daphnia magna | 2.2 (96 h) | 32 |
| Crustacea, Decapoda | ||
| Palaemonetes sp. | 12.7 (96 h) | 33 |
| Crangon crangon | 16.4 (96 h) | 34 |
| Acetes intermedius | 18.6 (72 h) | This study |
| Bivalve | ||
| Mytilus edulis | 15.2 (96 h) | 34 |
| 125 (48 h) | 34 | |
| Ostrea edulis | 83.9 (96 h) | 35 |
| >125 (48 h) | 34 | |
| Crassostrea gigas | 116 (96 h) | 35 |
| 748 (48 h) | 34 | |
| C. virginica | 224–399 (96 h) | 35 |
After the 72-h acute toxicity experiments, the good correlation of butyltin concentration was found between the surviving shrimps and the test solutions (r = 0.968–0.993, p < 0.01). The dose resulted in proportionably elevated butyltin concentrations in the shrimps corresponding the test concentrations over the full test range (TBT: 1.8–36.4 µg L−1 as tin; DBT: 23.3–388 µg L−1 as tin). This result indicates that the kinetics of butyltin acute toxicity surely related to butyltin accumulated in the shrimps. According to the LC50 values, TBT (18.6 µg L−1 as tin) is more toxic to the shrimps than DBT (82.6 µg L−1 as tin). This result is consistent with the results of another study concluding that tri-organotin was much more toxic than di-organotin.36 The difference in toxicity is probably due to the greater accumulation factor in the shrimps for TBT (56.9–211) than for DBT (8.8–18.8). Furthermore, it is also because of a difference in toxicity mechanisms between TBT and DBT.36
Conclusion
The shrimp A. intermedius is abundantly distributed along the coast of the Taiwan Strait and possesses a suitable body size for laboratory studies. These shrimps also demonstrate resistance to stress by TBT toxicity and can accurately reflect ambient TBT pollution status in a real-time fashion. These characteristics of A. intermedius show that the species is a potentially useful tool for observing TBT pollution in harbors and supporting the enforcement of the TBT ban in antifouling paints. However, field exposure experiments are still required to confirm the feasibility and validity of A. intermedius as a biomonitor of TBT pollution.Acknowledgements
This research was supported by National Museum of Marine Biology and Aquarium of Taiwan, Republic of China.References
- M. Hoch, Appl. Geochem., 2001, 16, 719–743 CrossRef CAS.
- C. Alzieu, Mar. Environ. Res., 1991, 32, 7–17 CrossRef.
- I. Omae, Appl. Organomet. Chem., 2003, 17, 81–105 CrossRef CAS.
- K. Fent and W. Meier, Arch. Environ. Contam. Toxicol., 1992, 22, 428–438 CrossRef CAS.
- A. Sudaryanto, S. Takahashi, I. Monirith, A. Ismail, M. Muchtar, J. Zheng, B. J. Richardson, A. Subramanian and M. Prudente, Environ. Toxicol. Chem., 2002, 21, 2119–2130 CrossRef CAS.
- R. F. Lee, Mar. Environ. Res., 1991, 32, 29–35 CAS.
- E. D. Goldberg, V. T. Bowen, J. W. Farrington, G. Harvey, J. H. Martin, P. L. Parker, R. W. Risebrough, W. Robertson, E. Schneider and E. Gamble, Environ. Conserv., 1978, 5, 101–125 CrossRef CAS.
- M. Omori, Bull. Ocean Res. Inst. Univ. Tokyo, 1975, 7, 1–91 Search PubMed.
- W. D. Chiou, C. C. Wu and L. Z. Cheng, Fisheries Sci., 2000, 66, 1014–1025 CrossRef CAS.
- M. Nagase, H. Kondo and K. Hasebe, Analyst, 1995, 120, 1923–1926 RSC.
- J. L. Gomez-Ariza, I. Giraldez, E. Morales, F. Ariese, W. Cofino and Ph. Quevauviller, J. Environ. Monit., 1999, 1, 197–202 RSC.
- M. Ohji, I. Takeuchi, S. Takahashi, S. Tanabe and N. Miyazaki, Mar. Pollut. Bull., 2002, 44, 16–24 CrossRef CAS.
- OECD guideline for testing of chemicals, Proposal for a new guideline 212, Paris, 1998, pp. 1–20 Search PubMed.
- K. Fent and P. W. Looser, Wat. Res., 1995, 29, 1631–1637 CrossRef CAS.
- P. W. Looser, M. Berg, K. Fent, J. Muhlemann and R. P. Schwarzenbach, Anal. Chem., 2000, 72, 5136–5141 CrossRef CAS.
- C. Carlier-Pinasseau, G. Lespes and M. Astruc, Appl. Organomet. Chem., 1996, 10, 505–512 CrossRef CAS.
- R. Q. Yang, Q. F. Zhou and G. B. Jiang, Chemosphere, 2006, 63, 1–8 CrossRef CAS.
- S. D. Rice, J. W. Short and W. B. Stickle, Mar. Environ. Res., 1989, 27, 137–145 CrossRef CAS.
- M. H. Devier, S. Augagneur, H. Budzinski, P. Mora, J. F. Narbonne and P. Garrigues, Environ. Toxicol. Chem., 2003, 22, 2679–2687 CAS.
- E. Oberdorster, D. Rittschof and P. McClellan-Green, Aquat. Toxicol., 1998, 41, 83–100 CrossRef CAS.
- F. Boisson, O. Cotret, J. L. Teyssie, M. El-Baradei and S. W. Fowler, Mar. Pollut. Bull., 2003, 46, 1549–1557 CrossRef CAS.
- G. W. Bryan, P. E. Gibbs, G. R. Burt and L. G. Hummerstone, J. Mar. Biol. Ass. UK, 1987, 67, 525–544 Search PubMed.
- Y. H. Chen and I. M. Chen, Fisheries Sci., 2002, 65, 811–816.
- J. L. Gomez-Ariza, E. Morales and I. Giraldez, Mar. Environ. Res., 1999, 47, 399–413 CrossRef CAS.
- R. Q. Yang, Q. F. Zhou and G. B. Jiang, Chemosphere, 2006, 63, 1–8 CrossRef CAS.
- T. Verslycke, J. Vercauteren, C. Devos, L. Moens, P. Sandra and C. R. Janssen, J. Exp. Mar. Biol. Ecol., 2003, 288, 167–179 CrossRef CAS.
- J. H. Lignot, F. Pannier, J. P. Trilles and G. Charmantier, Aquat. Toxicol., 1998, 41, 277–299 CrossRef CAS.
- L. R. Goodman, G. M. Cripe, P. H. Moody and D. G. Halsell, Bull. Environ. Contam. Toxicol., 1988, 41, 746–753 CrossRef CAS.
- K. W. H. Kwok and K. M. Y. Leung, Mar. Pollut. Bull., 2005, 51, 830–837 CrossRef CAS.
- L. W. Jr Hall, S. J. Bushong, W. S. Hall and W. E. Johnson, Environ. Toxicol. Chem., 1988, 7, 41–46 CrossRef.
- S. C. Uren, Mar. Pollut. Bull., 1983, 14, 303–306 CrossRef CAS.
- J. Meador, Oceans, 1986, 18, 1213–1218 Search PubMed.
- S. J. Bushong, W. Lenwood, L. W. Hall, W. S. Hall, W. E. Johnson and R. L. Herman, Water Res., 1988, 22, 1027–1032 CrossRef CAS.
- J. E. Thain, International Council for the Exploration of the Sea, Mariculture CommitteeE:13, 1983, 5–10 Search PubMed.
- Jr L. W. Hall and A. E. Pinkney, CRC Crit. Rev. Toxicol., 1985, 14, 159–209 CrossRef.
- S. Hadjispyrou, A. Kungolos and A. Anagnostopoulos, Ecotoxicol. Environ. Saf., 2001, 49, 179–186 CrossRef CAS.
| This journal is © The Royal Society of Chemistry 2009 |