China's rapid deployment of SO2 scrubbers
Yuan
Xu
*a,
Robert H.
Williams
b and
Robert H.
Socolow
c
aWoodrow Wilson School of Public and International Affairs, Princeton University, Princeton, NJ 08544, USA. E-mail: yuanxu@princeton.edu
bPrinceton Environmental Institute, Princeton University, Princeton, NJ 08544, USA. E-mail: rwilliam@princeton.edu
cDepartment of Mechanical and Aerospace Engineering, Princeton University, Princeton, NJ 08544, USA. E-mail: socolow@princeton.edu
First published on 13th March 2009
Abstract
Details are gradually emerging regarding China's extraordinary commitment to environmental technology that began in 2006. With the help of Chinese written references and some field verification, we tell here the story of the rapid deployment of sulfur dioxide scrubbers at coal power plants in 2006 and 2007. Scrubbers were installed in each of these years at plants with more than 100![[thin space (1/6-em)]](https://www.rsc.org/images/entities/char_2009.gif) 000 megawatts of total generating capacity, overtaking the rate of construction of new coal power plants. Scrubber installation in each year equaled the entire scrubber capacity in the U.S. We also describe novel policies enacted by China in 2007 to increase the likelihood that installed scrubbers actually operate.
000 megawatts of total generating capacity, overtaking the rate of construction of new coal power plants. Scrubber installation in each year equaled the entire scrubber capacity in the U.S. We also describe novel policies enacted by China in 2007 to increase the likelihood that installed scrubbers actually operate.
Broader contextChina is not a democracy, has limited rule of law and is not yet as rich as is supposed to be necessary to reach the turning points of SO2 emissions as Environmental Kuznets Curve predicts. This is why the story we tell in the paper is much unexpected. China installed over 100 GWe of SO2 scrubbers in coal power plants in 2006 and again in 2007. The share of coal power plants with SO2 scrubbers increased from 10% to 48% respectively on the final days of 2005 and 2007, while the figure in the United States remained at 30%. In addition, China actually assured that the SO2 scrubbers would operate properly with a novel policy and effective policy enforcement. The story suggests that when China's intrinsic economic, technological, administrative and political strengths are aligned, it has the wherewithal to meet tough environmental goals. If CO2 capture and storage, an important technology to reduce CO2 emissions especially at large point sources, were to become a commercial activity under an international carbon mitigation regime, the story told here suggests that China could become deeply engaged and a formidable global competitor. |
1. Introduction
China's rapid economic growth has led to concerns about environmental protection. A representative perception is that China's “efforts have not been sufficient to keep pace with the environmental pressures and challenges generated by the very rapid growth of China's developing economy”.1 In public media, this judgment is echoed in phrases like “Choking on Growth”.2 In the language of the Environmental Kuznets Curve, studies have indicated that China has not been rich enough to reverse further environmental degradation.3,4 It has also been argued that a democratically elected government could better protect the environment than an authoritarian government such as China's.5 However, newly available information strongly suggests that a corner has been turned, at least with regard to SO2 emissions control at coal power plants.This paper describes and seeks to understand China's recent rapid deployment of SO2 scrubbers at coal power plants. For perspective this activity in China is compared to activities relating to SO2 mitigation in the United States. In addition, the paper also addresses the issue of the extent to which China's scrubbers are actually operating.
To explore possible causes of the unexpected SO2 scrubber deployment surge, we look into the technological, economic and political background for potential connections. Finally, possible implications for CO2 capture and storage at coal power plants are suggested.
2. China's SO2 scrubber deployment at coal power plants
The recent spectacular rate of installing new power plants in China has been widely discussed throughout the global community. During each of 2006 and 2007 over 100 GWe was installed—an unprecedented annual rate for any country.6 This new capacity is dominated by coal power plants and accordingly has raised much environmental concern.Less well known is that in each of these two years more than 100 GWe of SO2 scrubbers were installed on China's coal power plants (Fig. 1), both at new plants and as retrofits. During 2008–2010 at least another 130 GWe are projected to be added so as to reach the 355 GWe goal for new scrubbers in the 11th Five Year Plan.7 This scrubber activity is a major part of a broader set of initiatives aimed at accelerating the deployment of environmentally attractive energy technologies. For example, in each of the years 2006 and 2007 wind power capacity doubled.8 And during the last days of 2005 the GreenGen project was launched—the 1st phase (2006–2009) of which is to involve building a 250 MW coal integrated gasification combined cycle demonstration project, and the 2nd (2010–2012) and 3rd (2013–2015) phases of which will include, respectively, R&D on CO2 capture and storage (CCS), and the building of a commercial-scale (400 MW) demonstration coal gasification-based polygeneration plant with CCS.9
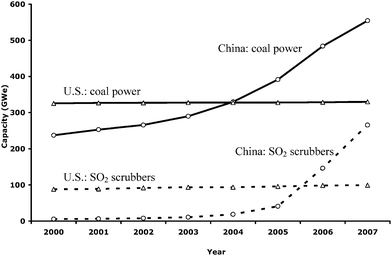 | ||
| Fig. 1 Capacities of SO2 scrubbers and coal power plants in China and the U.S.6,10,15,16 | ||
The scrubber capacity numbers presented in Fig. 1 were calculated from a publicly available plant-level dataset10 that is likely to be credible. The dataset includes 712 projects with information on the name and location of coal power plants, the serial number and power capacity of generators, the dates that generators and SO2 scrubbers came on line, SO2 scrubber technology type, and the name of the SO2 scrubber company in charge. Also, the State Environmental Protection Administration (Ministry of Environmental Protection after March 2008) has established a standard procedure for registering SO2 scrubbers11,12 for example, a SO2 scrubber has to operate continuously for 168 h to test its performance before registration. This dataset and registration procedure have greatly enhanced the capacity of the public sector to supervise scrubber activity and make cheating (the reporting of non-existing SO2 scrubbers to the Chinese government) unlikely.
3. China's power plant scrubber activity in relation to the U.S. scrubber activity
3.1 The percentage of coal power capacity with installed SO2 scrubbers
China's annual increment of scrubber capacity during 2006 and 2007 is more than the total fleet of U.S. scrubbers accumulated gradually over three decades. In 2007, the United States, the world's second largest coal consumer after China, had 330 GWe of coal power plant capacity, of which 99 GWe had SO2 scrubbers (about 30%); both capacities have been relatively stable over the past decade (Fig. 1). But in 2007 China had 554 GWe of coal power capacity and 266 GWe of SO2 scrubbers (48%) (Fig. 1).Data for Fig. 1 are not always straightforward. Because yearly data for coal power capacity per se have been unavailable to the authors, installed fossil fuel power capacity has been used as a surrogate. This simplifying assumption overestimates coal capacity only slightly because oil and gas power capacities are modest. This surrogate is also used by the Chinese government when presenting data on the share of coal power capacity with SO2 scrubbers.13 Coal capacity data are available for the year 2005, when China had respectively 12 GWe, 10 GWe and 368 GWe of oil, natural gas and coal power capacity.14 Thus for the year 2005 use of fossil fuel power capacity overestimates coal capacity by 6%.
China's fossil fuel power capacities during 2000–2004 are from the U.S. Energy Information Administration (EIA).15 In the EIA dataset, the annual data refer to the first day of the year, whereas in the present paper they refer to the final day. Accordingly, the EIA data are assigned to the previous year. For example, the fossil fuel capacity for 2004 in the EIA dataset is presented here as 2003 capacity.
All data for the United States are from the U.S. National Energy Technology Laboratory (NETL) in a database that includes information on individual coal power plants and SO2 scrubbers.16 Aggregate U.S. coal power capacities are calculated from data for those coal power plants with clear boiler-in-service date and nameplate information.
To get the integrated capacity figures of SO2 scrubbers in each year, those coal power plants with clear in-service dates for FGD units are singled out. 21 coal power plants with FGD unit ID but without other information are ignored. In addition, there are several coal power plants with scrubber-in-service dates but no generator capacity information (generator nameplate rating, in MWe). These FGD units are not counted in total capacity. Because an emphasis of the paper is on the experience with installed SO2 scrubbers, eleven FGD units out of service (in standby status or retired) are counted; however, because the total capacity of such units is only 3.9 GWe, inclusion implies that there is not a substantial difference between operating capacity and installed capacity.
The NETL data on total U.S. scrubber capacity differ somewhat from the data provided by the Energy Information Administration.17 For example, for 2005, the EIA and NETL datasets respectively indicate 101.6 GWe and 95.7 GWe of total SO2 scrubber capacity. Because the NETL dataset provides a complete history of SO2 scrubbers in the United States with considerable technological detail whereas the EIA dataset does not, the NETL database was selected for use in this paper.
3.2 Reducing sulfur contents as an alternative for SO2 mitigation
Most U.S. SO2 scrubbers (∼60%) were installed before the Clean Air Act Amendments of 1990 (Fig. 2). Afterwards, under the acid rain mitigation program, a major strategy for reducing SO2 emissions was switching to low-sulfur coal, so that the average sulfur content of received coal decreased from 1.2% in 1993 to 1.0% in 200518 In contrast, the average sulfur content in China had already been reduced by 2005 to about 1.05% (see below for calculation). Although efforts continue to try to reduce sulfur content further, the targeted absolute reduction of SO2 emissions cannot be realized in China with only this approach—widespread use of SO2 scrubbers is also necessary.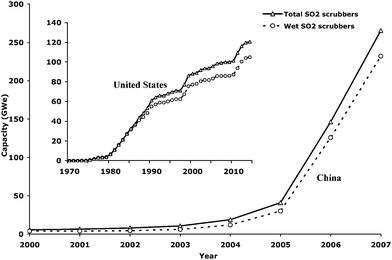 | ||
| Fig. 2 The installation of SO2 wet scrubbers in China and the U.S.10,16 (The U.S. wet scrubber capacity includes spray type, venture type, tray type, jet bubbling reactor, and packed type. Spray type dominates: in 2007, total U.S. wet scrubber capacity was 86 GWe, of which the spray type accounted for 68 GWe. The Chinese wet scrubber capacity includes only lime–limestone wet type.) | ||
Official data on the sulfur contents of Chinese coals are not available to the authors. However, it is feasible to estimate these values from available data and the formula: S content = (SO2 emissions + SO2 removal, in tonnes) / 2 / (S → SO2 conversion fraction) / (coal consumption, in tonnes).
In 2005, China consumed 2166 million tonnes or 45.8 EJ of coal, and emitted and removed, respectively, 25.5 and 10.9 million tonnes of SO2.4 An official document disclosed that, for the purpose of statistical estimation and particularly for power and domestic sectors, Chinese official statistics assume that, on average, 80% of the S in coal is converted to SO2.19 Because direct measurement has not been common in China, that ratio is likely to have been used in compiling official data of SO2 emissions. Assuming for non-power sectors, the sum of emitted and removed SO2 also corresponds to 80% of sulfur in coal consumed and that all SO2 emissions and removal in China are related only to coal, then the sulfur content in China's coal consumed in 2005 can be estimated to be (25.5 + 10.9) / 2 / 80% / 2166 = 1.05%.
A legitimate concern about the calculation is the accuracy of the assumed 80% conversion. The classic U.S. reference on the subject indicates that 90% or more of the S is converted to SO2 in coal combustion.20 Though the lower ratio implies a 12% underestimation of China's SO2 emissions, whether China uses a correct ratio or not does not affect the estimate of the average S content Chinese coals presented above.
3.3 Coal consumption as the scale for SO2 mitigation
In 2005, the United States consumed 23.3 EJ of coal, about 51% of China's consumption (Fig. 3). The power sector accounted for 92% of U.S. coal consumption but only 49% of China's. Because the power sector accounts for a much larger share of coal use in the U.S. than in China, reducing overall SO2 emissions by installing scrubbers on power plants is a more daunting challenge for China than for the United States. Scrubbers cannot be widely deployed for non-power SO2 sources, which tend to be much smaller than power plant sources, on average, making it difficult to increase rapidly the overall SO2 removal rate.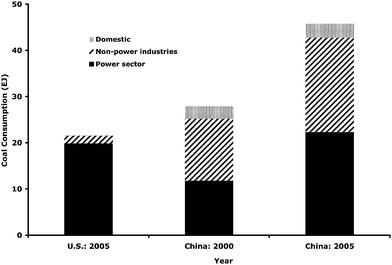 | ||
| Fig. 3 Coal consumption by sector in China and the U.S.4,25 (Energy contents of coal are used to convert mass to energy.) IEA reported that in 2005 China and the U.S. respectively consumed 1094 and 556 million tons of oil equivalent (Mtoe, 1 toe = 41.868 GJ, lower heating value) of coal14 The countries' official sources disclosed coal consumption in mass: 2.17 billion tonnes for China4 and 1.02 billion tonnes for the U.S.44 Average energy contents of coal can be calculated from these data: 21.2 GJ tonne−1 for China and 22.8 GJ tonne−1 for the U.S. These values are assumed to be constant across years and sectors. † | ||
Furthermore, in 2010, because of rapid electrification, China's power sector could consume a significantly larger share of coal. Accordingly, in order to realize the overall 10% emissions reduction goal in the 11th Five Year Plan (2006–2010), China's coal power plants must be much cleaner than those in the United States. In 2005, the SO2 emission rate per kWh of coal power in the U.S. averaged 5.1 g of SO2 emission.17 China's corresponding figure in 2005 was 6.4 g, and for 2010 China aims to reach 2.7 g.21
4. Are Chinese scrubbers actually running?
To realize its SO2 emissions reduction goal China must ensure that deployed scrubbers are actually working. Progress to date has been much slower in this regard. Indeed, in April 2007, after field inspections, China's State Environmental Protection Administration announced: “currently, only less than 40% of SO2 scrubbers are officially ready and running reliably and continuously”.22 However, since recognizing this problem, China has taken steps to resolve it. Multiple policies are being put into place to motivate routine scrubber use.Consider first the SO2 emissions charge, which was first introduced for coal power plants in 1992.23 After being tripled during 2003–2005 from $28/ton SO2,24 the emission charge will be further doubled during 2007–2010, reaching $166/ton SO2.7 Although this overall six-fold increase is dramatic, it may not be adequate to ensure scrubber use. For example, the charge in 2010 is equivalent to $1.3/MWh for Datong bituminous coal with 0.99% sulfur and a 0% scrubber operation rate (Fig. 4). In 2005, to fully operate SO2 scrubbers, the average operation and maintenance cost in the United States was $1.2/MWh.25 If the cost is similar in China (no data are available to the authors on scrubber operation and maintenance costs in China), a plant operator would be roughly indifferent to operating scrubbers and paying the emission charges—and might opt for the latter easier course.
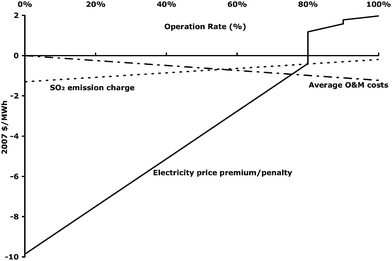 | ||
| Fig. 4 China's economic incentives to enhance SO2 scrubbers' operation rates.7,26 (This price premium/penalty curve reflects current public policy in China.26 All monetary numbers are expressed in the US dollars (USD) of 2007, when the average exchange rate was 7.60 RMB/USD.45 The SO2 emission charge in 2010 was converted from $/tonne SO2 to $/MWh by assuming: Datong bituminous coal containing 0.99% sulfur and having a lower heating value of 21 GJ tonne−1,46 a coal power plant thermal efficiency of 34.6% (LHV basis, China's goal for 201047), and an 85% SO2 removal rate.) | ||
On July 1, 2007 a complementary compliance policy with two significant provisions went into force.26 One is that all coal power plants with SO2 scrubbers must install continuous monitoring systems and transfer real-time data to the government. The other is an incentive scheme that varies with the scrubber's operation rate: for a 100% operation rate electricity can be sold to the grid at a $2.0/MWh price premium compared to a plant without scrubbers; but the premium falls to zero at an 80% operation rate, and at lower operation rates the incentive is a penalty that increases as the operation rate falls—reaching a fine of $9.9/MWh when the scrubber does not operate at all (Fig. 4). This policy has already begun to show some success. For its 28 GWe of SO2 scrubbers, the coastal province of Jiangsu realized an operation rate of 97% in July 2007—a rate that was verified with continuous monitoring systems—up from 62% in May 2007.27,28
5. What made this widespread deployment of scrubbers feasible?
The ongoing rapid deployment of scrubbers not only is a significant environmental accomplishment (providing that China's new incentive policy for scrubber operations is successful), but also it demonstrates industrial prowess: being able to design, manufacture, and put into place so much industrial equipment in such a short period of time. The commercial availability of SO2 scrubber technologies, China's rapidly growing economy, its technological capacity, and recent serious attention to environmental protection by China's top leaders are all factors that have facilitated this effort.SO2 scrubber technologies have been commercially available for three decades in developed countries, and no monopoly power exists to control the licensing of scrubber technologies to China. For example, from several leading companies that disclose their sources of technologies online, the international providers of scrubber technologies to China include companies from the United States, Japan, Germany, and Austria (Table 1). Moreover, the wet scrubber has emerged as the dominant technology10,16,29 and has been the focus of the Chinese deployment activity. Fig. 2 shows the historical installation of SO2 scrubbers and wet scrubbers in the U.S. and China—with wet scrubbers dominating the market. This is also the case worldwide: in 1998, the world had 227 GWe of SO2 scrubbers, of which 197 GWe (87%) were wet scrubbers.29 There being a single dominant technology on the market offered China a strategic opportunity to exploit standardization, its mass production capabilities and its low-cost labor, thereby facilitating rapid deployment and cost reduction. China's rapid economic growth provides much supporting infrastructure for scrubber deployment. Moreover, industry accounts for about 50% of China's economy and is growing fast,4 which implies that only a small percentage of incremental industrial output is needed to support the transition to scrubbers.
| SO2 scrubber company (e.g.) | Cumulative installation until 2007 (GWe)10 | Technology providers | Source | |
|---|---|---|---|---|
| Country | Company | |||
| Guodian Longyuan | 30.2 | Germany | FBE | http://www.lyhb.cn |
| China | own | |||
| Wuhan Kaidi | 24.1 | Germany | WULFF | http://www.kdep.com.cn |
| U.S. | Babcock&Wilcox | |||
| U.S. | MET | |||
| Beijing Boqi | 17.3 | Japan | KHI | http://www.bootes.com.cn |
| Japan | Chiyoda | |||
| CEI Yuanda | 16.1 | Japan | Mitsubishi | http://www.yuandaep.com |
| Austria | Austrian Energy & Environment | |||
| China | Own | |||
| Shandong Sanrong | 16.1 | Germany | LLB | http://www.ssepec.net.cn |
| Japan | KHI | |||
| Zhejiang Tiandi | 9.1 | U.S. | Babcock&Wilcox | http://www.ztepe.com |
| Shanghai Longjin | 8.1 | Germany | LLB | http://www.longking.cn |
| Huadian Gongcheng | 7.8 | U.S. | MET | http://www.chepc.com.cn |
| Japan | Mitsubishi | |||
The technological underpinnings of China's economy are also important. Three decades of economic reform and social development have given China the capacity to address technologically challenging problems, including environmental problems such as power plant pollution. For example, in the past decade, China produced a rapidly growing population of college graduates and those with advanced degrees; many of these degrees were in engineering (Fig. 5 and 6), giving China a substantial technical capacity to pursue technologically challenging activities such as the simultaneous deployment of a large number of scrubber projects at power plants.
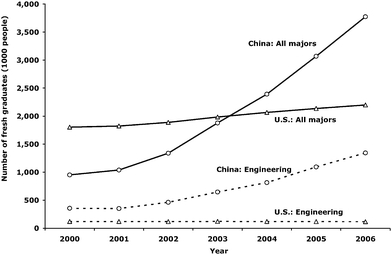 | ||
| Fig. 5 Number of graduates from colleges and universities in China and the U.S.4,48 (The U.S. data count degrees granted, including associates and bachelors. China provides aggregate data for graduates, including those not receiving degrees.) | ||
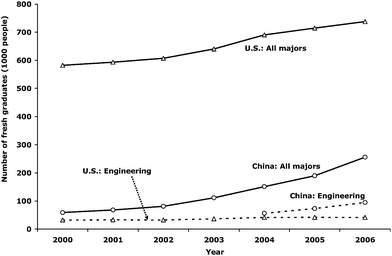 | ||
| Fig. 6 Number of graduates from graduate schools in China and the U.S.4,48 (The U.S. data count degrees granted, including masters, first-professionals and doctors. China provides aggregate data for graduates.) | ||
Throughout the history of the Chinese Communist Party, a crucial indicator of the authority of new leaders has been their ability to establish a new theory or ideology to guide governance. China's new leaders, who came to power formally in March 2003, called their new ideology “the scientific view of development”. They championed a new goal for development: the satisfaction of people's multi-faceted needs, including environmental protection. They moved China away from a narrow focus on economic growth and initiated a fundamental change in the approach of the Chinese central government to environmental protection.
China's leaders espoused this ideology in part as a result of the SARS (Severe Acute Respiratory Syndrome) pandemic, which broke out in China at the same time as their ascent to leadership. The first SARS case occurred on November 16, 2002, in China's southern province of Guangdong.30 SARS in Beijing became a concern for a WHO team on April 9, 2003.30 After first being denied access by the Chinese government, the WHO team was permitted on April 15 to visit military hospitals that were suspected of non-honest reporting related to SARS. It was then estimated that many cases in Beijing were not being reported.30 The new Chinese leadership coming into power at the time played a pivotal role in reversing the tragic situation in Beijing. After being informed of the situation by WHO, on April 17, the Standing Committee of the Party's Political Bureau, the highest Chinese leadership, gathered and ordered transparent reporting and a pro-active response to the SARS challenge.31 Three days later on April 20, China witnessed for the first time the removal of high-level leaders from positions of authority because of their shortcomings in governance; the mayor of Beijing and the minister of Health were unseated from their Party posts and shortly after from their government jobs.32 The effective mobilization of the Chinese government afterwards gradually suppressed SARS's further pandemic infection in Beijing.
The pandemic's effects were widely felt. There was a sharp decline of activities where people congregate (e.g., restaurants, public transportation) in the second quarter of 2003, when the pandemic was the most severe. At the macroeconomic level, China's GDP from the service sector dropped 0.7% below the level of the prior year, while the corresponding comparison for the first quarter was 7.6% growth (Fig. 7). On July 28, 2003, at a national conference on preventing and combating SARS, President Hu Jintao summarized what China had learned from the ordeal of SARS, asserting that promotion of economic growth must be only one aspect of development policy.33
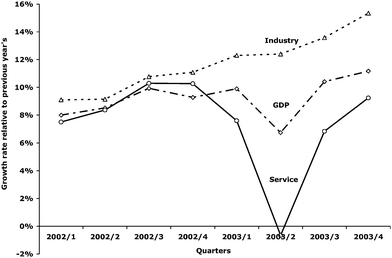 | ||
| Fig. 7 China's real quarterly GDP growth.4,49 (China's official data are presented as GDP and growth rates for the first quarter, the first two quarters, the first three quarters, and the whole year. Quarterly growth rates were calculated from these data by assuming that the inflation rate is constant throughout the quarters of a given year and changes only annually.) | ||
A new “scientific view of development” ideology was composed by and became a theoretical asset of the new leadership, especially President and Party Secretary General Hu Jintao. It facilitated the establishment of Hu's authority as the new highest leader.
The concept of “scientific view of development” and its implications have evolved over the last several years. The Chinese Communist Party has advanced this ideology through the annual high-profile conferences of the 16th Party Congress, beginning with the 3rd conference in October 2003, the first after the SARS event. The document “Decision on improving several points of socialistic market economic institutions” released at that conference, proposed five types of coordination, including the coordination between human beings and nature.34 This conference is currently recognized to be the formal initialization of the “scientific view of development”. The 4th conference gathered in September 2004. The key document was “Decision on strengthening the party's administrative ability”. By this time the “scientific view of development” had become a mature term and occupied a much more prominent position. Environmental protection was clearly pointed out to be a component of the “scientific view of development”. The final objective was declared to achieve a “harmonious society”.35 The 5th conference focused mainly on designing China's National 11th Five-Year Plan. The conference was convened in October 2005 and proposed “Suggestions on designing the National 11th Five-Year Plan” in which environmental protection got significant attention.36 The “scientific view of development” became the central theme of the 11th Five-Year Plan. The 5th conference signified the firm establishment of the “scientific view of development” in directing China's administration and progress.
It is plausible that China's leaders set the ambitious goal for SO2 emissions reduction in the 11th Five-Year Plan and put into place policies to enhance the likelihood of its realization, despite the failure to achieve the same goal in the 10th Five Year Plan (when emissions actually increased 28%4), as part of an effort to firmly establish this new ideology for guiding governance.
6. Implications for CO2 capture and storage
The scrubber story suggests that when China's intrinsic economic, technological, administrative and political strengths are aligned, it has the wherewithal to meet tough environmental goals. Active environmental governance and capacity building may be crucial to reverse environmental degradation caused by economic growth. China's experience might be relevant for even tougher environmental challenges such as carbon mitigation, and in particular CO2 capture and storage (CCS), an important mitigation option for coal-intensive energy economies.37In June 2007, China initiated its National Climate Change Programme,38 which declared it would reduce greenhouse gas emissions under the guidance of the “scientific view of development.” Is the SO2 scrubber experience a foreshadowing of what might happen in China with respect to CCS?
Both scrubbers and CCS relate to coal energy conversion, a strong suit for China. Although China's coal power plants are exclusively based at present on coal steam–electric technology, China leads the world in deployment of modern gasifiers, accounting for 25% of world installed capacity worldwide compared to 12% for the United States,39 which provide the basis for the coal integrated gasifier combined cycle (IGCC) power plant, currently the least costly CCS option for coal power plants under US conditions.40 This coal gasification experience is in China's chemical process and emerging synthetic fuels industries—experience that reflects China's scant resource bases for oil and natural gas.
Thus China has made a political decision to pursue carbon mitigation and has a technological infrastructure that could be helpful in pursuing coal CCS technologies. But there are two features of CCS technology that make replicability of the SO2 scrubber story more difficult. The first is that CCS is expected to increase generation costs for new pulverized coal plants by 43% to 91%37 whereas scrubbers increase the generation cost only ∼11%.17,37 The second is that although CCS technologies are commercially ready, at least for gasification systems,41 these technologies are not yet established in the market.
However, these considerations do not necessarily invalidate the scrubber model. China is in a position to help establish CCS technologies in the market. Several large chemical and synfuel plants based on coal gasification—including plants that make ammonia for fertilizers42—are being built and planned in China. These plants generate as coproducts large streams of pure CO2 for which CO2 capture costs are low,37 making such plants attractive candidates of early CCS projects if there are suitable storage sites nearby. Moreover, the incremental cost for CCS has to be considered relative to costs for alternative carbon mitigation options. A recent study estimates that China and other coal-intensive energy economies may well have greater difficulty and incur considerably more cost in meeting their eventual carbon mitigation obligations if CCS is not a major mitigation option.43
If CCS were to become a major commercial activity under an international carbon mitigation regime, it would not be difficult to imagine that China's strong inherent economic, technological, and political capabilities to address difficult problems would be mobilized to win China a strong competitive position.
7. Conclusion
China's aggressive deployment of SO2 scrubbers since 2006 shows that a poor authoritarian country can make major strides in improving environmental quality quickly, when conditions are ripe for so doing—contradicting conventional wisdom. The commercial availability of SO2 scrubber technologies, China's rapidly growing economy, its technological capacity, and recent attention to environmental protection by China's top leaders are all factors that have facilitated this effort. The ramifications of this experience for other environmental issues, including the much more daunting challenge of pursuing CO2 capture and storage for coal energy conversion, will be of great interest to the global community.References
- OECD, OECD Environmental performance reviews–China, OECD Publishing, Paris, France, 2007 Search PubMed.
- J. Kahn and J. Yardley, in New York Times, NY, NY, 2007 Search PubMed.
- D. I. Stern and M. S. Common, J. Environ, Econ. Manage., 2001, 41, 162–178 CrossRef.
- National Bureau of Statistics of China(NBS), China Statistical Yearbook, China Statistics Press, Beijing, China, 2001–2007 Search PubMed.
- R. A. Payne, J. Democr., 1995, 6, 41–55 Search PubMed.
- China Electricity Council, Annual report of national power generation, Beijing, China, 2006–2008, (in Chinese) Search PubMed.
- State Council, Notice on distributing “Composite Working Plan on Energy Conservation and Pollutant Emission Reduction”, Beijing, China, 2007, (in Chinese) Search PubMed.
- Global Wind Energy Council, Global Wind Report - 2006 & 2007, Brussels, Belgium, 2007–2008 Search PubMed.
- S. Xu, GreenGen—Near Zero Emission Coal Based Power Demonstration Project in China, 2007 Search PubMed.
- Ministry of Environmental Protection of China, China's capacity of water treatment plants and SO2 scrubbers at coal power plants, Beijing, China, 2008, (in Chinese) Search PubMed.
- State Environmental Protection Administration (SEPA), Technical guidelines for environmental protection in power plant capital construction project for check and accept of completed project, Beijing, China, Entry into force on May 1, 2006, (in Chinese) Search PubMed.
- SEPA, Flue gas limestone/lime – gypsum desulfurization project technical specification of thermal power plant, Beijing, China, Entry into force on October 1, 2005, (in Chinese) Search PubMed.
- Ministry of Environmental Protection of China, Report on major pollutant emission reduction (No. 20), Beijing, China, 2008, (in Chinese) Search PubMed.
- IEA, World Energy Outlook 2007, Paris, France, 2007 Search PubMed.
- EIA, International electricity installed capacity, Washington, D.C., 2007 Search PubMed.
- U.S. National Energy Technology Laboratory (NETL), NETL's 2007 Coal Power Plant DataBase, 2007 Search PubMed.
- EIA, Electric Power Annual with data for 2006, Washington, D.C., 2007 Search PubMed.
- EIA, Receipts, Average Cost and Quality of Fossil Fuels, Washington, D.C., 2008 Search PubMed.
- State Council, Notice on distributing implementation plans and methods of statistics, monitoring and assessment on energy conservation and pollutant emission reduction, Beijing, China, 2007, (in Chinese) Search PubMed.
- J. G. Singer, Combustion, fossil power systems: a reference book on fuel burning and steam generation, 3rd edn, Combustion Engineering, Windsor, CT (1000 Prospect Hill Rd., Windsor 06095), 1981 Search PubMed.
- National Development and Reform Commission (NDRC) and SEPA, The 11th five-year plan on SO2 control in existing coal power plants, Beijing, China, 2007, (in Chinese) Search PubMed.
- SEPA, A Letter to ask for comments on “11th Five-year Plan of National Environmental Protection Technology Management System Establishment (draft for comments)”;, Attachment 2: Exponents, Beijing, China, 2007, (in Chinese) Search PubMed.
- SEPA, Bureau of Price, Ministry of Finance and Office of Economy and Trade, Plan on experimenting levying SO2 discharge fee from industrial coal consumption, 1992, (in Chinese) Search PubMed.
- State Development Planning Commission, Ministry of Finance, SEPA and State Economic and Trade Commission, Measures for the administration of the charging rates for pollutant discharge fees, 2003, (in Chinese) Search PubMed.
- EIA, Official Energy Statistics from the U.S. Government, Washington, D.C., 2008 Search PubMed.
- NDRC and SEPA, Management measures on desulfurized electricity price and the operation of desulfurization facilities of coal power generators (on trial), Beijing, China, 2007, (in Chinese) Search PubMed.
- Jiangsu Environmental Protection Bureau, Information on the operation of FGD facilities in coal power plants (July 2007), Nanjing, China, 2007, (in Chinese) Search PubMed.
- State Electricity Regulation Commission (Nanjing office), Summary of special actions on environmental protection, Nanjing, China, 2008, (in Chinese) Search PubMed.
- R. K. Srivastava, W. Jozewicz and C. Singer, Environ. Prog., 2001, 20, 219–228 CrossRef CAS.
- WHO, Update 95-SARS: Chronology of a serial killer, 2003 Search PubMed.
- Xinhua News Agency, A conference of the Standing Committee studied further response to SARS, 2003, (in Chinese) Search PubMed.
- Xinhua News Agency, Important official appointment and removal, 2003, (in Chinese) Search PubMed.
- Xinhua News Agency, Hu Jintao spoke at the national conference on preventing and combating SARS, 2003, (in Chinese) Search PubMed.
- Xinhua News Agency, Decision on improving several points of socialistic market economic institutions, 2003, (in Chinese) Search PubMed.
- Xinhua News Agency, Decision on strengthening the party's administrative ability, 2004, (in Chinese) Search PubMed.
- Xinhua News Agency, Suggestions on designing the national 11th five-year plan, 2005, (in Chinese) Search PubMed.
- IPCC, IPCC Special Report on Carbon dioxide Capture and Storage, 2005 Search PubMed.
- NDRC, China's National Climate Change Programme, Beijing, China, 2007 Search PubMed.
- NETL, Gasification Database, 2007 Search PubMed.
- NETL, Cost and performance comparison baseline for fossil energy power plants, 2007 Search PubMed.
- MIT, The future of coal—options for a carbon-constrained world, Massachusetts Institute of Technology, 2007 Search PubMed.
- K. C. Meng, R. H. Williams and M. A. Celia, Energy Policy, 2007, 35, 2368–2378 CrossRef.
- IEA, Energy technology perspectives: scenarios and strategies to 2050OECD Publishing, Paris, France, 2006 Search PubMed.
- EIA, U.S. Coal Consumption by End-Use Sector, Washington, D.C., 2007 Search PubMed.
- State Administration of Foreign Exchange of China, China's daily exchange rates, 2007 Search PubMed.
- D. Shi and C. Yu, Optimization design, technical control and coal quality evaluation of contemporary coal pre-processing, China Contemporary Audio and Video Press, 2005, (in Chinese) Search PubMed.
- NDRC, 11th Five-year plan on energy development, Beijing, China, 2007, (in Chinese) Search PubMed.
- National Center for Education Statistics, Digest of Education Statistics 2007, U.S. Department of Education, Washington, D.C., 2007 Search PubMed.
- NBS, Quarterly Statistical Data, Beijing, China, 2008 Search PubMed.
Footnote |
| † In China's Statistical Yearbook, coal consumption data for 2000 were revised once in the early editions of this yearbook released after 2000. The data presented here are from later editions. |
| This journal is © The Royal Society of Chemistry 2009 |
