Green energy storage materials: Nanostructured TiO2 and Sn-based anodes for lithium-ion batteries
Da
Deng
a,
Min Gyu
Kim
b,
Jim Yang
Lee
*a and
Jaephil
Cho
*c
aDepartment of Chemical & Biomolecular Engineering, Faculty of Engineering, National University of Singapore, 10 Kent Ridge Crescent, Singapore 119260. E-mail: cheleejy@nus.edu.sg
bBeamline Research Division, Pohang Accelerator Laboratory, Pohang, Korea 790-784
cSchool of Energy Engineering, Ulsan National Institute of Science & Technology, Ulsan, Korea 689-805. E-mail: jpcho@unist.ac.kr
First published on 21st April 2009
Abstract
It is expected that the market dominance of lithium-ion batteries will continue for at least another decade as there are currently no competing alternatives with the versatility of lithium-ion batteries for powering mobile and portable devices; and for buffering the fluctuating supply of intermittent energy sources such as wind and solar. While the pursuit of higher energy density and higher power density materials constitute the bulk of current interest, there is increasing interest in durable active battery materials that can be produced with minimum environmental impact. It is with these considerations that TiO2- and Sn-based anode materials are most interesting candidates for fulfilling future green energy storage materials. This review will focus on the recent developments of nanostructured TiO2 and Sn-based anode materials, including rutile, anatase, TiO2 (B), and coated TiO2, and pristine SnO2, and SnO2/C, Sn(M)/C composites.
 Da Deng Da Deng | Da Deng received a BEng degree in Environmental Engineering from National University of Singapore (NUS). He is currently a PhD candidate (with Prof. J.Y. Lee) in Chemical and Biomolecular Engineering at NUS. His PhD research project focuses on the design, synthesis and characterization of materials for Li-ion batteries and for self-cleaning applications. |
 Min Gyu Kim Min Gyu Kim | Min Gyu Kim is a senior researcher at the Pohang Accelerator Laboratory (PAL), Korea. He received a PhD in Chemistry from Yonsei University (Korea) in 2000. After completing a post-doctoral fellowship at the Department of Chemical Engineering, Pohang University of Science and Technology (POSTECH) (Korea) he joined the beamline research division of PAL in 2002. He is currently in charge of a BL7C1 (XAFS-II) beamline dedicated to X-ray Absorption Fine Structure and beamline construction of BL10A (HF-XAFS) with a Wiggler insertion device. His research interests focus on solid state chemistry combined with synchrotron radiation XAFS and X-ray scattering, covering the synthesis and characterization of low-dimensional materials for energy storage–conversion materials, intercalation and organic–inorganic hybrid materials. |
 Jim Yang Lee Jim Yang Lee | Jim Yang Lee is Professor of Chemical and Bimolecular Engineering at NUS. He is a Senior Fellow of the Energy Studies Institute and holds an adjunct appointment at the Institute of Materials Research and Engineering. His research interests include materials and processes for batteries and fuel cells, and the green synthesis of nanostructured materials. |
 Jaephil Cho Jaephil Cho | Jaephil Cho is Professor of Energy Engineering at Ulsan National Institute of Science & Technology, Korea. He received a MS and PhD in Ceramic Engineering from Iowa State University (USA) in 1993 and 1995, respectively, and a BS in Materials Engineering from Kyungpook National University (Korea) in 1990. In 1995, he joined the School of Materials Science and Engineering at Georgia Institute of Technology (USA) as a post-doctoral fellow, studying Li-ion conducting glass and polymer composite solid electrolytes and combustion reactions of cathode materials. He moved to R & D at Samsung SDI Co. Ltd as a Senior Researcher in 1996, and worked on the development of Li-ion battery cathode materials until August, 2002. From September, 2002 to 2007 and 2008, he was Professor of Applied Chemistry at Kumoh National Institute of Technology and Hanyang University (Korea). His current research is focused mainly on nanomaterials for energy conversion and storage, nanoscale coating, and safety enhancement of Li-ion batteries. |
Broader contextIt is expected that the market dominance of lithium-ion batteries will remain for at least another decade as there are currently no competing alternatives with the versatility of lithium ion batteries for powering mobile and portable devices; and for buffering the fluctuating supply of intermittent energy sources such as wind and solar. While the pursuit of higher energy density and higher power density materials constitute the bulk of current interest, there is increasing interest in durable active battery materials that can be produced with minimum environmental impact. It is with these considerations that TiO2- and Sn-based anode materials are most interesting candidates for fulfilling future green energy storage materials. This review will focus on the recent developments of nanostructured TiO2 and Sn-based anode materials. |
Introduction
Lithium-ion batteries (LIBs) are considered the most promising energy storage technologies for mobile electronics, electric vehicles and renewable energy systems operating on intermittent energy sources such as wind and solar.1 Usually LIBs are connected in series or in parallel to deliver the user specified electrical characteristics. The active cathode and anode materials in a typical LIB are LiCoO2 and graphite respectively (Fig. 1); electrically insulated by a porous polypropylene membrane separator and an intervening electrolyte of LiPF6 in a mixture of organic solvents (e.g. ethylene carbonate and diethyl carbonate). During discharging, the electrochemical potential difference between the anode and cathode drives the Li+ ions to move from anode to cathode internally through the electrolyte. The reverse process occurs during charging.2,3 The reversibility of the charge and discharge reactions at the electrodes determines the reversibility of the battery. The three most important performance indicators for a LIB are capacity, cyclability and rate capability, which are strongly dependent on the properties of the active electrode materials. For emerging applications, however, fundamental improvements are needed with regard to power, safety, cycle life, and cost. Research into low price and high efficiency energy storage materials have been recently intensified, and among various candidates, TiO2 and SnO2 materials have been intensively investigated due to their versatile and easy modification of nanostructures.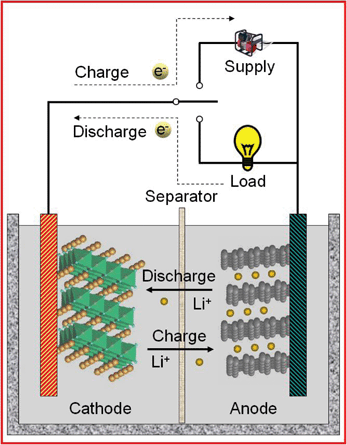 | ||
| Fig. 1 The components of a typical lithium-ion battery and the electrochemical processes in charging and discharging. The typical cathode and anode materials are LiCoO2 and graphite respectively. | ||
Downsizing from conventional bulk state to nanoscale dimensions has been widely used as the means to increase the energy storage capacity of TiO2.4 In 1998, Kasuga et al. first reported a simple template-free method to synthesize TiO2nanotubes from amorphous TiO2 and 10 M NaOH in a hydrothermal reactor at 110–150 °C, followed by washing with 0.1 M HCl.5,6 TiO2 is a typical Li-ion intercalation compound with a volume change < 4% in the reaction: TiO2 + xLi+xe− ↔ LixTiO2 (0 ≤ x ≤ 1). It is most noted for its ease of fabrication into various particle morphologies such as nanotubes, nanowires, and nanoparticles.7–12 The negligible lattice changes of TiO2-based structures upon Li-ion intercalation and de-intercalation are responsible for the enhanced structural stability and longer cycle life. One drawback, however, is the poor lithium and electronic conductivity of the bulk state and low specific capacity. One strategy to address these issues is the use of nanostructured TiO2 materials. The large surface area of nanostructured TiO2 materials increases the electrolyte/electrode contact area, which leads to the decrease of the current density per unit surface area and an increase in the charge/discharge rate. Moreover, the nanostructure provides a shorter path for Li+ transport, permitting the battery to use materials with lower ionic conductivity. The high surface area, on the other hand, incurs more side reactions with the electrolyte, and the thickness of the solid electrolyte interface (SEI) layer may be larger than in the case of bulk TiO2 impeding electron and Li ion transport in and out of the structure. In the case of nanoporous TiO2, due to the increased volume fraction of the pores, volumetric energy density also decreases compared to bulk TiO2.
On the other hand, considering the fact that the graphite-based anode is now approaching its theoretical limit of 372 mAh g−1 (based on LiC6 stoichiometry), there is a need for the next generation of LIBs to find a higher capacity substitute for the graphite anode.13–16 In 1997 Fujifilm announced an amorphous tin-based composite oxide anode (TCO) for LIBs.17,18 The design made use of Li–Sn alloying and de-alloying reactions for Li+ storage where the idealized stoichiometry of Li4.4Sn could deliver a capacity more than double that of graphite (993 mAh g−1). Although Fujifilm subsequently failed to commercialize the TCO anode because of poor cycling performance, it has started worldwide interest in anode materials based on metal oxides.15,16,19 Very recently Sony announced a new generation of LIBs with the trade name of Nexelion, which is based on a carbon–tin–transition metal composite (e.g. Sn–Co–C). Although the exact composition of the Li storage compound is not disclosed, this successful effort has rekindled another wave of interest in Li storage in tin-based host materials.20–23
The most-studied tin-based Li storage compound is tin oxide. In its first cycle of use, SnO2 is irreversibly converted to tin according to eqn (1) below. Subsequently, the in-situ formed tin phase could store and release Li ions according to the Li–Sn alloying and de-alloying reactions shown by eqn (2) below:
| SnO2 + 4Li+ + 4e− → Sn + 2Li2O | (1) |
| Sn + xLi+ + xe−1 ↔ LixSn (0≤ x ≤ 4.4) | (2) |
It is now known that the poor cycling performance of tin is caused by large specific volume changes (up to 300%) in charge and discharge reactions leading to the mechanical disintegration of the anode and loss of electrical connectivity between the active materials.24 One of the mitigating strategies to improve material stability is to reduce the active electrode material to the nanoscale.13,14,16,19,25,26 Nanomaterials, owing to their small size, are more accommodating to compressive and tensile strains.27 The high surface/volume ratio increases the electrode/electrolyte interface and promotes faster diffusion of Li+ ions within the material so that a higher charging rate is possible. Furthermore, certain irreversible electrochemical reactions in the bulk state could be made more reversible at the nanoscale. Eqn (1) is a good example.28 This could explain the higher than theoretical specific capacity that is sometimes observed in phase-pure SnO2 nanomaterials. The main disadvantage of tin-based nanomaterials is their lower volumetric energy density.27 On the other hand, it is known that the properties of nanomaterials are strongly structure and morphology dependent. Hence the transition from simple 0-dimensional (0-D) nanoparticles to a high-order nanostructure may offer opportunities to “tune-in” properties desirable for the intended application. However, the facile preparation of high-order nanostructured tin-based electrode materials is not a trivial exercise.
This review will focus on recent developments in TiO2 and tin-based anode materials for the LIBs. In the case of TiO2, we focus on the review on the electrochemical properties of three types of TiO2, that is, rutile, anatase, and TiO2 (B); especially their high rate performance which is significantly affected by the particle size and morphology. In addition, coating on the TiO2host will be discussed as a means to increase electronic conductivity of the host at higher current (C) rates. In the case of Sn-based electrodes, due to the large amount of available literature; we will limit the review to cover only new and novel synthesis methods and the preparation of intriguing nanostructures, especially the work carried out in the authors' laboratories. Consequently the discussions below are organized into the following sections: template-assisted and template-free fabrications of SnO2nanostructures, SnO2/C composite nanostructures, and Sn/C and Sn–M/C nanomaterials.
2. TiO2
2.1. Rutile
Rutile TiO2 (P42/mnm) is the most common and stable form of TiO2 (Fig. 2). The tetragonal rutile modification consists of TiO6 octahedra sharing edges in the c-direction and corners in the ab plane.29 The preferential site for Li+ insertion has been reported to be the oxygen octahedral vacancy.30 To reach this position, Li+ has to migrate through the tetrahedral site, which is neighbor to the octahedral site in the ab-plane (Fig. 2). Due to this special arrangement, Li+ diffusion in rutile is highly anisotropic. Experimental results and simulations support that the Li+ diffusion coefficient along the c-direction is approximately 10−6 cm2 s−1, while it is only 10−15 cm2 s−1 in the ab-plane, rendering Li+ diffusion in rutile nearly one dimensional.29,31,32 This means that Li diffusion proceeds through rapid diffusion along the c-axis channels. At low temperature the very slow diffusion in the ab planes Dab = 10−15 cm2 s−1 prevents Li ions from reaching the thermodynamically favorable octahedral sites and separates Li+ in the c channels.29,31,32 The repulsive Li–Li interactions in c together with the trapped Li-ion pairs in the ab planes may block the c channels and prevent further insertion.33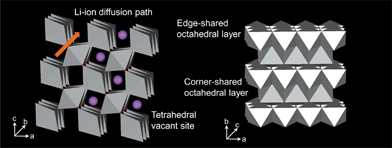 | ||
| Fig. 2 Structure of rutile TiO2. | ||
Generally, bulk rutile TiO2 is reported to host only a negligible amount of Li ions except at elevated temperatures. Although it shows high Li-ion diffusion coefficient in the order of ∼10−6 cm2 s−1, the one-dimensional character of the diffusion limits the Li-ion insertion over significant 3D volumes, causing the poor performance of the bulk materials. Since full Li loading (x = 1) of rutile could be achieved at 120 °C,34Li+ insertion into rutile is thermodynamically favorable. Yet, with the very low current density of C/300 (i.e., one lithium per formula unit in 300 h) used to discharge the micrometer-sized rutile electrodes at room temperature, the capacity was reported to be very low.35 This result suggests that the difficulty of Li insertion into micrometer-sized rutile at room temperature is due to kinetic restrictions.
Recently, it was found that nanosizing strongly increases both the capacity (∼Li0.85TiO2) and the rate capability.35 However, both bulk and nanoparticle TiO2 show low coulombic efficiencies, and a reason for this phenomenon is reported to be related to possible formation of a new phase around Li0.4TiO2, and the new phase is either a hexagonal structure (R-3m) or a cubic rock salt structure (Fm-3m). Molecular dynamics simulations of the Li-ion diffusion in the rutile structure revealed that maximum (chemically) lithiated microrutile (∼0.43 Li/Ti at room temperature) represents the formation of a layered morphology having a monoclinic symmetry (P2/m) similar to the previously suggested layered hexagonal structure.36 Further lithiation of the nanomaterial up to Li/Ti = 0.53 resulted in a phase transition toward an intermediate phase, very similar to the original rutile phase but slightly deformed, reducing the symmetry to the monoclinic P2/m space group. Upon further Li-ion insertion, up to ∼0.85 Li/Ti, this phase transformed toward another structure, again indexed by the monoclinic P2/m space group but now similar to the layered hexagonal R![[3 with combining overline]](https://www.rsc.org/images/entities/char_0033_0305.gif) m space group previously suggested to form in rutile TiO2 upon lithiation.18
m space group previously suggested to form in rutile TiO2 upon lithiation.18
The solid solution regime consisting of the coexistence of two phase region in microsized rutile is limited to x ∼0.07 Li/Ti. However, in the nanomaterial, the solid solution domain can extend up to x = 0.15 Li/Ti (i.e., further than in the micromaterial). This provides more evidence that reducing the crystallite size minimizes the miscibility gap of two-phase reactions upon lithiation, especially when lattice mismatches lead to strains between the phases, such as that recently demonstrated for anatase TiO2 (Fig. 3).37 On the other hand, the high specific surface area of nanocrystalline rutile provides more active sites for Li insertion and also for surface Li-ion storage. Li diffusion proceeds mainly through the c channels in rutile, but the thermodynamically stable positions for Li accommodation are the octahedral sites in the ab planes.32 The sluggish Li diffusion in the ab planes thus becomes the bottleneck for further Li insertion. Consequently, Li insertion occurs mostly on a thin surface layer rather than in the bulk. In the case of the most stable (110) surface of rutile, lithium insertion is mainly a surface effect because the Li atoms do not penetrate into the bulk. Hence increasing the specific surface area will enable a more pronounced Li-ion storage capability in the particle surface areas. There are two mechanisms for active Li-ion storage: storage of Li ions in the bulk (volume) of the material through intercalation or insertion reactions; and storage of Li ions at the material surface through electric double layer effects and surface redox processes. The surface Li-ion storage mechanism is strongly dependent on the surface area. At the same time, the capacity originated from the surface Li storage is highly reversible, which contributes significantly to the cyclability of the rutile nanoelectrode.
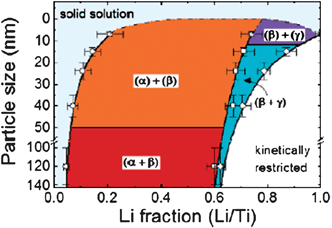 | ||
| Fig. 3 Phase diagram of Li composition in anatase TiO2vs. crystal particle size based on the neutron diffraction results. R indicates the anatase phase (I41/amd), α the Li-titanate phase (Imma) and β the Li1TiO2 phase (I41/amd). The different notation of the phase coexistence, for instance (R + α) or (R) + (β), reflects respectively, the coexistence or noncoexistence of the two phases within one crystalline particle. Reproduced with permission.37 | ||
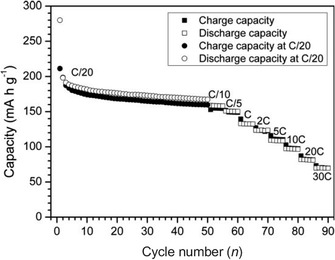
Fig. 4 shows the size effect of rutile TiO2 on electrochemical cycling. The Li storage capability increases greatly as the particles size decreases (that is, as the surface area increases).38 For example, the discharge capacity of the rutile with a particle size of 300 nm (R300) is only 110 mAh g−1. However, discharge capacities of 338 and 378 mAh g−1 are observed with particle sizes 30 (R30) and 15 nm (R15), respectively. Moreover, about 0.7 Li (264 mAh g−1) per unit of rutile TiO2 can be reversibly extracted from particles with a size of 15 nm (Fig. 4). Using ultrafine nanocrystalline rutile as the Li insertion host effectively increased the lithium storage capacity even at high discharge–charge current rates due to the shortened diffusion length and increased electrolyte–electrode contact area for Li+ insertion/extraction. The capacity loss of rutile nanoelectrodes is very large in the first cycle, suggesting that full extraction of the initially inserted Li+ ions is impossible. It is hypothesized that the slow diffusion in the ab planes and the Li–Li repulsive interactions in the c direction have trapped a substantial fraction of the intercalated Li+ ions. Similarly, nanometer-sized rutile shows a much higher electroactivity towards Li insertion than micrometer-sized rutile.31 An excellent property of this nanometer-sized rutile is a high rate capability and even at a rate of 30 C, a reversible capacity of 70 mAh g−1 is maintained. (Fig. 5)
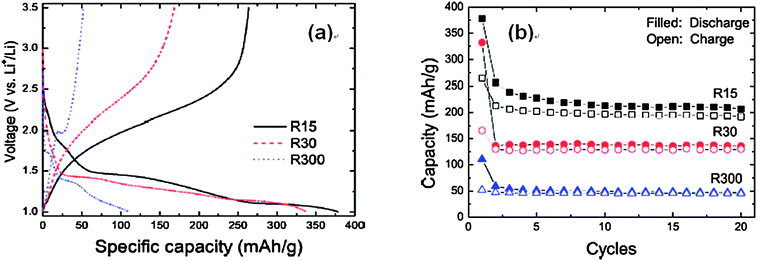 | ||
| Fig. 4 (a) Voltage profiles of rutile TiO2 with different particle sizes (R15, R30, and R300 denote the particle sizes of 15 nm, 30 nm, and 300 nm in TiO2) and (b) capacities vs. cycle number in coin-type half cells at a rate of 0.05 A g−1. Reproduced with permission.38 | ||
 | ||
| Fig. 5 Rate capabilities of TiO2nanoparticles with a size of 15 nm between 1 and 2.8 V at different C rates. Reproduced with permission.31 | ||
2.2. Anatase
3D networks of anatase TiO2 consist of strongly distorted edge sharing TiO6 octahedra with the space group of I41/amd. The anatase can be considered as a stacking of 1D zigzag chains consisting of distorted edge-sharing octahedra. This stacking leads to empty zigzag channels in the anatase framework.39 The spheres in Fig. 6 depict the possible positions of lithium ions in anatase. Filling all sites leads to stoichoimetry of LiTiO2, but this is unlikely to be a real situation. Upon Li insertion, anatase converts into a two-phase mixture of tetragonal Li0.05TiO2 (space groupI41/amd) and the Li-rich orthorhombic Li0.5TiO2 (Imma).40 The overall orthorhombic distortion of the atomic positions in the transition from anatase to lithium titanate is small and leads to more regularly shaped TiO6 octahedra in lithium titanate than in anatase. The change in symmetry is accompanied by a decrease of the unit cell along the c-axis and an increase along the b-axis, resulting in an increase of ∼4% of the unit cell volume.41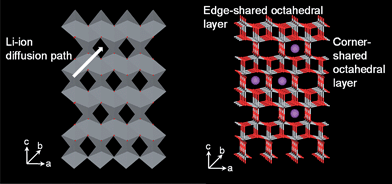 | ||
| Fig. 6 Structure of anatase TiO2. | ||
Among different existing TiO2 structural types (anatase, rutile, brookite, and TiO2(B)), studied in electrochemical cellsvs.Li+/Li0, anatase presents the most interesting properties with a capacity of about 0.6 lithium ion in LixTiO2 at 1.78 V vs.Li+/Li. This was confirmed separately using chemical lithiation with n-butyllithium which leads to a lithium uptake of 0.7 lithium per TiO2.42Ex-situX-ray diffraction upon lithium insertion demonstrated the formation of Li0.5TiO2, which crystallizes in an orthorhombic cell having an Imma space group, through a two-phase transition.43 Recently, further studies claimed that good reversibility can be achieved with nanostructured anatase TiO2 either as mesoscopic44,45 or nanotubes.46 The main effect of decreasing the crystallite size is to broaden the energy levels accessible in the materials, thus leading to a broader voltage window at which the electrochemical reaction takes place.47
Anatase TiO2nanotubes were first reported by Kasuga et al. in the reaction of TiO2 particles with NaOH aqueous solution. When bulk anatase TiO2 is treated in 10 M NaOH at 120 °C, layered-structured titanates such as NaxTiyOz can be formed as intermediate products. During the hydrothermal process, Na+ cations residing between edge-shared TiO6 octahedral layers can be replaced gradually by H2O molecules.48,49 Intercalated H2O molecules are larger than Na+ ions, so the interlayer distance increases and the static interaction between neighboring TiO6 octahedral sheets weakens. Consequently, layered titanate particles exfoliate to form nanosheets that curl up from the edges to form TiO2nanotubes.50–52 The TiO2 source used for preparing the nanotubes was commercially available rutile TiO2 powder (particle size 0.3 µm). A mixture TiO2 powder, NaOH, and distilled water was treated with ultrasonication for 30 min, followed by treatment at 150 °C in a Teflon-lined autoclave for 48 h.53 After treatment, the sample was treated with a 0.1 M HCl solution and dried at 100 °C for 12 h. The dried sample was annealed further at 300 and 400 °C for 3 h. XRD pattern of peaks in the as-prepared samples at 150 °C matched well with anatase TiO2 and layered H2Ti2O5·H2O.53 H2Ti2O5·H2O is a product of Na2Ti2O5 and has a monoclinic lattice, with parallel kinked layers of edge-sharing TiO6 octahedra. Such layers intercalate alkali metal cations, M+, which can be further ion-exchanged with H+ to produce protonic hydrous titanates, H2Ti2O5·H2O. The reaction is topotactic; hence, the protonic titanates preserve the original layered structure. However, thermal dehydration of protonic titanates leads to TiO2 while the anatase or rutile phase grows, depending on the pretreatment conditions. Wang et al. reported mixed anatase and TiO2(B) nanotubes annealed at 350 °C using 30% rutile and 70% anatase TiO2 in a 60 mL solution of 20 M NaOH (aq.) and ethanol.54 However, Gao et al. reported the conversion of H2Ti3O7nanotubes into anatase TiO2nanotubes at 500 °C in an argon atmosphere, but the product showed a few rods among the tubes.55Anatase nanotubes showed first cycle charge and discharge capacities of 305 and 200 mAh g−1, showing coulombic efficiency of 66%, and discharge capacity at a rate of 640 mA g−1 was 170 mAh g−1 and shows capacity retention of 118 mAh g−1 after 100 cycles.
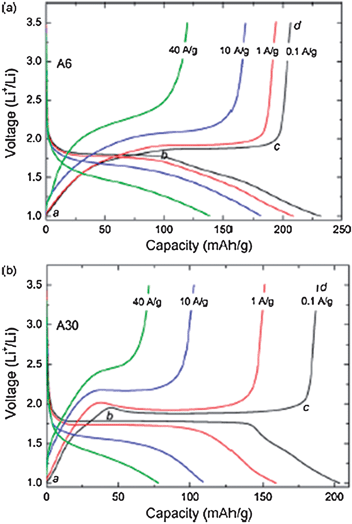
The particle size effect was investigated with three different sizes, 6, 15, 30 nm (BET surface areas were 258, 83, and 57 m2 g−1, respectively). At rates of ∼ 6 and 60 C, the charge capacities were 181 mAh g−1 and 139 mAh g−1 respectively.56 For a given amount of anatase powder, increasing the specific surface area will inevitably increase the proportion of the total number of atoms near or on the surface, which subsequently decreases the available interstitial octahedral sites for Li insertion in the bulk anatase. Since A6 (particle size 6 nm) has the largest specific surface area among all these powders, its larger amount of surface atoms reduces the octahedral sites for Li insertion, so shortens the biphasic region on the discharge curve (plateau). As seen in Fig. 7, Cab of A6 is much higher than that of A30, which is consistent with its larger specific surface area.
 | ||
| Fig. 7 Rate capabilities of anatase TiO2 with particle sizes of 6 nm (A6) and 30 nm (A30). Reproduced with permission.56 | ||
Despite that, Cab of both electrodes only decreases slightly with increasing current density, indicating that the capacity contributed by the surface Li-ion storage is very stable and almost does not change with current density. This indicates that surface Li-ion storage depends only on surface area and not on diffusion time.56 On the contrary, Li insertion/extraction into/from the bulk anatase is highly dependent on diffusion time since it is a solid-state diffusion process. This result indicates that the Li insertion/extraction only occurs in the outer layers of the particles at a high current rate due to the very short diffusion time. Because of the shorter Li diffusion length, most of the interstitial octahedral sites are still available for Li insertion in a very short time, therefore, A6 shows a much slower decrease of Cbc with the current density. This result demonstrates that, aside from increasing the specific surface area, reducing the Li diffusion length of the electrode materials is important also to facilitate Li insertion/extraction and to improve the high rate performance.
Song et al. reported hollow anatase TiO2 microspheres from a template-free method based on the mechanism of Oswald ripening, differential diffusion (Kirkendall effect).57 Compared with a similar previous attempt which also made use of Oswald ripening, their method is reported to be a one-pot template-free method without hazardous organic solvents. They prepared hollow TiO2 at 180 °C from a reaction of Ti(SO4)2 and NH4F. Its first discharge and charge capacities were ∼295 and ∼200 mAh g−1, respectively, showing coulombic efficiency of 68%. However, it showed rapid capacity fading, and after 20 cycles, the capacity retention decreased to 10%. Although this material showed improved cycling stability up to 20 cycles, thereafter it showed similar capacity retention as the bulk phase. This result may indicate that micron-size TiO2 is not effective in reducing the lattice strains induced by repetitive cycles. There are also reports of the effects of the synthesis method on electrochemical properties. Anatase–TiO2nanowires were prepared by 10 M NaOH and 110 °C for 24 h in an autoclave, and neutralized with 0.1 mL HNO3 and annealed at 400 °C for 4 h. The charge capacity was 239 mAh g−1 with a coulombic efficiency of 82% and 98% retention after 20 cycles at a rate of 36 mA g−1.58Anatase–TiO2nanorods from rutile powder were prepared by using 10 M NaOH and autoclave at 180 °C, followed by rinsing with HCl. In this case, titanate TiO2·nH2O nanotubes and nanorods were obtained at 150 °C and 180 °C respectively. Upon firing at 500 °C, the nanotubes turned into anatse–TiO2nanorods, and they showed discharge capacities of ∼250 mAh g−1 and ∼175 mAh g−1.59 TiO2–CdSO4 composite template was prepared by air-calcining Ti–Cd precursors, and after treatment with dilute aqueous acid solution to remove CdSO4, anatase–TiO2 was left behind. The product had large scale uniform spherical particles with an average diameter of 300 nm and exhibited BET surface area of 131 m2 g−1 with various sizes of mesopores.60 First discharge and charge capacities were 325 mAh g−1 and 210 mAh g−1 (Li0.63TiO2), respectively. They reported that the sloped region at the beginning may be due to Li storage in the surface region of the material.
2.3. TiO2(B)
The framework of the idealized TiO2(B) structure (Fig. 8) is a shear derivative of ReO3. The molecular sheets of corner sharing (ReO3 blocks) and edge-sharing octahedral layers are connected to each other by edge-sharing octahedra, resulting in a three-dimensional framework. When shifted by half of the unit cell length in the [100] direction, [21] TiO2(B) shows a system of one-dimensional infinite channels in molecular sheets which follow the [001] direction. In these channels where lithium ions can be inserted the lithium ions are expected to be very mobile.39 The maximum insertion amount of lithium ion in TiO2(B) is about 0.85 Li per Ti at 25 °C. TiO2(B) is the least dense polymorph of TiO2, and has a theoretical capacity of 335 mAh g−1. which makes it a superior intercalation host for lithium compared with rutile and anatase.61 It was demonstrated that bulk layered protonated titanates could be transformed to a metastable monoclinic modification of TiO2 (TiO2(B)) under annealing. This modification of TiO2 has lower density than anatase or rutile and a monoclinic unit cell. The structure of TiO2(B) is characterized by a combination of edge- and corner-sharing TiO6 octahedra forming a structure with channels in which transport and exchange of small cations can occur. Density ranges from 3.64 and 3.76 g cm−3, which are smaller than the densities of anatase and rutile (3.9 and 4.25 g cm−3).39 | ||
| Fig. 8 Structure of TiO2(B). | ||
Although the TiO2(B) nanotube and nanowire are white and insulating, they can act as a n-type semiconductor due to the reduction of the Ti4+ centers.62,63 TiO2(B) was prepared by adding TiO2–anatase to 10 M aq. NaOH, and hydrothermally treated at 170 °C for 72 h. The product was acid-washed, which involved stirring the sample in 0.05M HCl solution for 2 h. After that it was fired at 400 °C in air. The as-synthesized TiO2(B) nanowires had typical diameters of 20–40 nm and lengths of 2–10 µm.62,63 The TiO2(B) nanotubes could intercalate Li ions up to a capacity of 305 mAh g−1 (Li0.91TiO2). The reversibility after the 1st cycle was 99.8% (irreversible capacity was 33%) (Fig. 9). Previously reported data on TiO2(B) nanowires and bulk TiO2 are also included for comparison. Up to discharge capacity of 338 mAh g−1 could be inserted into the nanotubes corresponding to the composition of Li1.01TiO2(B), this is greater than the wires. This capacity is greater than that of the nanowires. Because the crystal structure is the same in all cases, such differences are related to the different particle dimensions and surface areas of the bulk (20 m2 g−1), nanowire (36 m2 g−1) and nanotube (190 m2 g−1) materials. Particles with higher surface areas are likely to result in electrodes with higher electrode/electrolyte contact areas. Coupled with the shorter diffusion paths within the smaller particles, this will lead to more facile intercalation in the order, tubes > wires > bulk material. Reduced strain of intercalation and contributions from charge storage at the surface may also contribute to increased Li capacity, especially in the case of tubes which exhibit the highest surface area as well as wall thicknesses for intercalation of only 25–30 Å.62,63
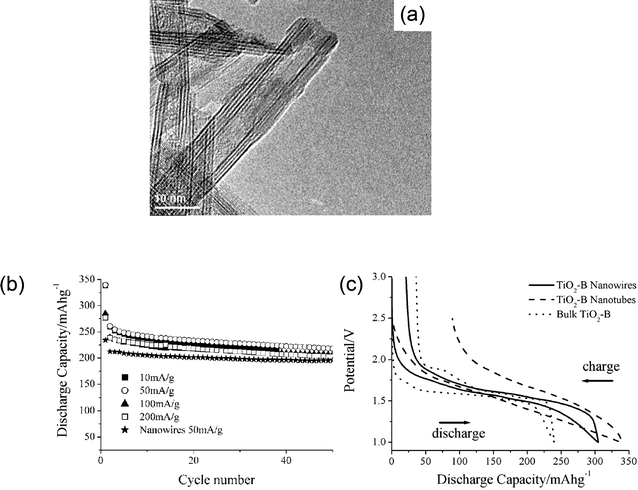 | ||
| Fig. 9 (a) TEM image of TiO2(B) nanotube, (b) rate capability of TiO2(B) nanotube (also, its cycle life performance is compared with TiO2nanowires), and (c) voltage profiles of TiO2(B) nanotube, nanowires, and bulk. Reproduced with permission.62,63 | ||
2.4. Coating
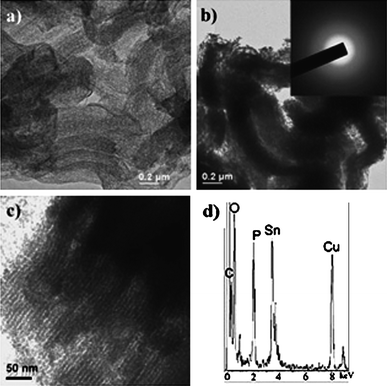
A TiO2host for Li-ion intercalation has intrinsically low electronic conductivity. Therefore, enhancement of electronic conductivity for the host TiO2 material is also required to decrease the polarization. While conducting additives such as carbon black can be mechanically blended with the host material in Li-ion battery electrodes, a larger amount of conducting additives is required to obtain the desirable electronic conductivity. In general, over 10 wt% of carbon black is used in order to maintain a high rate performance. In this regard, several improvements have been made. Moriguchi et al. reported the preparation of single-walled carbon nanotube (SWNT)-containing mesoporous TiO2 using a dispersed aqueous solution of cut SWNTs (c-SWNTs) as the water phase in a water/surfactant/oil ternary bicontinuous microemulsion system.64 Although conducting additives, such as acetylene black can be mechanically mixed with the host material in conventional Li battery electrodes, it is difficult to mix such large-sized conducting additives with mesoporous host materials because the wall of the mesoporous structure is easily destroyed by conventional mixing techniques. In this regard, the methodology is to contribute to the development of high-power charging-discharging devices by providing effective paths for both ion transport and electronic conduction in electrode materials. Hence, the composite demonstrated >15% improved rate capability at a 40 C rate, compared to pristine, unmodified TiO2.The Maier group reported the preparation of metal@TiO2 core–shell structures: mesoporous TiO2 spheres were mixed with 0.1 M RuCl3 solution followed by heat treatment at 450 °C in O2 so that the final RuO2 content was 5 wt%.65TEM imaging showed that the 10 nm RuO2 particles formed a 3D interconnected network over a portion of the inner surface of the mesoporous walls, which connect the carbon network on the microscale. Compared with mesoporous TiO2 which has discharge capacity of <10 mAh g−1 at the 30 C rate, the RuO2/TiO2 composite shows ∼90 mAh g−1. In another development, Cho et al. reported the uniform coating of metallic Sn on TiO2nanotubes to increase the power density of the TiO2electrode material.66 A thin Sn coating layer is expected to facilitate fast and stable Li-ion pathways; thereby allowing smaller amounts of conducting carbon to be used for the desired electrochemical performance.
Fig. 10 shows the TEM images of TiO2nanotubes prepared at 150 °C and the core–shell TiO2@Sn nanotubes. After coating with Sn, the surface morphology of TiO2nanotubes appears to change completely. The lattice fringes of the (200) plane correspond well with the d spacing of 2.91 Å of the tetragonal metallic Sn phase. As can be seen in the TEM image of an isolated nanotube, the tube diameter increases from 8.5 nm to 12 nm after Sn coating, implying that the Sn coating thickness is approximately 1.75 nm. The TiO2@Sn electrode used only 5 wt% of carbon black, which is smaller than the mount of carbon additive required for utilizing bare TiO2nanotubes described above as well as in earlier reports. The electrode density in this case increased to 1.8 g cc−1. The first charge and discharge capacities were 222 and 199 mAh g−1 respectively. The columbic efficiency of 90%, is a 40% improvement over that of the bare TiO2nanotubes.66 Due to the low electronic conductivity of TiO2, many studies have utilized large amounts (over 15 wt%) of conducting carbon black; with resultant decrease in the electrode density of the cell. However, Sn shells have an electronic conductivity in the order of ∼106 S cm−1, which is higher than carbon black (∼102 S cm−1), and surface charge transfer reactions can be enhanced by the metallic Sn shell even with only 5 wt% of carbon black. Furthermore, Sn is only reactive below 1 V, and hence does not contribute to the measured capacity between 2.5 and 1 V. That is, the presence of Sn was just to enhance the electronic conductivity of the TiO2electrode material. The discharge capacity retention levels at 10 and 20 C rates were 183 and 176 mAh g−1, respectively, which correspond to volumetric energy densities of 329 (183 × 1.8 g cc−1) and 317 mAh cc−1 (183 × 1.8 g cc−1), respectively. This value is improved by 3.5 times over the original value, compared to that of the bare TiO2nanotubes.
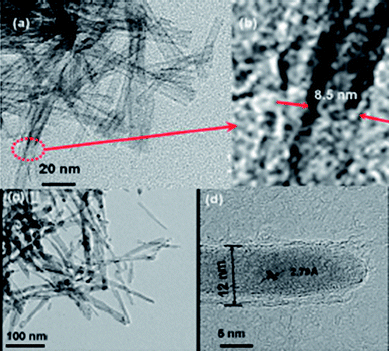 | ||
| Fig. 10 TEM images of (a) TiO2nanotubes prepared at 150 °C and (b) high resolution image of (a), TEM images of (c) TiO2@Sn core–shell nanotubes, and (d) high resolution image of (c). Reproduced with permission.66 | ||
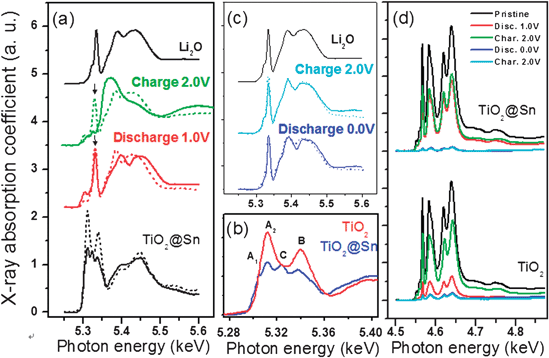
Fig. 11 shows O K-edge and Ti LII,III-edge near edge X-ray absorption fine structure (NEXAFS) of the TiO2 and TiO2@Sn nanotubes during the first cycle in different voltage regions. The NEXAFS does not show the bulk structure of the absorbing material as the penetration depth of the soft X-ray is ∼ several nanometers from the surface. Therefore, the NEXAFS can provide information concerning variations of the chemical composition in the nanotube surface region during the electrochemical Li-ion reaction. The bare TiO2nanotubes typically show two well-separated peaks (peaks A2 and B) in the pre-edge region, which correspond to electric dipole-allowed transitions into hole states (2p![[L with combining low line]](https://www.rsc.org/images/entities/i_char_004c_0332.gif) ) in oxygen 2p orbitals (Ti t2g–O 2p and Ti eg–O 2p, respectively) hybridized with 3d orbitals under TiO6 octahedral symmetry. The broad higher energy peaks above 535 eV can be assigned to transitions to hybridized states of oxygen 2p and Ti 4sp orbitals. For the TiO2@Sn, on the other hand, Sn-coating leads to new peaks A1 and C, which correspond to the pre-edge peaks of the oxygen ions preferentially coordinated to Ti and Sn atoms for rutile-like Sn–Ti–O mixed phase, respectively.67 The existence of the rutile-type Ti–Sn–O phase is in a good agreement with the Ti K-edge EXAFS results.
) in oxygen 2p orbitals (Ti t2g–O 2p and Ti eg–O 2p, respectively) hybridized with 3d orbitals under TiO6 octahedral symmetry. The broad higher energy peaks above 535 eV can be assigned to transitions to hybridized states of oxygen 2p and Ti 4sp orbitals. For the TiO2@Sn, on the other hand, Sn-coating leads to new peaks A1 and C, which correspond to the pre-edge peaks of the oxygen ions preferentially coordinated to Ti and Sn atoms for rutile-like Sn–Ti–O mixed phase, respectively.67 The existence of the rutile-type Ti–Sn–O phase is in a good agreement with the Ti K-edge EXAFS results.
 | ||
| Fig. 11 (a) Oxygen K-edge and (d) Ti LII, III-edge NEXAFS spectral variations of TiO2 (dashed line) and TiO2@Sn (solid line) nanotubes during the two different electrochemical reactions in the voltage regions of (a) 2.0 − 1.0 V and (b) 2.0 − 0.0 V. For clarity, magnified pre-edge peak features of the pristine TiO2 and TiO2@Sn nanotubes are presented (b) in the figure.66b | ||
Upon discharging to 1.0 V, the overall pre-edge peak intensities of TiO2 and TiO2@Sn nanotubes decrease abruptly and a sharp peak feature is formed at 5.34 keV (denoted by↓). The decrease of the pre-edge peak intensity implies a decrease of the hole state in the oxygen 2p band; specifically, a greater reduction of bond covalency in Ti–O bonding pair occurs due to chemical reduction of the oxygen ion from O−2+δ to the O−2 state, where the δ value is the degree of hole state in the oxygen 2p orbital and is proportional to the covalent bonding character. Additionally, the new peak at 534 eV is very similar to the feature of a reference Li2O phase, which is believed to be associated with formation of an electrochemically inactive Li2O phase on the highly active TiO2nanotube surfaces. Therefore, Li-ion insertion into the TiO2nanotubes give rise to local bond cleavage of Ti–O bonding and the formation of oxygen vacancies on the nanotube surface. The inserted Li-ions can be chemically bonded with the oxygen generated from the TiO2nanotubes. For the TiO2@Sn nanotubes, however, the pre-edge peak feature characteristics of the TiO6 environment is still detectable at discharge to 1.0 V, compared to the bare TiO2nanotubes. Conversion reactions involving Li2O have also been reported in 3d transition metal oxide systems, such as CoO, FeO and CuO which can be reversibly reduced and oxidized together with the formation and destruction of lithium oxide respectively:19MIIO + 2Li+ + 2e− ↔ Li2O + M0
It is believed that the metallic Sn/rutile-type Sn–Ti–O outer bilayer prevents Ti–O bonding in the inner shell from being pulverized and following the generation of the Li2O phase on the nanotube surface during the charge. The deduction is also corroborated by the Ti L-edge NEXAFS spectra (Fig. 10d). The peak intensity after discharging to 1.0 V is relatively constant in TiO2@Sn nanotubes, while an abrupt decrease of peak intensity was observed in bare TiO2nanotubes. This can be explained by the fact that the Sn-coating layer could uptake the inserted Li-ion in preference to the inner TiO2nanotubes and so inhibits the formation of the Li2O phase in the inner part of the TiO2nanotubes. The proposed mechanism is illustrated in Fig. 12.
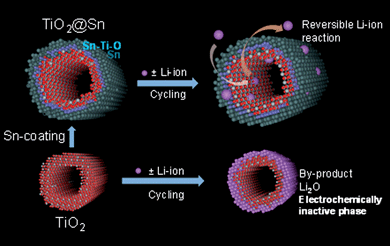 | ||
| Fig. 12 Electrochemical Li-ion behavior of bare TiO2 and TiO2@Sn nanotubes in the voltage region between 2.0 and 1.0 V. | ||
Upon charging to 2.0 V, the TiO2@Sn nanotubes show quite different peak features from bare TiO2. For Li-ion extraction, TiO2@Sn nanotubes revert to characteristics of the TiO2 phase although the peak intensity decreases abruptly, while the peak features of bare TiO2 remain as fixed as those of the Li2O phase. The following inferences can therefore be made: formation of an electrochemically-inactive Li2O phase on the bare TiO2nanotubes intercepts the reversible Li-ion pathway in the charging process. On the other hand, the electrochemically-active Sn/Sn–Ti–O bilayer in the TiO2@Sn nanotube functions as a stable molecular membrane for Li-ion insertion and extraction processes and assists the reversible Li-ion behavior. In consequence, these results are shown in Fig. 12.
Finally, another related titania anode candidate is nanocrystalline lithium titanium oxide (LTO, e.g. Li4Ti5O12) with a spinel structure, where the Li-ion insertion and extraction reactions occur with very little lattice expansion/contraction (“zero strain” property).68 The voltage profile of the LixTi5O12 anode exhibits a very stable flat plateau at 1.55 V, eradicating any possibility of dendritic lithium formation. The material therefore exhibits excellent cyclability and good safety features. However, similar to the TiO2 anodes, the problems of low energy density, poor electronic conductivity and low operating voltage remain.
3. Sn-based materials
3.1. SnO2 nanostructured anode materials
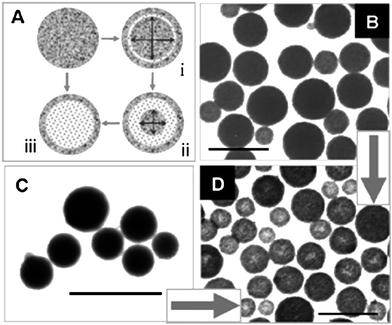
Wide-band semiconducting SnO2 is useful for a diverse range of applications. It is believed that some applications may benefit from a properly designed SnO2nanostructure. For LIBs, SnO2 has been considered as a high capacity anode material since early 1997. However, its high capacity is undermined by poor cyclability in applications that continues to beset the material even up to today. Nanostructured SnO2 has been proposed as a possible solution.28,69–74 Although many SnO2-based anode materials have been synthesized, it is still intellectually stimulating and technologically important to fabricate higher-order nanostructures and to explore their properties in applications, while keeping the methods of preparation relatively simple and scalable. Template-assisted methods, especially those using hard templates, offer the most direct approach to structure control. The formation mechanism of the product is also the easiest to understand. Template-free synthesis methods, when properly designed, can offer scalability and simplicity in implementation, although the product morphology and structure cannot be determined a priori.Template-assisted synthesis is commonly used for the fabrication of high-order nanostructured materials because of its relatively simple principles and fabrication procedures (Fig. 13). There are two operational variations depending on whether active or passive templates are involved. The passive template-assisted methods employ sacrificial templates to help the organization and aggregation of precursor nanoparticles into the desired nanostructures, and then the templates are removed (Fig. 13I). In some cases the nanoparticles could undergo further transformations (e.g.sintering, oxidization) during the template removal process (e.g. by calcination) to form products with the desired chemistry and structure (Fig. 13II). The template removal process is often aggressive, and can inflict a certain amount of damage to the organized high-order nanostructures. In the active template-assisted methods, the template and the dispersed nanoparticles are formed together in-situ. The template removal process is constructive as it helps to shape the product morphology, including the creation of an interior structure under the right conditions (Fig. 13III). These procedures may be run in combination or recursively to produce products with the desired morphology and application properties.28,70
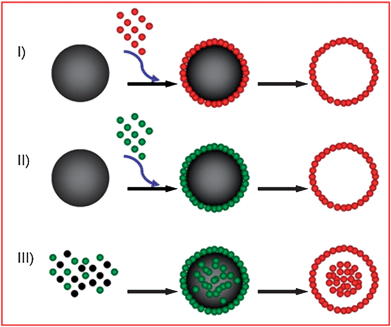 | ||
| Fig. 13 Illustration of template-assisted methods in the fabrication of hollow SnO2nanostructures. NB spheres are used as the template geometry in the illustration but the principle may also be applied to other geometries such as tubes, rods, cubes and pyramids. | ||
3.2. Active template-assisted fabrication
An active template-assisted method was used for the fabrication of SnO2nanoparticle aggregates with an unique mesoscale hollow core–shell structure for LIB applications.28 In this method, carbon mesospheres dispersed with crystalline SnO2nanoparticles were formed as the sole product of a solvothermal procedure using glucose and SnCl4 in a water/ethanol mixture as the starting materials. The carbonization of glucose and the hydrolysis of SnCl4 occurred simultaneously under solvothermal conditions to form the carbon mesospheres with dispersed SnO2nanoparticlesin-situ (Fig. 14f). Subsequent calcination compressed the SnO2nanoparticles into stable hollow core–shell mesospheres (Fig. 14a–e). Here the carbon mesospheres from the solvothermal carbonization of glucose played a constructive role in templating the final SnO2 morphology during the carbon removal by calcination. This method of preparation is simple, low cost, and can be conveniently scaled up for volume production.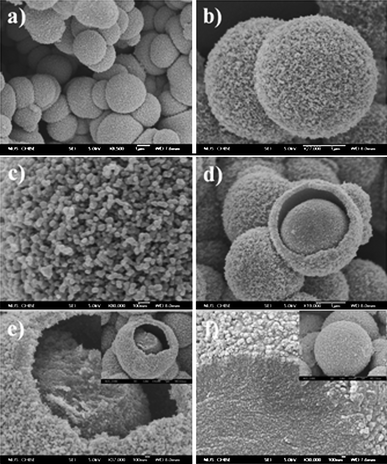 | ||
| Fig. 14 FESEM images: (a–b) hollow core–shell mesospheres of crystalline SnO2nanoparticle aggregates; (c) zoomed-in view of the surface of a SnO2 mesosphere; (d) a SnO2 mesosphere with broken shell; (e) another partially broken mesosphere showing the core and shell made up of the nanoparticle aggregates; the inset is the corresponding low-magnification view; (f) zoomed-in and zoomed-out (inset) views of the solvothermal product of carbon mesospheres with dispersed SnO2nanoparticle precursor before calcination. Reproduced with permission.28 | ||
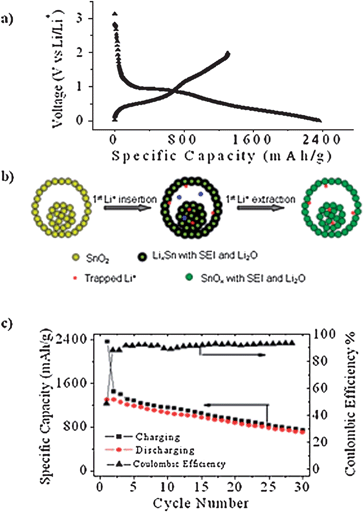
The hollow core–shell mesospheres of crystalline SnO2nanoparticle aggregates showed very high first cycle charge (lithiation) and discharge (de-lithiation) capacities of 2358 and 1303 mAh g−1 respectively (Fig. 15a). The exceptionally high first cycle charge capacity was attributed to solid electrolyte interphase (SEI) formation and the reduction of SnO2 to Sn (eqn 1). In addition the microscopic voids in the cores and shells of the mesospheres were also facilities for Li+ storage. The Li+ stored in these locations were however more difficult to extract, accounting for the large discrepancy between the charge and discharge capacities (Fig. 15b). The cycling test of SnO2 mesospheres showed notable capacity fading. However, the extent of which was not as high as in the case of discrete SnO2nanoparticles. Examination of the electrode after cycling revealed partial retention of the mesosphere morphology.
 | ||
| Fig. 15 (a) First cycle charge/discharge curves. (b) Schematic showing the processes occurring in the first cycle Li+ insertion and extraction reactions. (c) Specific capacity vs. cycle number plots of electrodes prepared from the hollow core–shell mesospheres of crystalline SnO2nanoparticle aggregates. Reproduced with permission.28 | ||
3.3. Passive template-assisted fabrication
One-dimensional SnO2nanotubes were prepared by a passive template-assisted method using an anodic alumina oxide (AAO) membrane as the hard template.73 Commercially available SnO2nanoparticles were infiltrated into the membrane channels and calcined to a dense packaging of SnO2nanoparticles on the walls of the AAO membrane. Subsequently the AAO template was removed by NaOH. The as-synthesized SnO2nanotubes were uniform in diameter, polycrystalline with SnO2nanoparticles as the basic building blocks (Fig. 16). The SnO2nanotubes showed substantial improvements in electrochemical performance over unorganized nanoparticles. The organization of the SnO2nanoparticle into a tubular structure was found to withstand the stress induced by repeated charge and discharge reactions, better possibly through the ability to expand and contract concentrically. In contrast, primary SnO2nanoparticles without any organization would pulverize severely and lose electrochemical activity over cycling for the same period of time. The specific capacity was 525 mAh g−1 at the end of the 80th cycle (Fig. 16).73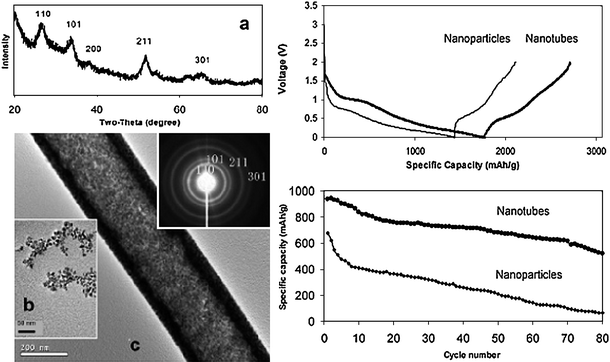 | ||
| Fig. 16 The microstructure and electrochemical performance of the SnO2nanotubes prepared by AAO template-assisted infiltration method. Reproduced with permission.73 | ||
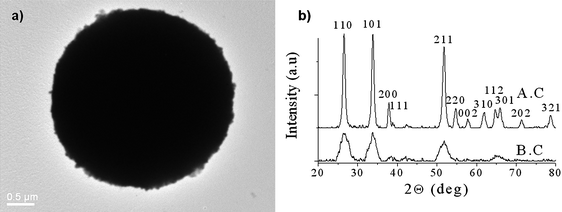
In some cases the hard template may not induce the formation of the product directly because of incompatibility issues with the starting materials or the template removal procedure may completely destroy the product. Under these situations the use of two or more sacrificial templates is necessary. The fabrication of polycrystalline hollow SnO2 spheres serves as a good example (Fig. 17a).74 Here the SnO2 hollows spheres could not be formed on the primary template of silica spheres since the removal of the latter by HF would also remove SnO2. To circumvent this, a secondary template of hollow carbon spheres was fabricated from the primary silica template. Carbon was coated on the silica spheres by chemical vapor deposition (CVD) using benzene as the carbon source at high temperatures. The silica templates were then removed by the HF treatment. SnO2nanoparticles (1–3 nm) were then deposited on both the external and internal surfaces of the hollow carbon spheres through infiltration. Calcination in air at 800 °C removed the hollow carbon spheres and compacted the SnO2nanoparticles into polycrystalline SnO2 hollow spheres (Fig. 17b). This method of preparation of hollow spheres may be extended to other materials. It was found that the polycrystalline SnO2 hollow spheres prepared in this way still experienced significant capacity fading. On the other hand, the intermediate SnO2nanoparticle-loaded hollow carbon spheres sintered at moderate temperatures showed much better cyclability,71 hinting that a compositing approach may be a more viable option for ameliorating the capacity fading problem of Sn.
 | ||
| Fig. 17 (a) A two-step passive template-assisted method to fabricate the desired hollow nanostructure. (b) FESEM images (from left to right) of silica sphere template, hollow carbon spheres, SnO2nanoparticle-loaded hollow carbon spheres, and polycrystalline SnO2 hollow spheres. (b) Reproduced with permission.71 | ||
Other mesoporous SnO2 morphologies are also obtainable using hard templates which are mesoporous in nature,75 for example cubic KIT-6 and hexagonal SBA-15 silica. The preparation involved two cycles of impregnation with SnCl4 precursor and drying. After calcination, the silica template was removed by treatment in dilute NaOH. The as-synthesized mesoporous SnO2 showed very desirable electrochemical performance (Fig. 18), which was attributed to the regular porosity which enabled thorough flooding of the electrolyte, and voidage in the mesopores for buffering volume expansion.75
 | ||
| Fig. 18 TEM images of as-prepared mesoporous SnO2 (left) and the electrochemical performance of the mesoporous SnO2 (right). Reproduced with permission.75 | ||
3.4. Template-free fabrication
Template-free fabrication can be an alternative to the preponderance of template-assisted methods. By comparison template-free synthesis is relatively simple and scalable. Recently a molten salt synthesis was used to fabricate SnO2nanorods.76 In this method, metallic tin nanoparticles were first formed by the chemical reduction of SnCl4 in aqueous solution in the presence of a strong complexing ligand, 1,10-phenanthroline. The tin nanoparticles were then mixed with NaCl and KCl, and calcined in air at 700 °C. The resultant SnO2nanorods were about 15 nm in diameter with high aspect ratios ranging from 50–100 (Fig. 19). The one-dimensional SnO2nanorods with high aspect ratios could present advantages for enhanced Li+ diffusion and extra storage of Li+ ions in the space between stacks of nanorods. A more popular route to template-free synthesis of SnO2nanostructures is hydrothermal synthesis. A notably simple fabrication procedure was reported recently.72 In this procedure the hydrothermal treatment of potassium stannate trihydrate with the chemical addition of urea in a formulated water–ethanol mixture can lead to the formation of hollow or core–shell SnO2 spherical nanostructures; depending on the experimental conditions (Fig. 20).72 Template-free formation of hollow nanostructures was rationalized by Ostwald ripening. This method of preparation of SnO2nanostructure is simple and scalable. Electrochemical tests indicated highly improved Li+ ions storage properties which could be attributed to the unique hollow nanostructure.72 | ||
| Fig. 19 SnO2nanorods from molten-salt synthesis and calcination in air and their cycling performance. Reproduced with permission.76 | ||
 | ||
| Fig. 20 TEM images of SnO2nanostructures obtained by hydrothermal treatment of stannate with chemical addition of urea. SnO2 spheres prepared from the hydrothermal treatment of stannate with the chemical addition of urea: (a) Schematic illustration of the proposed inside-out ripening mechanism. Typical TEM image of (b) SnO2 nanospheres obtained with 6 h of reaction at 150 °C, and (c) amorphous SnO2 nanospheres obtained by ageing. (d) Typical TEM image of hollow SnO2 nanospheres prepared from the SnO2 nanospheres in (b) or (c). All scale bars are 500 nm. Reproduced with permission.72 | ||
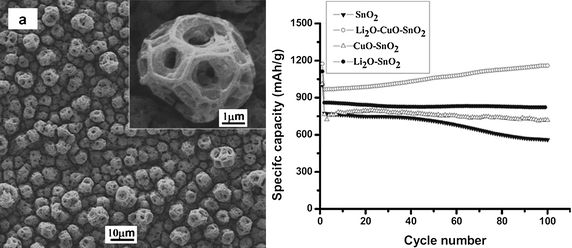
Another interesting SnO2-based anode material is electrospray deposited thin films of particles with a unique porous spherical multideck-cage morphology (Fig. 21a).77 Besides morphology, the authors were also able to vary the composition of the deposited thin films from SnO2 to Li2O–SnO2, CuO–SnO2 and Li2O–CuO–SnO2. All of the as-prepared thin film electrodes showed good electrochemical performance, especially for the Li2O–CuO–SnO2 film. Reversible capacity was reported to be as high as 1158 mAh g−1 (Fig. 21b). The improved electrochemical performance was attributed to the unique structure and the presence of Li2O and CuO phases in the composite film.77 However, there are issues of high cost and scalability for production since film thickness is limited to 10–15 µm. The above examples illustrate that a high-order SnO2nanostructure could be used to deliver a higher level of performance because of morphologically-enhanced properties, and reversibility. However, the first cycle capacity loss due to the reduction of SnO2 to Sn and SEI formation remains significant. In addition, capacity fading is still prominent in most SnO2 nanostructured materials. Morphology aside, there is also an upper limit on the size of a particular SnO2nanostructure to show promising performance.78 The current morphological modifications and size control methodologies have rectified some, but not all of the SnO2 deficiencies in applications.
 | ||
| Fig. 21 SEM images of the as-deposited film of nanostructured SnO2 on copper current collector (a). Specific capacity vs. cycle number plots of Sn-based multideck-cage particles films with different compositions (b). Reproduced with permission.77 | ||
3.5. SnO2/C composite nanostructured anode materials
Instead of using phase-pure SnO2nanostructures, one could form composites of SnO2 and carbon at the nanoscale to leverage upon the high capacity of SnO2 and the good cyclability of carbon. Depending on the quality and quantity of carbon used, the composite could be treated as a dual host storage system for Li+ ions or the presence of carbon is merely to relieve the stress-induced pulverization problem of SnO2. The SnO2/C composites may be prepared by a variety of methods, ranging from simple direct deposition of SnOx nanoparticles on graphite (KS6) surface,79,80 to the in-situ formation of SnO2-laden carbon mesospheres,28 template-assisted fabrications of ordered mesoporous carbon loaded SnO2 composites81 and carbon nanotube (CNT)-encapsulated SnO2.72The CNT-encapsulated SnO2nanotubes warrant a special mention as they represent one of the best efforts so far. They were prepared by treating SnO2nanotubes with CVD of CNTs.70 Polycrystalline SnO2nanotubes with uniform diameter were formed first by the infiltration method described earlier. Subsequent CVD treatment of the SnO2nanotubes in an AAO membrane using acetylene as the carbon source led to the encapsulation of the SnO2nanotubes by a thin layer of CNTs (Fig. 22). The CNT skin provides good electrical contact, and could absorb the reaction-induced stress by using the space in the open tubular structure for free material expansion. This SnO2/C composite nanostructure showed excellent cycling behavior (Fig. 22).70 An SnO2/C composite was also prepared by mixing SnCl2 with phosphorus esters in the presence of ordered mesoporous carbon (CMK-3, prepared from SBA-15 silica template) to deposit tin oxides into the 3-dimensional nanospace of mesoporous carbon. The composite was subsequently aged at 40 °C and then at 900 °C before calcination in air at 500 °C (Fig. 23). The 3-dimensional carbon framework was believed to inhibit aggregation of the tin and hence it improved cycling performance compared with unsupported SnO2nanoparticles.81
 | ||
| Fig. 22 CNT-encapsulated polycrystalline SnO2nanotubes and their cycling performance. Reproduced with permission.70 | ||
 | ||
| Fig. 23 TEM images of CMK-3 mesoporous carbon (a) and ordered nanostructured SnO2/C composite at (b) low and (c) high magnifications. Reproduced with permission.81 | ||
In-situ fabrication of SnO2/C without a template could offer a simple and scalable production of the composite anode materials.28,82–84 Such in-situ fabrication techniques are often based on the carbonization of carbohydrates (e.g.glucose) and the pyrolysis of a tin precursor (e.g.SnCl4) under the high temperature and pressure conditions prevalent in a solvothermal synthesis. It was found that the selection of solvent is crucial for morphology control of the SnO2/C product. For example, the product was random SnO2nanoparticles coated with disordered carbon when the solvent was water or ethylene glycol.28,83,84 On the other hand, ethanol or ethanol–water mixture formed carbon mesospheres with dispersed SnO2nanoparticles (Fig. 24).28,82 Since the carbonization temperature is relatively low in a solvothermal synthesis, only poorly graphitized disordered carbon abundant with active surface groups can be formed. This type of carbon is not suitable for reversible storage of lithium ions.
 | ||
| Fig. 24 TEM images of typical carbon mesopheres loaded with SnO2nanoparticles (∼3.5 nm). (a) XRD patterns of SnO2/C composite mesospheres before calcination (lower) and after calcination in air to remove the carbon (upper). Reproduced with permission.28 | ||
3.6. Sn/C composite nanostructured anode materials
If Sn is used as the Li storage compound, eqn (1) would not occur and the coulombic efficiency should in principle be higher. Metallic Sn also has the highest theoretical storage capacity of any Sn anode (993 vs. 782 mAh g−1 for SnO2). In reality, however, the pulverization problem is aggravated because of the lack of a protective buffering matrix to moderate volume excursion.85,86 The use of Sn may be improved by compositing Sn with carbon at the nanoscale. If properly designed, a Sn/C composite could combine the high specific capacity of Sn with the good cycle life of carbon. At the same time one should however be mindful of the corresponding increase in interfacial passivation leading to permanent loss of usable capacity.87 A prudent material design should therefore provide a good balance of these opposing features. Previous work in our lab, and by others, on nanostructured Sn/C composite anode materials have shown some encouraging results.84,85,88–90 However, the fabrication of nanostructured Sn/C composites by simple and scalable methods poses an even greater challenge. There are four general methods available to prepare a Sn/C composite, namely the deposition of pre-formed Sn nanoparticles on graphite,90 coating of Sn nanoparticles with thin, nanoscale layers of carbon,91,92 the in-situreduction of SnO2 to Sn in carbon94 and template-assisted synthesis.93 A few representative examples of these fabrication techniques are provided.The loading of Sn nanoparticles on carbon is a relatively straightforward procedure. For example, by using SnCl4 as the Sn precursor, 1,10-phenanthroline as the complexation and capping agent, and NaBH4 as the reducing agent, Sn nanoparticles 3.5 and 10 nm in diameter could be prepared in aqueous solution.95 In the presence of carbon (KS-6), the Sn nanoparticles could be deposited selectively on graphite (KS-6) after ultrasonication. It was discovered that with the smaller 3.5 nm Sn nanoparticles a highly reversible lithium ion storage capacity of 415 mAh g−1 was attainable with 10.3 wt% loading of Sn (Fig. 25).95
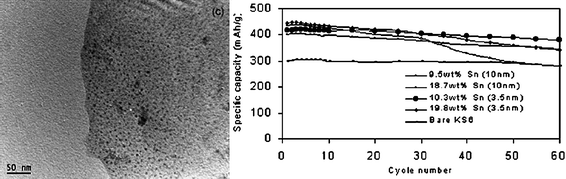 | ||
| Fig. 25 TEM image of an Sn nanoparticle-loaded graphite and cycling performance of the Sn/C composite. Reproduced with permission.95 | ||
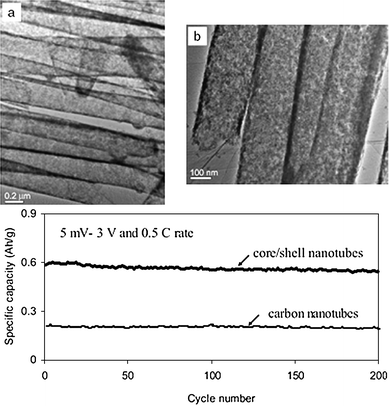
In-situ reduction of SnO2 to Sn in a carbon matrix has also been explored. Here carbon mesospheres containing dispersed SnO2nanoparticles were formed by the concurrent carbonization of glucose and pyrolysis of SnCl4in-situ.28,84 High temperature CVD treatment with an extraneously supplied carbon source was then used to improve the graphitization and reduce encapsulated SnO2 to Sn.28,84 The Sn nanoparticles formed as such were catalytic towards the formation of CNTs on the carbon sphere surface.96,97 The low melting (232 °C) Sn was liquefied under reaction conditions and was siphoned into the interior of the CNTs forming an intriguing hair-like Sn@C core–shell structure on the carbon sphere (which looks like the tropical fruit Rambutan) (Fig. 26).84
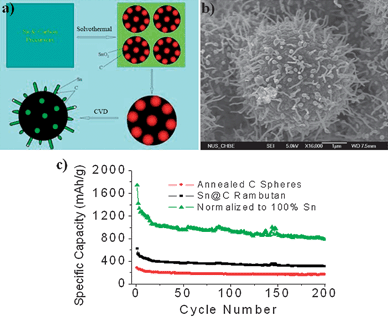 | ||
| Fig. 26 A schematic (a) shows the steps in the preparation of the Rambutan-like Sn@C composite and (b) an FESEM image of a typical nanostructure. Specific capacity vs. cycle number plots of the Rambutan-like Sn@C composite and annealed carbon spheres (c). Reproduced with permission.84 | ||
A closer examination revealed the hierarchical structure of the Sn@C composite consisting of tin-containing carbon mesospheres, carbon nanotubes with completely-filled or partially-filled metallic tin interiors, and carbon encapsulated tin nanospheres (Fig. 26). The formation of the hair-like structure in the Rambutan architecture was rationalized by a modified “base growth” mechanism. The unique Sn@C structure could restrain aggregation of nanosized metallic Sn and the presence of 1-D carbon nanotube “hair-like” structures could enhance electrical connectivity and improve the electrical integration of the active materials. The improved electrochemical performance of tin in the nanocomposite could be attributed to this unique morphology.84
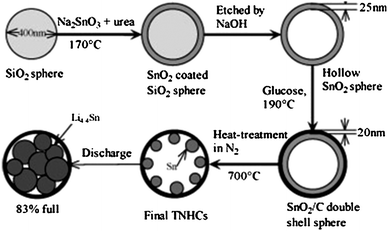
The template-assisted technique (hard and soft) can be combined with the carbon thermal reduction reaction to fabricate Sn@C nanocomposites.93,94 This is shown in Fig. 27 using a hard template.93 In this method, SiO2 spheres were used to template the formation of SnO2 hollow spheres first. A thin layer of carbon was then deposited on the surface of the SnO2 hollow spheres by the carbonization of glucose under hydrothermal conditions. Subsequent calcination of dual-layer SnO2@C hollow spheres in N2 reduced SnO2 to Sn forming an interesting structure of encapsulated Sn nanoparticles in hollow carbon spheres (Fig. 28a) with 74 wt% of Sn loading.93 Since the hollow carbon spheres provide space for volume excursion during LixSn alloying and de-alloying reactions, the Sn@C composite showed high capacity of over 800 mAh g−1 for the first 10 cycles, and a high capacity 550 mAh g−1 after 100 cycles.94 Similar morphology could also be created with a soft template.94 Instead of using SiO2 as the template, micelles of cetyltrimethylammonium bromide (CTAB) were used as the soft template to form resorcinol–formaldehyde (RF) spheres loaded with a Sn precursor (tributylphenyltin). Subsequent in-situcalcination carbonized the RF polymer and formed Sn nanoparticles encapsulated in the hollow carbon spheres (Fig. 28b) with 24 wt% Sn.94
 | ||
| Fig. 27 The fabrication of Sn nanoparticles encapsulated in hollow carbon spheres showing the morphology evolution. Reproduced with permission.93 | ||
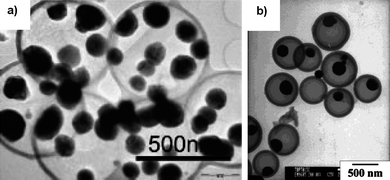 | ||
| Fig. 28 TEM images of Sn nanoparticles encapsulated in hollow carbon spheres obtained by (a) hard and (b) soft template-assisted methods. Reproduced with permission.93,94 | ||
Although the preparation of Sn/C composites has shown a high level of originality and sophistication in recent years, there are still notable problems of large first cycle irreversible capacity loss and capacity fading in the products.84,88,94 It is known that for phase-pure Sn, the cycling behavior is inversely proportional to particle size, with sub-4 nm considered to be the most desirable.88,90 The simple Sn/C composites synthesized so far are limited in their ability to support a high mass loading of small (i.e.<4 nm) Sn nanoparticles. The in-situ formed Sn nanoparticles by high temperature carbon thermal reduction reaction are much larger in size, ranging from a few tens to a few hundreds of nanometers, and with poor graphitization degrees. Even if the Sn nanoparticles could be made sufficiently small initially, subsequent cycling often leads to aggregation into larger Sn particles, which is the bane of capacity fading. Hence the problems of stabilization of Sn nanoparticles in the carbon matrix and preservation of an electrically integrated network have still to be solved.
3.7. Sn–M/C composite nanostructured anode materials
A new strategy that has drawn increasing attention as a cyclability improvement measure has been to introduce Sn as a Sn–M alloy (where M is Sb, Co, Fe, etc) into a carbon matrix. For an intermetallic Sn–M compound, lithiation of the Sn phase to form a Lix<4.4Sn series of compounds would release the metal M to the surrounding environment. An uniform distribution of the electrically conducting M nanoparticles in close proximity to the Sn storage compound could contribute to the sustenance of electrical integration in the anode. At the same time M could also function as an inactive matrix to inhibit aggregation and size increase the Sn phase. While this concept was mooted some years ago,87 it is receiving renewed and increased interest after Sony's recent announcement of new generation LIBs based on Sn–Co–C anode material.20–23,98 The Sn–M/C composites are generally prepared by high energy ball milling.21 Non-conventional approaches such as the formation of Sn–Sb@CNT by in-situCVD,99 and Sn–Ge@C by thermal annealing of butyl-capped Sn78Ge22clusters in vacuum100 are more recent developments. These techniques could potentially lead to easier production of Sn–M/C nanostructures.In this first example, commercial antimony tin oxide nanoparticles were processed under CVD conditions at 700 °C using acetylene as the carbon source. Acetylene was able to reduce the metal oxide into intermetallic compounds which then catalyzed the growth of CNTs by C2H2decomposition. At the same time, capillary forces drew the molten intermetallic into the CNT interior, forming CNT-encapsulated Sn–Sb nanorods (Fig. 29a,b).99 When tested for reversible lithium ion storage, these CNT-encapsulated Sn–Sb nanorods displayed very high specific capacities and good cyclability (Fig. 29c).99 The good electrochemical performance could be attributed to the presence of Sb in a lithium-active Sn phase, CNT-enhanced electrical connectivity and the mechanical integrity of the Sn–Sb nanorods.
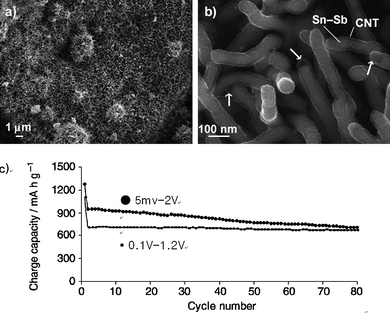 | ||
| Fig. 29 FESEM images of the carbon nanotube encapsulated Sn–Sb nanorods at (a) low and (b) high magnifications and (c) corresponding cycling performance tested in different voltage windows. Reproduced with permission.99 | ||
In the second example, branched Sn–Ge@C core–shell nanowires were prepared by the thermal annealing of butyl-capped Sn78Ge22nanoparticles in vacuum (Fig. 30).100 The resulting one-dimensional composite materials (50–100 nm in diameter and several micrometers in length) displayed an exceptionally high rate capability (93% coulombic efficiency at 8 C rate) as well as excellent capacity retention after prolonged cycling (94% capacity retention after 45 cycles) (Fig. 30). This impressive electrochemical performance was attributed to the morphology and the presence of the carbon shell which suppressed aggregation into larger particles. In fact the 1-D composite nanowires were found to fragment into smaller nanoparticles and nanowires upon cycling instead of aggregating into larger particles as is typical of metallic Sn.47
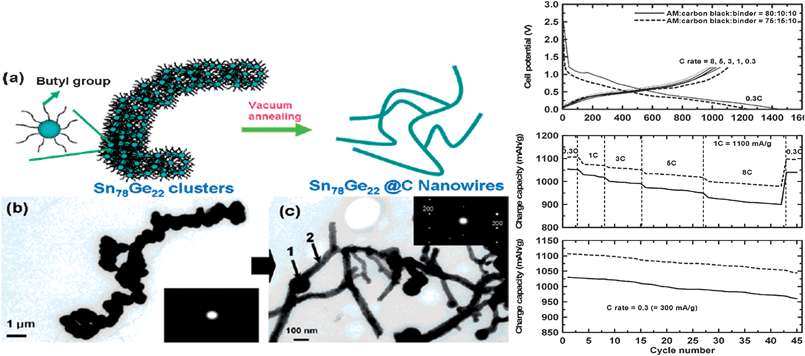 | ||
| Fig. 30 The formation of Sn78Ge22@C nanowires after thermal annealing of the butyl-capped Sn78Ge22nanoparticles clusters in vacuum (left). The electrochemical performance of the Sn78Ge22@C nanowires. Reproduced with permission.100 | ||
There are recent reports of Sn–Si/C anode materials displaying impressively high capacity (2050 mAh g−1) and good capacity retention (97% after 60 cycles).101 Other types of Sn-based anode materials with improved electrochemical performance have also been reported, for example tin phosphate,25,99 SnO2 filled mesoporous tin phosphate,102 teardrop-shaped SnP0.94103 and AlPO4 coated SnO2.104 Hence there are limitless possibilities for finding a carbon-substitute for the anode; the question is to balance the benefits with mutually compensating features and newly found challenges in scalable production.
4. Conclusion and outlook
Nanostructuring an otherwise mundane material such as TiO2 and SnO2 could lead to significant improvements in material performance for reversible Li ion storage. High polarization of bulk TiO2 is believed to result from slow ionic and electronic diffusion in the active material or interfaces, but manipulation of morphology into nanotubes, nanowires or the control of particle size offer versatile strategies toward improving electrochemical properties. Better rate capabilities that are due to the distance over which Li+ and electrons must diffuse in the solid state is dramatically decreased in the nanostructured electrode. Furthermore, the high surface area of the nanostructured TiO2electrode makes the current density more effective than that of a conventional bulk electrode. Moreover, uniform metallic Sn metals coated onto TiO2nanotubes overcome the power density of the TiO2electrode material. A thin Sn coating layer is anticipated to facilitate fast and stable Li-ion pathways and allow a smaller amount of conducting-additive carbon to be used to obtain the desired electrochemical performance. An Sn-coated TiO2nanotube with low carbon black content can be investigated from the viewpoint of improvement to the volumetric density at a high current rate, 4000 mA g−1, compared to that of bare TiO2nanotubes.Many methods of preparation of SnO2 including some which are remarkably scalable, cost-effective and environment friendly have been reported to date. Some of them are more attuned to sculpturing complex architecture and hierarchal structures. Many of the methods rely on the use of templates whether extraneously supplied or synthesized in-situ. In this regard the preparation of hollow core–shell mesospheres of SnO2nanoparticle aggregates is of particular interest because templating carbon mesospheres are formed in-situ by glucose carbonization and removal of the template; instead of being the usually destructive process, it assisted the formation of the nanostructure in this case. Nevertheless there are indications that the application problem of Sn could not be completely resolved by a phase-pure Sn-based anode. Studies on Sn/C composite anode materials are receiving renewed and boosted interest after Sony' recent announcement of a new LIB series based on the Sn–Co–C anode. Nanostructuring of more complex Sn–M–C compounds could be a rewarding undertaking leading to the long-awaited breakthrough in utilizing Li–M alloying and dealloying reactions for reversible storage of Li in Sn.
Overall, cell voltage will depend on the choice of the cathode material. If one uses recently introduced ‘green’ and low-cost LiFePO4 as the cathode (3.4 V vs.Li+/Li), the full cell voltage will be 1.6 V for an anatase–TiO2 anode (∼1.8 V vs.Li+/Li) and 2.9 V for a SnO2 anode (∼0.5 V vs.Li+/Li) respectively. For nanostructured TiO2 anodes, the low full-cell voltage would make the electrodes less reactive towards the electrolyte, resulting in higher electrochemical stability. The freedom from SEI formation on the anode means that Li-ions from the cathode may be used more reversibility without significant first cycle losses. Compared to carbon-based anodes, there will also be less concern for lithium metal deposition, and safety of the full cell is improved as a result. Cyclability is also good. On the other hand, the low cell voltage does result in lower energy density. For Sn-based anodes, although the full-cell voltage will be higher in this case, it will be not as flat because of the lack of extended voltage plateaus in the charge/discharge profiles. The larger changes in the electrode volume during charge/discharge also result in poorer electrochemical stability. Sn-based anode materials are also beset by significant first cycle irreversible capacity losses due to poor SEI quality which consume more Li ions from the cathode.
Acknowledgements
This work was supported by the IT R&D program of MKE/IITA (Core Lithium Secondary Battery Anode Materials for Next Generation Mobile Power Module, 2008-F-019-01). XAS experiments were carried out at Pohang Light Source (PLS). Support from the WCU (world class university) program (MEST) is greatly acknowledged.References
- P. G. Bruce, B. Scrosti and J.-M. Tarascon, Angew. Chem., Int. Ed., 2008, 47, 2930 CrossRef CAS.
- M. Winter and R. J. Brodd, Chem. Rev., 2004, 104, 4245 CrossRef CAS.
- M. Winter, J. O. Besenhard, M. E. Spahr and P. Novak, Adv. Mater., 1998, 10, 725 CrossRef CAS.
- X. Chen and S. S. Mao, Chem. Rev., 2007, 107, 2891 CrossRef CAS.
- T. Kasuga, M. Hiramatsu, A. Hoson, T. Sekino and K. Niihara, Langmuir, 1998, 14, 3160 CrossRef CAS.
- T. Kasuga, M. Hiramatsu, A. Hoson, T. Sekino and K. Niihara, Adv. Mater., 1999, 11, 1307 CrossRef CAS.
- J. H. Pan, X. Zhang, A. J. Du, D. D. Sun and J. O. Leckie, J. Am. Chem. Soc., 2008, 130, 11256 CrossRef CAS.
- G. R. Patzke, F. Krumeich and R. Nesper, Angew. Chem., Int. Ed., 2002, 41, 2446 CrossRef.
- H. Yin, Y. Wada, T. Kitamura, S. Kambe, S. Murasawa, H. Mori, T. Sakata and S. Yanagida, J. Mater. Chem., 2001, 11, 1694 RSC.
- Q. Chen, W. Zhou, G. Du and L.-M. Peng, Adv. Mater., 2002, 14, 1208 CrossRef CAS.
- L. Kavan, M. Kalbáč, M. Zukalová, I. Exnar, V. Lorenzen, R. Nesper and M. Graetzel, Chem. Mater., 2004, 16, 477 CrossRef CAS.
- H. Zhang, G. R. Li, L. P. An, T. Y. Yan, X. P. Gao and H. Y. Zhu, J. Phys. Chem. C, 2007, 111, 6143 CrossRef CAS.
- A. S. Arico, P. Bruce, B. Scrosati, J. M. Tarascon and W. Van Schalkwijk, Nat. Mater., 2005, 4, 366 CrossRef CAS.
- J. M. Tarascon and M. Armand, Nature, 2001, 414, 359 CrossRef CAS.
- K. T. Nam, D. W. Kim, P. J. Yoo, C. Y. Chiang, N. Meethong, P. T. Hammond, Y. M. Chiang and A. M. Belcher, Science, 2006, 312, 885 CrossRef CAS.
- L. Taberna, S. Mitra, P. Poizot, P. Simon and J. M. Tarascon, Nat. Mater., 2006, 5, 567 CrossRef CAS.
- Nippon Denki Shinbun, 1996, March 11, www.shinbun.denki.or.jp/english.
- Y. Idota, T. Kubota, A. Matsufuji, Y. Maekawa and T. Miyasaka, Science, 1997, 276, 1395 CrossRef CAS.
- P. Poizot, S. Laruelle, S. Grugeon, L. Dupont and J. M. Tarascon, Nature, 2000, 407, 496 CrossRef CAS.
- H. Inoue, International Meeting on Lithium Batteries: Abstr. #228, 2006, Biarritz, France Search PubMed.
- J. Hassoun, G. Mulas, S. Panero and B. Scrosati, Electrochem. Commun., 2007, 9, 2075 CrossRef CAS.
- A. D. W. Todd, R. A. Dunlap and J. R. Dahn, J. Alloys Compd., 2007, 443, 114 CrossRef CAS.
- J. R. Dahn, R. E. Mar and A. Abouzeid, J. Electrochem. Soc., 2006, 153, A361 CrossRef CAS.
- N. C. Li, C. R. Martin and B. Scrosati, Electrochem. Solid-State Lett., 2000, 3, 316 CrossRef CAS.
- E. Kim, D. Son, T. G. Kim, J. Cho, B. Park, K. S. Ryu and S. H. Chang, Angew. Chem., Int. Ed., 2004, 43, 5987 CrossRef CAS.
- D. Deng and J. Y. Lee, Chem. Mater., 2007, 19, 4198 CrossRef CAS.
- P. G. Bruce, B. Scrosati and J. M. Tarascon, Angew. Chem., Int. Ed., 2008, 47, 2930 CrossRef CAS.
- D. Deng and J. Y. Lee, Chem. Mater., 2008, 20, 1841 CrossRef CAS.
- M. V. Koudriachova, N. M. Harrison and S. W. Leeuw, Solid State Ionics, 2003, 157, 35 CrossRef CAS.
- M. C. Payne, M. P. Teter, D. C. Allan, T. A. Arias and J. D. Joannapulos, Rev. Mod. Phys., 1992, 64, 1045 CrossRef CAS.
- M. V. Koudriachova, N. M. Harrison and S. W. Leeuw, Phys. Rev. B: Condens. Matter Mater. Phys., 2002, 65, 235423 CrossRef.
- A. Stashans, S. Lunell and R. Bergstroem, Phys. Rev. B, 1996, 53, 159 CrossRef CAS.
- M. V. Koudriachova, N. M. Harrison and S. W. Leeuw, Phys. Rev. Lett., 2001, 86, 1275 CrossRef CAS.
- W. J. Macklin and R. J. Neat, Solid State Ionics, 2003, 157, 35 CrossRef CAS.
- Y.-S. Hu, L. Kienle, Y.-G. Guo and J. Maier, Adv. Mater., 2006, 18, 1421.
- W. J. H. Borghols, M. Wagemaker, U. Lafont, E. M. Kelder and F. M. Mulder, Chem. Mater., 2008, 20, 2949 CrossRef CAS.
- M. Wagemaker, W. J. H. Borghols and F. M. Mulder, J. Am. Chem. Soc., 2007, 129, 4323 CrossRef.
- C. Jiang, I. Honma, T. Kudo and H. Zhou, Electrochem. Solid-State Lett., 2007, 10, A127 CrossRef CAS.
- G. Nuspl, K. Yoshizawa and T. Yamabe, J. Mater. Chem., 1997, 7, 2529 RSC.
- M. Wagemaker, R. Krol, A. P. M. Kentgens, A. A. Well and F. M. Mulder, J. Am. Chem. Soc., 2001, 123, 111454.
- T. Ohzuku, T. Kodama and T. Hirai, J. Power Sources, 1985, 14, 153 CrossRef CAS.
- D. W. Murphy, M. Greenblatt, S. M. Zahurak, R. J. Cava, J. V. Waszczak, G. W. Hull and R. S. Hutton, Rev. Chim. Miner., 1982, 19, 441 CAS.
- G. Sudant, E. Baudrin, D. Larcher and J.-M. Tarascon, J. Mater. Chem., 2005, 15, 1263 RSC.
- S.-J. Bao, Q.-L. Bao, C.-M. Li and Z.-L. Dong, Electrochem. Commun., 2007, 9, 1233 CrossRef CAS.
- H. G. Yang and H. C. Zeng, J. Phys. Chem. B, 2004, 108, 3492 CrossRef CAS.
- J. Li, Z. Tang and Z. Zhang, Electrochem. Solid-State Lett., 2005, 8, A316 CrossRef CAS.
- S.-H. Kang, J. B. Goodenough and L. K. Rabenberg, Electrochem. Solid-State Lett., 2001, 4, A49 CrossRef CAS.
- M. Wei, Y. Konishi, H. Zhou, H. Sugihara and H. Arakawa, Solid State Commun., 2005, 133, 493 CrossRef CAS.
- D. V. Bavykin, J. M. Friedrich and F. C. Walsh, Adv. Mater. (Weinheim, Ger.), 2006, 18, 1.
- Q. Chen, G. H. Du, S. Zhang and L.-M. Peng, Acta Crystallogr., Sect. B: Struct. Sci., 2002, B58, 587 CrossRef CAS.
- T. P. Feist and P. K. Davies, J. Solid State Chem., 1992, 101, 275 CrossRef.
- X. Sun and Y. Li, Chem.–Eur. J., 2003, 9, 2229 CrossRef CAS.
- J.-N. Nian and H. Teng, J. Phys. Chem. B, 2006, 110, 4193 CrossRef CAS.
- Q. Wang, Z. Wen and J. Li, Inorg. Chem., 2006, 45, 6944 CrossRef CAS.
- X. P. Gao, Y. Lan, H. Y. Zhu, J. W. Liu, Y. P. Ge, F. Wu and D. Y. Song, Electrochem. Solid-State Lett., 2005, 8, A26 CrossRef CAS.
- C. Jiang, M. Wei, Z. Qi, T. Kudo, I. Honma and H. Zhou, J. Power Sources, 2007, 166, 239 CrossRef CAS.
- B. Song, S. Liu, J. Jian, M. Lei, X. Wang, H. Li, J. Yu and X. Chen, J. Power Sources, 2008, 180, 869 CrossRef CAS.
- J. Xu, C. Jia, B. Cao and W. F. Zhang, Electrochim. Acta, 2007, 52, 8044 CrossRef CAS.
- Y. Lan, X. Gao, H. Zhu, Z. Zheng, T. Yan, F. Wu, S. P. Ringer and D. Song, Adv. Funct. Mater., 2005, 15, 1310 CrossRef CAS.
- Y.-G. Guo, Y.-S. Hu and J. Maier, Chem. Commun., 2006, 2783 RSC.
- G. Armstrong, A. R. Armstrong, J. Canales and P. G. Bruce, Electrochem. Solid-State Lett., 2006, 9, A139 CrossRef CAS.
- A. R. Armstrong, G. Armstrong, J. Canales and P. G. Bruce, Angew. Chem., Int. Ed., 2004, 43, 2286 CrossRef CAS.
- A. R. Armstrong, G. Armstrong, J. Canales and P. G. Bruce, Adv. Mater., 2005, 17, 862 CrossRef.
- I. Moriguchi, R. Hidaka, H. Yamada, T. Kudo, H. Murakami and N. Nakashima, Adv. Mater., 2006, 18, 69 CrossRef CAS.
- Y.-G. Guo, Y.-S. Hu, W. Sigle and J. Maier, Adv. Mater., 2007, 19, 2087 CrossRef CAS.
- (a) H. Kim, M. G. Kim, T. J. Shin, H.-J. Shin and J. Cho, Electrochem. Commun., 2008, 10, 1669 CrossRef CAS; (b) unpublished work.
- S. O. Kucheyev, T. van Buuren, T. F. Baumann, J. H. Satcher, T. M. Willey, R. W. Meulenberg, T. E. Felter and J. Terminello, J. Phys. Rev. B, 2004, 69, 245102 CrossRef.
- J. Kim and J. Cho, Electrochem. Solid-State Lett., 2007, 10, A81 CrossRef CAS.
- X. W. Lou, C. L. Yuan and L. A. Archer, Adv. Mater., 2007, 19, 3328 CrossRef CAS.
- Y. Wang, H. C. Zeng and J. Y. Lee, Adv. Mater., 2006, 18, 645 CrossRef CAS.
- Y. Wang, F. B. Su, J. Y. Lee and X. S. Zhao, Chem. Mater., 2006, 18, 1347 CrossRef CAS.
- X. W. Lou, Y. Wang, C. L. Yuan, J. Y. Lee and L. A. Archer, Adv. Mater., 2006, 18, 2325 CrossRef CAS.
- Y. Wang, J. Y. Lee and H. C. Zeng, Chem. Mater., 2005, 17, 3899 CrossRef CAS.
- Y. Wang, J. Y. Lee and T. C. Deivaraj, J. Phys. Chem. B, 2004, 108, 13589 CrossRef CAS.
- H. Kim and J. Cho, J. Mater. Chem., 2008, 18, 771 RSC.
- Y. Wang and J. Y. Lee, J. Phys. Chem. B, 2004, 108, 17832 CrossRef CAS.
- Y. Yu, C. H. Chen and Y. Shi, Adv. Mater., 2007, 19, 993 CrossRef CAS.
- C. Kim, M. Noh, M. Choi, J. Cho and B. Park, Chem. Mater., 2005, 17, 3297 CrossRef CAS.
- Y. Wang and J. Y. Lee, J. Power Sources, 2005, 144, 220 CrossRef CAS.
- J. Y. Lee, R. F. Zhang and Z. L. Liu, Electrochem. Solid-State Lett., 2000, 3, 167 CAS.
- J. Fan, T. Wang, C. Z. Yu, B. Tu, Z. Y. Jiang and D. Y. Zhao, Adv. Mater., 2004, 16, 1432 CrossRef CAS.
- H. Qiao, Z. Zheng, L. Z. Zhang and L. F. Xiao, J. Mater. Sci., 2008, 43, 2778 CrossRef CAS.
- T. Moon, C. Kim, S. T. Hwang and B. Park, Electrochem. Solid-State Lett., 2006, 9, A408 CrossRef CAS.
- D. Deng and J. Y. Lee, Angew. Chem., Int. Ed., 2009, 48, 1660 CrossRef CAS.
- J. Hassoun, G. Derrien, S. Panero and B. Scrosati, Adv. Mater., 2008, 20, 3169 CrossRef CAS.
- G. Derrien, J. Hassoun, S. Panero and B. Scrosati, Adv. Mater., 2007, 19, 2336 CrossRef CAS.
- M. Winter and J. O. Besenhard, Electrochim. Acta, 1999, 45, 31 CrossRef CAS.
- W. M. Zhang, J. S. Hu, Y. G. Guo, S. F. Zheng, L. S. Zhong, W. G. Song and L. J. Wan, Adv. Mater., 2008, 20, 1160 CrossRef CAS.
- K. T. Lee, Y. S. Jung and S. M. Oh, J. Am. Chem. Soc., 2003, 125, 5652 CrossRef CAS.
- Y. Wang, J. Y. Lee and T. C. Deivaraj, J. Electrochem. Soc., 2004, 151, A1804 CrossRef CAS.
- M. Noh, Y. Kwon, H. Lee, J. Cho, Y. Kim and M. G. Kim, Chem. Mater., 2005, 17, 1926 CrossRef CAS.
- M. Noh, Y. Kim, M. G. Kim, H. Lee, H. Kim, Y. Kwon, Y. Lee and J. Cho, Chem. Mater., 2005, 17, 3320 CrossRef CAS.
- W. M. Zhang, J. S. Hu, Y. G. Guo, S. F. Zheng, L. S. Zhong, W. G. Song and L. J. Wan, Adv. Mater., 2008, 20, 1160 CrossRef CAS.
- K. T. Lee, Y. S. Jung and S. M. Oh, J. Am. Chem. Soc., 2003, 125, 5652 CrossRef CAS.
- Y. Wang, J. Y. Lee and T. C. Deivaraj, J. Electrochem. Soc., 2004, 151, A1804 CrossRef CAS.
- R. Y. Li, X. C. Sun, X. R. Zhou, M. Cai and X. L. Sun, J. Phys. Chem. C, 2007, 111, 9130 CrossRef CAS.
- L. Jankovic, D. Gournis, P. N. Trikalitis, I. Arfaoui, T. Cren, P. Rudolf, M. H. Sage, T. T. M. Palstra, B. Kooi, J. De Hosson, M. A. Karakassides, K. Dimos, A. Moukarika and T. Bakas, Nano Lett., 2006, 6, 1131 CrossRef CAS.
- H. Kim and J. Cho, Electrochim. Acta, 2007, 52, 4197 CrossRef CAS.
- Y. Wang and J. Y. Lee, Angew. Chem., Int. Ed., 2006, 45, 7039 CrossRef CAS.
- H. Lee and J. Cho, Nano Lett., 2007, 7, 2638 CrossRef CAS.
- Y. Kwon and J. Cho, Chem. Commun., 2008, 1109 RSC.
- J. Y. Kim and J. Cho, Electrochem. Solid-State Lett., 2006, 9, A373 CrossRef CAS.
- Y. Kim, H. Hwang, C. S. Yoon, M. G. Kim and J. Cho, Adv. Mater., 2007, 19, 92 CrossRef CAS.
- T. J. Kim, D. Son, J. Cho, B. Park and H. Yang, Electrochim. Acta, 2004, 49, 4405 CrossRef CAS.
| This journal is © The Royal Society of Chemistry 2009 |