Pt nanoparticle stability in PEM fuel cells: influence of particle size distribution and crossover hydrogen†
Edward F.
Holby
a,
Wenchao
Sheng
b,
Yang
Shao-Horn
*c and
Dane
Morgan
*d
aUniversity of Wisconsin, Materials Science Program, 1509 University Ave., Madison, WI 53706. E-mail: holby@wisc.edu
bMassachusetts Institute of Technology, Department of Chemistry, Electrochemical Energy Laboratory, 77 Mass Ave., Cambridge, MA 02139. E-mail: wsheng@mit.edu
cDepartments of Mechanical Engineering and Materials Science and Engineering, Electrochemical Energy Laboratory, 77 Mass Ave., Cambridge, MA 02139. E-mail: shaohorn@mit.edu
dUniversity of Wisconsin, Materials Science and Engineering, 1509 University Ave., Madison, WI 53706. E-mail: ddmorgan@wisc.edu; Tel: +1 608 265 5879
First published on 20th April 2009
Abstract
This work demonstrates the essential role of particle size and crossover hydrogen on the degradation of platinum polymer electrolyte membrane fuel cell (PEMFC) cathodes. One of the major barriers to implementation of practical PEMFCs is the degradation of the cathode catalyst under operating conditions. This work combines both experimental and theoretical techniques to develop a validated and thermodynamically consistent kinetic model for the coupling of degradation and the catalyst particle size distribution. Our model demonstrates that, due to rapid changes in the Gibbs–Thomson energy, particle size effects dominate degradation for ∼2 nm particles but play almost no role for ∼5 nm particles. This result can help guide synthesis of more stable distributions. We also identify the effect of hydrogen molecules that cross over from the anode, demonstrating that in the presence of this crossover hydrogen surface area loss is greatly enhanced. We demonstrate that crossover hydrogen changes the surface area loss mechanism from coarsening to platinum loss through dissolution and precipitation off of the carbon support.
Broader contextPolymer electrolyte membrane fuel cells (PEMFCs) are a promising technology for replacing internal combustion engines. Such a change could lead to higher energy efficiencies as well as a decrease in environmentally hazardous emissions from transportation. Platinum nanoparticles supported on carbon are used in PEMFC cathodes to provide a large catalytic surface area for the oxygen reduction reaction. However, cathode catalyst surface area loss under PEMFC operating conditions leads to a loss of fuel cell efficiency, eventually limiting PEMFC lifetime.1,30 Unfortunately, the dominant mechanisms and driving forces for the degradation are not established.3 We use an experimentally validated electrochemical model to demonstrate that surface area loss can be dramatically reduced by increasing nanoparticle sizes to just 4–5 nm. We also show that the presence of crossover hydrogen from the anode plays a crucial role in catalyst degradation, both enhancing surface area loss and changing the dominant loss mechanism. This effect must be considered to accurately extrapolate from ex-situ experimental data to real fuel cells. These findings will help direct the creation of more durable PEMFC cathodes. |
Introduction
The dissolution and coarsening of nanostructured dispersions is a fundamental challenge to the long-term stability of nanomaterials, and a particular challenge for PEMFCs cathodes.1 A clear understanding of cathode degradation mechanisms is needed to mitigate surface area loss in PEMFCs and meet the present DOE lifetime goal of 5000 h.2 Under typical PEMFC conditions (excluding start/stop events, which corrode the carbon support) two mechanisms are expected to control surface area loss:3 Pt dissolution with subsequent redeposition off of the electron conducting carbon support (mass loss mechanism) and Pt particle electrochemical Ostwald ripening (coarsening mechanism).1,3,4 These mechanisms will be strongly influenced by the particle size distribution (PSD), which represents the number of Pt particles of a given diameter on the carbon support. Dissolution rates will be faster for PSDs with smaller sizes, since smaller particles are destabilized by their greater specific surface energy.5 Coarsening requires dissolution to allow transport of Pt species between particles, but is additionally driven by different particle surface to volume ratios, and therefore depends sensitively on the width of the PSD. How these dependencies on the PSD shape impact realistic PSDs under different conditions is not known and will determine which loss mechanism dominates. Identifying the quantitative role the PSD plays in surface area loss mechanisms will help both in interpreting results from degradation experiments and in design of stable catalysts for PEMFCs.Understanding the size dependence of the dissolution rate is essential for understanding how the PSD affects surface area loss, since Pt dissolution is at the root of both off-support deposition and coarsening. The Gibbs–Thomson (or Kelvin) equation yields an estimate5 for the size dependence of particle stability, and is generally written as a shift in particle chemical potential:
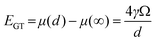 | (1) |
Here d is the particle diameter, γ is the particle surface energy, and Ω is the molar volume of the particle. The Gibbs–Thomson energy (EGT) for Pt (based on values given in Table 1) is 0.18 eV/atom at d = 5 nm, and as large as 0.91 eV/atom by d = 1 nm. If we assume that dissolution is dominated by terms exponential in the particle stability (dissolution rate proportional to exp((1 − β1)EGT/kT), where β1 the transfer coefficient6 with a value of 0.5) then this increase in EGT equates to an increase vs. bulk in the dissolution rate by 1 order of magnitude for a 5 nm particle, 3 orders of magnitude for a 2 nm particle and 6 orders of magnitude for a 1 nm particle. The impact of Gibbs–Thomson on the stability is therefore far more important for particles below 5 nm than above it, and by 2 nm provides a powerful driving force for dissolution and coarsening. The size dependence of dissolution rates shows that the PSD should play an important role in both mass loss and coarsening mechanisms of surface area loss, particularly for particles in the commercially relevant range of a few nanometers.
| Symbol | Value | Units | Reference | Description |
|---|---|---|---|---|
1 These values are taken as zero in the model for the given values of ν1 and ν2 but may not actually be zero physically. The S′i have been renormalized into the values of ν1 and ν2, i.e., ν1 is actually ν1exp[(![[S with combining macron]](https://www.rsc.org/images/entities/i_char_0053_0304.gif) ′PtH2O − ′H2O)/R] and ν2 is actually ν2 exp[(′PtH2O)/R]. ′PtH2O − ′H2O)/R] and ν2 is actually ν2 exp[(′PtH2O)/R].
|
||||
| ν | 1 × 10¹² | Hz. | Assumed | Dissolution attempt frequency |
![[H with combining macron]](https://www.rsc.org/images/entities/i_char_0048_0304.gif) 1,fit
1,fit
|
1.02 × 10⁵ | J mole−1 | Fit | Partial molar dissolution activation enthalpy (cycling) |
| 1.18 × 10⁵ | J mole−1 | Fit | Partial molar dissolution activation enthalpy (potentiostatic) | |
| T | 353 | K | Experiment | Temperature |
| Γ | 2.2 × 10⁻⁹ | mole cm−2 | Ref. 12 | Pt surface site density |
| n 1 | 2 | Assumed | Electrons transferred during dissolution | |
| β 1 | 0.5 | Assumed | Butler–Volmer transfer coefficient for dissolution | |
| U eq | 1.188 | V | Ref. 19 | Dissolution bulk equilibrium voltage |
| Ω Pt | 9.09 | cm3 mole−1 | Ref. 12 | Molar volume of Pt |
| c Pt2+,Ref | 1.3 × 10⁻² | mole cm−3 | Fit | Reference Pt2+ ion concentration |
| γ Pt | 2.4 × 10⁻⁴ | J cm−2 | Ref. 12 | Pt [111] surface energy |
| ν 1 | 1 × 10⁴ | Hz. | Fit | Forward oxide formation rate constant |
| ν 2 | 2 × 10⁻² | Hz. | Fit | Reverse oxide formation rate constant |
| pH | 0 | Assumed | System pH | |
| n 2 | 2 | Assumed | Electrons transferred during oxide formation | |
|
2,fit
|
1.2 × 10⁴ | J mole−1 | Fit | Partial molar oxide formation activation enthalpy (zero coverage) |
| U fit | 1.03 | V | Fit | Oxide formation bulk equilibrium voltage |
| ω | 5.0 × 10⁴ | J mole−1 | Fit | Oxide-oxide interaction energy |
|
′H2O |
01 | J K−1 mole−1 | Assumed | Non-vibrational water partial molar entropy |
|
′PtH2O − ′H2O |
01 | J K−1 mole−1 | Assumed | Difference of activation state and water partial molar entropies (non-vibrational) |
| λ | 2.0 × 10⁴ | J mole−1 | Fit | Oxide dependent kinetic barrier constant |
| β 2 | 0.5 | Assumed | Butler–Volmer transfer coefficient for oxide formation |
A number of researchers have tried experimentally to establish the role of the PSD in surface area loss, and specifically in driving mass loss and coarsening mechanisms.1,4,7–10 However, the contribution of PSD to surface area loss is difficult to determine because surface area loss is potentially influenced by many factors, including temperature, electrochemical potential, presence of hydrogen, Pt loading and dispersion, particle morphology, and carbon support. For example, over 40 years ago Kinoshita, et al.10 demonstrated that the surface area loss with potential cycling was much faster for Pt nanoparticles on carbon than unsupported Pt black (with micron particle sizes). The PSDs of these two catalysts are significantly different, but the additional differences between the catalysts of particle dispersion, support, and morphology makes it impossible to establish the direct impact of the changing PSD on surface area loss. More recently, Makharia, et al.9 showed that increasing the mean diameter of the catalyst nanoparticles could reduce surface area loss, supporting the hypothesis that PSD plays an important role in degradation. However, Makharia, et al. also found that the PSD effect on stability was far more dramatic for a well-dispersed Pt loading whose particles were grown by heat treatment than for an as-received poorly dispersed catalyst. This finding implies that multiple factors contributed to the observed changes in stability, again making it impossible to establish the particular influence of the PSD.
Methodology
In order to separate the factors influencing surface area loss, we have developed an electrochemical model that can identify the dominant loss mechanism under different operational conditions. Our work builds on previous models for Pt mass loss and coarsening11–13 but, unlike previous work, we include a quantitative description of the PSD, coarsening processes, and crossover hydrogen, all of which are here demonstrated to play an important role in degradation. In addition, our model is directly validated against a series of experiments with simultaneous surface area and PSD data (described in the Experimental section), allowing more quantitative simulations than previously possible. We consider both in-situ (in fuel cell) and ex-situ (not in fuel cell, but in an electrochemical cell) degradation experiments. These experiments have important differences, e.g., their Pt/electrolyte ratio (typically much lower for ex-situ experiments compared to in-situ) and the presence of H2 gas in the system (present in the in-situ case due to crossover hydrogen from the anode but not present in the ex-situ experiments). In this paper all potentials are referenced to the reversible hydrogen electrode (RHE) and all surface areas are the measured or predicted specific electrochemical surface area (ESA).Model
Here we describe the basic approach and equations of the model (see ref. 14 for detailed derivations). The thermodynamic and kinetic model treats all the fundamental processes relevant for coarsening and mass loss, including: the particle size dependent electrochemical dissolution and redeposition of Pt; formation and removal of a passivating oxide layer; diffusion of ionic Pt species in the electrolyte; deposition of diffused Pt ions off of the carbon support due to crossover hydrogen from the anode. The model yields a set of differential equations for the PSD, Pt mass on-carbon support, and surface area as a function of pH, temperature, and potential, for all times. This work extends a previous degradation model of Darling and Meyers12,13 to include PSD effects, more complete interfacial thermodynamics, and hydrogen crossover effects. From the model it is possible to determine the relative amounts of mass lost from the PSD and coarsening (particle growth) under different conditions.The model is one dimensional along the direction normal to the cathode and mean-field in the plane orthogonal to this direction as shown in Fig. 1. To simulate in-situ experimental conditions the Pt diffuses along the line to the anode, crossover hydrogen is included, and the volume of electrolyte and Pt loading are 10−4 ml and 0.4 mg per cm2 cathode, respectively. To simulate ex-situ experimental conditions the Pt diffuses radially from the cathode, there is no crossover hydrogen, the Pt is mixed by stirring every 200 cycles, and the volume of electrolyte and Pt loading are 130 ml and 0.01 mg per cm2 cathode, respectively (these conditions match those used in the ex-situ experiments performed in this work and discussed).
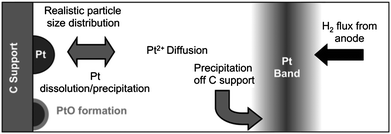 | ||
| Fig. 1 Schematic representation of processes included in the cathode model. | ||
Dissolution and precipitation of Pt on the support is assumed to be dominated by the process
| Ptsolid ↔ Pt2+aqueous + 2e− | (2) |
Alternate pathways for Pt dissolution, through PtO or PtO2, are possible. For PtO, there is no evidence for direct dissolution playing significant role in overall Pt dissolution rate. Recent results from Wang, et al.15 show that PtO passivates the Pt surface and reduces dissolution strongly suggesting that PtO dissolution is not a dominant dissolution pathway. There is some evidence for dissolution of PtO216 but we are modeling voltages generally below the range for PtO2 formation (∼1.2 V)17 and dissolution data from Bindra et al.18 suggests a Pt2+, not Pt4+, aqueous species. We therefore do not include the process of PtO or PtO2 aqueous dissolution, an assumpion consistent with the very low PtO dissolution rates used in previous models.11,12 The electrochemical rate equation for Pt dissolution and precipitation is modeled using a Butler–Volmer6 rate equation with modification for oxide coverage passivation and a size dependent destabilization energy (given by the Gibbs–Thomson energy, Eqn 1). The bare surface energy is taken to be that for Pt [111] and it is modified by oxygen coverage according to absorption thermodynamics. We write our electrochemical rate equation for Pt dissolution and precipitation as
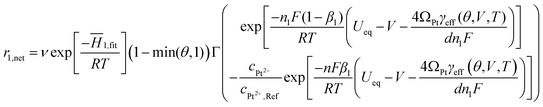 | (3) |
1,fit is the partial molar activation enthalpy of the dissolution reaction, θ is the fraction of surface covered by oxide (allowed to go from 0 to 2 for greater than monolayer coverage), Γ is the surface density of Pt atoms, n1 is the number of electrons moved per reaction (in this case 2), F is the Faraday constant and equal to the charge of a mole of electrons, β1 is the Butler–Volmer transfer coefficient, R is the ideal gas constant, T is the cell temperature, Ueq is the bulk equilibrium potential, V is the cell voltage, d is the diameter of the given Pt particle, ΩPt is the molar volume of Pt, γeff is the effective particle surface energy, cPt2+ is the mean field concentration that the particle is in contact, and cPt2+,Ref is a reference concentration which accounts for the fact that the attempt frequency for the back reaction in Eqn 3 involves aqueous ions and can differ significantly from the forward reaction attempt frequency. The third term in the exponentials is the Gibbs–Thomson energy, which is responsible for the instability of small nanoparticles.
The attempt frequency is assumed to be that of a phonon frequency (1012 Hz). Dissolution rates for potentiostatic simulations are fit to surface area loss curves from Ferreira et. al.,1 while dissolution rates for cycling simulations are fit to the surface area loss curves shown in this paper for the pristine sample (see experimental section). Cycling requires a faster dissolution rate than potentiostatic holds, presumably due to destabilization of the Pt by oxide formation and removal. Butler–Volmer coefficients of 0.5 are assumed. The reference Pt concentration is fit to so that the forward and backward reaction rates balance to reproduce the equilibrium aqueous Pt concentration of Bindra, et al.18 Bulk equilibrium voltage is taken from Pourbaix.19 The effective surface energy can be derived from the Gibbs adsorption equation6 and the oxide model discussed, and is given by
 | (4) |
Formation and removal of surface oxide (following the pathway of Eqn 5) is modeled using a Butler–Volmer rate equation allowing up to 2 layers of PtO growth with modifications for oxide–oxide interactions.
| Ptsolid + H2O ↔ PtO + 2H+ + 2e− | (5) |
We write the oxide formation/removal rate as
 | (6) |
Here ν1 (ν2) is the forward (backward) reaction attempt frequency, ′i is the partial molar entropy of species i with the vibrational degrees of freedom removed, 2,fit is a fitting parameter that represents the activation barrier when the oxide formation reaction is in equilibrium at zero oxide coverage. We assume that this barrier at reaction equilibrium is linearly dependent on fractional coverage, which introduces the term λθ, where λ is a fitting parameter. Deviation from the equilibrium is treated using the Butler–Volmer formalism where β2 is the symmetry factor (assumed here to be 0.5 for all coverages). Ufit is a fitted parameter that sets the equilibrium voltage. An oxide coverage dependent term is included to account for oxide–oxide interactions on the surface that destabilize the products of the reaction. This interaction is assumed to be linear with a fit interaction energy of ω The voltage term is written in the usual electrochemical manner to account for the energy of the n2 (in this case 2) product electrons. The parameters that need to be determined for this model are ν1,′PtH2O − ′H2O,2,fit,λ,β,Ufit,ω,ν2,′PtH2O.These values are fit to cyclic voltammetry data of Jerkiewicz, et al.,17 which includes oxide coverage vs. potential for a range of temperatures and maximum sweep voltage. Fitting is aimed at reproducing the oxide onset voltage, leveling anodic current density value, and cathodic peak thickness, voltage and current density.
Pt transport in the electrolyte is modeled as Fickian diffusion taking into account the electrolyte excluded volume and uses a Pt ion diffusion constant in H2O1. Under in-situ conditions, we include the effect of crossover hydrogen. Crossover hydrogen refers to the H2 from the anode that crosses over to the cathode during fuel cell use.4 It is well established that crossover hydrogen precipitates dissolved Pt out of the electrolyte to form what is called the Pt band.1,20,21 The location of the band is determined by a balance of hydrogen and oxygen partial pressures21–23 and represents a catalytically inactive sink for dissolved Pt in the system. The dissolved Pt2+ is removed from the system by the precipitation reaction
| Pt2+(aq) + H2 → Pt(s) + 2H+ | (7) |
A complete model of the Pt band formation requires modeling the H2, and O2 partial pressures and permeabilities in the cathode.22 However, including these terms would add significant complexity to the model and is not the focus of this study. Therefore, we adopt a simplified model for the Pt band that is adequate to capture the role that crossover hydrogen plays in ESA loss. First, we assume the band is perfectly sharp, which is justified by the experimental observation that the band is typically very thin (∼1 µm).1,22 Second, we assume the band is a perfect sink for dissolved Pt2+, i.e., that Eqn 7 is Pt2+ limited. This assumption is justified by the fact that typical H2 crossover rates (∼2 mA cm−2)24 correspond to about 2 × 10⁻⁸ mol (cm2-s)−1 of H. This amount of H can easily consume the amount of dissolved Pt. In fact, cathode Pt loadings are typically less than 0.4 mg cm−2, or about 2 × 10⁻⁶ mol Pt cm−2, which could only use all the crossover H2 for only about 200 s if the reaction of Eqn 7 were H2 limited. Therefore, it is clear that the reaction will be Pt2+ limited. Finally, the position of the Pt band is taken from experiments and set to 11 µm from the cathode surface.1,22 We find that the results are not sensitive to this position to within a few µm. The mathematical model for the Pt band is therefore a perfect Pt2+ sink boundary condition located at 11 µm.
The coupled dissolution and oxide growth equations are time evolved using a variable order solver based on numerical differentiation formulas (as implemented in the Matlab ® ode15s solver). The PSD is sampled nonuniformly at 700 distinct radii, with 200 radii concentrated in the small particle region of the final distribution for accuracy. When fitting to experimental TEM PSDs the PSD is assumed to have a log-normal functional form (suggested by Granqvist and Buhrman25) and match the overall system loading. When simulating Pt diffusion in the electrolyte at least 200 mesh points were used in the concentration profile and meshing was done more finely close to the cathode surface.
A constant non-PSD dependent surface area loss function is added to all cycling distributions to account for non-PSD loss mechanisms such as carbon corrosion and surface blocking in the cycling experiments. This function is taken as the difference in modeled and observed surface area for HT3 (the sample with the largest particles and therefore smallest PSD driven surface loss). The geometric surface area (GSA, measured by Transmission Electron Microscopy, TEM) and ESA (measured by CVs) are not equal and a rescaling parameter, derived from experimental data (typically ESA/GSA = 0.63), was used to adjust model GSA for comparison to experimental ESA. Reported PSDs are normalized to either one (normalized PSD) or total mass (mass normalized PSD; see ESI†). Particle migration and coalescence (Smoluchowski mechanism26) is not investigated in this study as it does not contribute significantly in the temperature range considered.3
Experimental
Four Pt catalysts with different PSDs are examined in electrochemical cell (ex-situ) degradation experiments. The catalyst with the smallest PSD is a commercial Pt nanoparticle catalyst on high surface area carbon (Tanaka Kikinzoku, Japan), denoted as pristine. Pt catalysts with larger mean diameter PSDs are obtained by heat treating the pristine catalyst and are referred to as HT1 (H2, 90°C, 30 min), HT2 (H2, 150 °C, 2 h) and HT3 (Ar, 900 °C, 1 min). Here HT refers to heat treatment and the names in parenthesis give the gas environment, temperature, and time of heat treatment. These catalysts are suspended in de-ionized water, and then deposited on glassy carbon electrodes, followed by Nafion® coating after drying. As-prepared electrodes are then immersed into 60 mL of 0.5 M of sulfuric acid (H2SO4) as the working electrode. A spiral Pt wire acts as the counter electrode and a saturated calomel electrode (SCE) as the reference electrode. The potential of SCE with respect to the RHE is calibrated from rotating disk electrode measurements of hydrogen oxidation. After the electrolyte is saturated with nitrogen for half an hour, the working electrodes is scanned between 0.04 V and 1.16 V at a sweep rate of 200 mV s−1 for 60 cycles to remove contaminants from Nafion® solution. Steady-state cyclic voltammograms (CVs) are then recorded at 50 mV s−1 in the same potential range at room temperature. The ESA of supported Pt nanoparticles is determined from the hydrogen underpotential deposition region. Accelerated potential cycling experiments are performed by potential scanning of the Pt catalyst from 0.6 V to 1.0 V at 20 mV s−1 at 80 °C. The CVs are recorded at room temperature every 200 cycles to determine the ESA.Results and discussion
In order to validate the model and understand the coupling of surface area loss and PSD, we perform a parallel simulation and ex-situ experimental study of surface area and PSD changes under potential cycling. Potential cycling is a common method of accelerated testing for cathode degradation.15,30 Four different samples from the same starting cathode are considered, three of which have had their PSDs altered with different heat treatments (see Methodology). The initial and final experimental PSDs are characterized by log-normal fits to distributions of 200 particles measured by TEM, following methods established in the literature.1,20,27 The estimated error in the mean from sampling 200 particles is 0.05–0.10 nm.28 The initial experimental PSDs are input to the model, which is then used to simulate the PSD and surface area evolution under conditions identical to the experiments (Fig. 2). A qualitative agreement between experiments and the model is found for surface area loss magnitudes and the shape of the final PSDs. The worst agreement is seen for case HT2, where the final PSD from our simulation appears shifted to a larger diameter than that found experimentally. The source of this discrepancy is not clear. It should be noted, however, that the initial log-normal distribution of the initial PSD for HT2 was not as representative of the experimental particle histogram shape as compared to the other samples. This difference suggests that the overall PSD evolution of the HT2 sample may be shifted due to the initial distribution. Overall, the agreement found both validates the model and suggests that alterations of the PSD due to heat treatment is the dominant cause of the different surface area evolution behavior in these samples (as opposed to surface annealing or some other effect of the heat treatment, as suggested in ref. 9). In all four samples shown in Fig. 2, an approximate asymptotic surface area is reached as the PSDs shift toward larger mean diameters (in some cases it may seem that the surface area actually increases with more cycles, but changes after 600–800 cycles cannot be distinguished from noise in the measurements). The model also predicts this behavior, demonstrating that ESA loss almost ceases for the larger diameter PSDs found at the end of the experiment. In comparison to the pristine initial PSD, the enhanced stability of the cycled PSDs is due to their significantly increased mean diameter and reduced fraction of smaller particles. This stability is qualitatively expected from the trends in the Gibbs–Thomson energy.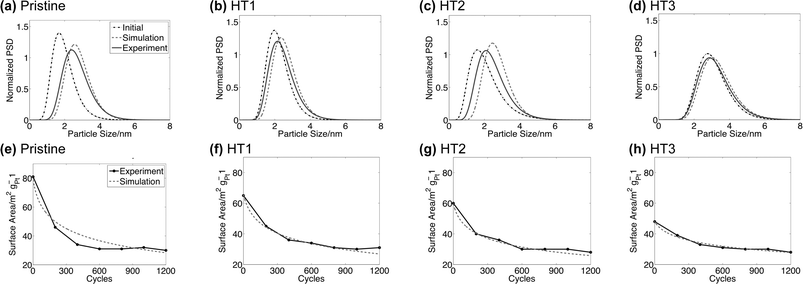 | ||
| Fig. 2 (a–d) Normalized particle size distributions before and after 1200 voltage cycles (triangular sweep between 0.6 V and 1.0 V with a sweep rate of 20 mV s−1). (e–h) Surface area vs. cycle number for the 1200 voltage cycles of these distributions. | ||
To quantify the role of the PSD mean diameter in surface area loss, we simulate a common degradation experiment of a cathode under constant potential. Fig. 3 shows the simulated surface area loss of an in-situ test for four log-normal PSDs with identical variances of 0.27 nm2 and loadings of 0.4 mg cm−2 (typical of commercial catalysts1) but with different mean diameters. The smallest mean diameter distribution (2 nm) has dramatic surface area loss, while there is little change in the surface area for distributions with mean diameters of 4–5 nm. The closed circles show experimental results1 for the smallest PSD, and the good agreement with the model helps validate our simulation. These results demonstrate that surface area loss changes dramatically for mean sizes changing from ∼2–3 nm to ∼4–5 nm, and ESA loss (through both mass loss and coarsening) is almost totally eliminated for the larger particle sizes (given the time and voltage ranges considered).
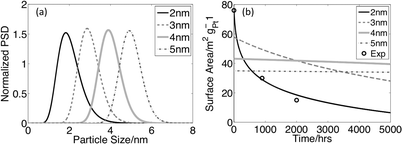 | ||
| Fig. 3 Potentiostatic runs at 0.95 V (a) Initial normalized particle size distributions with mean particle sizes of 2, 3, 4, and 5 nm. All distributions have the same variance (0.27 nm2)1 and mass loading (0.4 mgPt cm−2).1(b) Surface area vs. time for the four distributions. Experimental data is taken from Ferreira et. al.1 | ||
A detailed examination of the final PSDs of the ex-situ (Fig. 2) and in-situ (Fig. 3) studies demonstrates that the surface area is lost by quite different mechanisms in the two simulations. It is necessary to understand the cause of the differences between the two simulations to understand to what extent researchers can use ex-situ measurements as a guideline for the in-situ degradation in fuel cells. We have identified the primary source of the differences between our in- and ex-situ simulations as due to crossover hydrogen, which is present only during in-situ studies. We here demonstrate that crossover hydrogen plays an essential role in both the magnitude of surface area loss and the mechanism by which it occurs.
In Fig. 4a, ![[thick line, graph caption]](https://www.rsc.org/images/entities/char_e117.gif) shows the simulated surface area loss for a 2 nm mean diameter PSD in the presence of crossover H2, as shown previously in Fig. 3. Fig. 4a,
shows the simulated surface area loss for a 2 nm mean diameter PSD in the presence of crossover H2, as shown previously in Fig. 3. Fig. 4a, ![[dash dash, graph caption]](https://www.rsc.org/images/entities/char_e091.gif) shows the surface area loss for an identical simulation without crossover H2. The surface area loss at 5000 h is more than 50% greater with hydrogen present. Fig. 4b shows the initial (truncated) PSD and the final PSDs after 5000 h for the simulations with and without crossover hydrogen. With crossover hydrogen, none of the particles increase in size and much of the Pt mass is lost from the cathode, as shown by a decrease in the height of the mass normalized PSD at all diameters. Thus, with crossover hydrogen, the surface area loss and PSD changes are dominated by a mass loss mechanism. However, when there is no crossover hydrogen, smaller particles dissolve, larger particles grow, and very little mass is lost from the PSD (as demonstrated by the shift to the right of the mass normalized PSD and mass measurements that are not shown). Thus, without crossover hydrogen, the surface area loss and PSD changes are dominated by coarsening. The mass loss mechanism is more aggressive, leading to a larger surface area loss compared to that in the absence of crossover hydrogen. Crossover hydrogen not only decreases the ionic Pt concentrations (leading to increased dissolution rates) but increases the Pt mass flow from the particle surface due to an increased concentration gradient, which then leads to an increase in the mass loss mechanism of ESA loss. For more detail on the concentration profiles, see ESI†.
shows the surface area loss for an identical simulation without crossover H2. The surface area loss at 5000 h is more than 50% greater with hydrogen present. Fig. 4b shows the initial (truncated) PSD and the final PSDs after 5000 h for the simulations with and without crossover hydrogen. With crossover hydrogen, none of the particles increase in size and much of the Pt mass is lost from the cathode, as shown by a decrease in the height of the mass normalized PSD at all diameters. Thus, with crossover hydrogen, the surface area loss and PSD changes are dominated by a mass loss mechanism. However, when there is no crossover hydrogen, smaller particles dissolve, larger particles grow, and very little mass is lost from the PSD (as demonstrated by the shift to the right of the mass normalized PSD and mass measurements that are not shown). Thus, without crossover hydrogen, the surface area loss and PSD changes are dominated by coarsening. The mass loss mechanism is more aggressive, leading to a larger surface area loss compared to that in the absence of crossover hydrogen. Crossover hydrogen not only decreases the ionic Pt concentrations (leading to increased dissolution rates) but increases the Pt mass flow from the particle surface due to an increased concentration gradient, which then leads to an increase in the mass loss mechanism of ESA loss. For more detail on the concentration profiles, see ESI†.
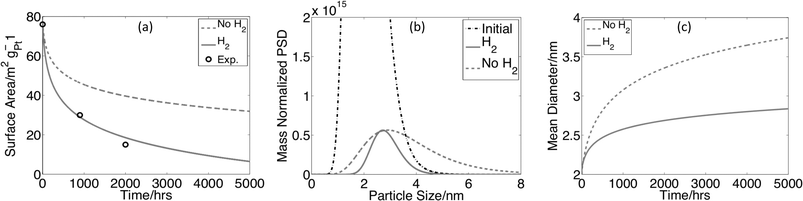 | ||
| Fig. 4 (a) Surface area vs. time for distributions with and without crossover hydrogen. Distributions are aged potentiostatically at 0.95 V. (b) Initial (truncated) and aged mass normalized PSDs with and without 2 mA cm−2 H2 crossover from the anode at 11 microns. (c) Mean particle diameter vs. time for these distributions. Experimental surface area data is taken from ref. 1. Conditions are the same as those in Fig. 1 for the 2 nm diameter PSD. | ||
As shown in Fig. 4c, the mean diameter increases during the simulations with and without hydrogen. In the mass loss dominated case, both small and large particles dissolve, and the increase in mean diameter is due to the relatively faster dissolution rate (and disappearance) of smaller particles compared to larger ones. In the coarsening dominated case, the increase in mean diameter is due to particle growth. These results demonstrate the fact that the observation of increased mean diameter of the PSD alone cannot be used to identify coarsening as a major surface area loss mechanism. This fact is essential to interpreting TEM or Small-Angle X-ray Scattering (SAXS) data, where the increased mean diameters that are commonly seen with aging1,8 cannot be interpreted as coarsening without additional information, e.g., about the mass on the support.
Based on these simulations, we predict that in-situ fuel cell catalysts with crossover hydrogen will suffer more surface area loss and lose surface area differently (through mass loss) than catalysts in ex-situ acid experiments (where coarsening is the observed dominant loss mechanism). While both mass loss and coarsening are driven by the instability of small Pt nanoparticles, the fundamentally different mechanisms underlying surface area loss must be taken into account when considering the implications of ex-situ degradation experiments for real fuel cells.
Conclusions
Electrochemical modeling provides access to information about the PSD changes and surface area loss that is difficult to isolate experimentally. We have developed a model that has allowed us to gain a deeper understanding of the role of the PSD and different mechanisms in the loss of surface area. Simulations have demonstrated that there is a critical enhancement in stability, due to rapidly changing Gibbs-Thomson energies, in the region from ∼2–3 nm to ∼4–5 nm particle sizes. The existence of this critical region suggests that slightly increasing the particle sizes from commonly used 2–3 nm values could provide an enormous gain in stability. However, the changes in particle size can also potentially alter the Pt specific activity, which must be taken into account in designing an optimal fuel cell.29 In the absence of a Pt sink, coarsening is the dominant PSD influenced mechanism of surface area loss. In fuel cells, however, crossover hydrogen from the cell anode creates a Pt sink that both accelerates surface area loss and shifts the dominant loss mechanism to mass loss. Mitigating crossover hydrogen and the use of Pt nanoparticles greater than 4–5 nm in diameter should lead to a significantly more stable PEMFC cathode.Acknowledgements
The authors would like to thank financial support from the Department of Energy Basic Research for the Hydrogen Fuel Initiative (DE-FG01-04ER04-20). The authors would also like to thank D. Myers, R. Darling, J. Meyers, and I. Szlufarska for informative discussions.References
- P. J. Ferreira, G. J. la O', Y. Shao-Horn, D. Morgan, R. Makharia, S. Kocha and H. A. Gasteiger, J. Electrochem. Soc., 2005, 152, A2256–A2271 CrossRef.
- N. Garland, 2006 DOE Hydrogen Program Annual Program Review, 2006 Search PubMed.
- Y. Shao-Horn, W. C. Sheng, S. Chen, P. J. Ferreira, E. F. Holby and D. Morgan, Top. Catal., 2007, 46, 285–305 CrossRef CAS.
- R. Borup, J. Meyers, B. Pivovar, Y. S. Kim, R. Mukundan, N. Garland, D. Myers, M. Wilson, F. Garzon, D. Wood, P. Zelenay, K. More, K. Stroh, T. Zawodzinski, J. Boncella, J. E. McGrath, M. Inaba, K. Miyatake, M. Hori, K. Ota, Z. Ogumi, S. Miyata, A. Nishikata, Z. Siroma, Y. Uchimoto, K. Yasuda, K. I. Kimijima and N. Iwashita, Chem. Rev., 2007, 107, 3904–3951 CrossRef CAS.
- C. T. Campbell, S. C. Parker and D. E. Starr, Science, 2002, 298, 811–814 CrossRef CAS.
- J. Bockris and A. K. N. Reddy, Modern Electrochemistry, Plenum Press, New York, 1970 Search PubMed.
- R. Borup, J. Davey, F. Garzon, D. Wood and M. Inbody, J. Power Sources, 2006, 163, 76–81 CrossRef CAS.
- M. C. Smith, J. A. Gilbert, J. R. Mawdsley, S. Seifert and D. J. Myers, J. Am. Chem. Soc., 2008, 130, 8112 CrossRef CAS.
- R. Makharia, S. S. Kocha, P. T. Yu, M. A. Sweikart, W. Gu, F. T. Wagner and H. A. Gasteiger, ECS Trans., 2006, 1, 3–18 Search PubMed.
- K. Kinoshita, J. T. Lundquist and P. Stonehart, Electroanal. Chem. Interfac. Electrochem., 1973, 48, 157–166 Search PubMed.
- A. A. Franco and M. Tembely, J. Electrochem. Soc., 2007, 154, B712–B723 CrossRef CAS.
- R. M. Darling and J. P. Meyers, J. Electrochem. Soc., 2003, 150, A1523–A1527 CrossRef CAS.
- R. M. Darling and J. P. Meyers, J. Electrochem. Soc., 2005, 152, A242–A247 CrossRef CAS.
- E. F. Holby, W. C. Sheng, Y. Shao-Horn and D. Morgan, in preparation.
- X. P. Wang, R. Kumar and D. J. Myers, Electrochem. Solid-State Lett., 2006, 9, A225–A227 CrossRef CAS.
- S. Mitsushima, S. Kawahara, K. I. Ota and N. Kamiya, J. Electrochem. Soc., 2007, 154, B153–B158 CrossRef CAS.
- G. Jerkiewicz, G. Vatankhah, J. Lessard, M. P. Soriaga and Y. S. Park, Electrochim. Acta, 2004, 49, 1451–1459 CAS.
- P. Bindra, S. J. Clouser and E. Yeager, J. Electrochem. Soc., 1979, 126, 1631–1632 CrossRef CAS.
- M. Pourbaix, Atlas of Electrochemical Equilibria in Aqueous Solutions, Pergamon Press, Oxford, 1966 Search PubMed.
- K. Yasuda, A. Taniguchi, T. Akita, T. Ioroi and Z. Siroma, Phys. Chem. Chem. Phys., 2006, 8, 746–752 RSC.
- W. Bi, G. E. Gray and T. F. Fuller, Electrochem. Solid-State Lett., 2007, 10, B101–B104 CrossRef CAS.
- J. X. Zhang, B. A. Litteer, W. Gu, H. Liu and H. A. Gasteiger, J. Electrochem. Soc., 2007, 154, B1006–B1011 CrossRef CAS.
- V. V. Atrazhev, N. S. Erikhman and S. F. Burlatsky, J. Electroanal. Chem., 2007, 601, 251–259 CrossRef CAS.
- H. A. Gasteiger, S. S. Kocha, B. Sompalli and F. T. Wagner, Appl. Catal., B, 2005, 56, 9–35 CrossRef CAS.
- C. G. Granqvist and R. A. Buhrman, J. Appl. Phys., 1976, 47, 2200–2219 CrossRef CAS.
- P. Wynblatt and N. A. Gjostein, in Progress in Solid State Chemistry, ed. McCaldin and Somorjai, Pergamon, New York, 1975, pp. 21–58 Search PubMed.
- J. Aragane, T. Murahashi and T. Odaka, J. Electrochem. Soc., 1988, 135, 844–850 CrossRef CAS; A. Taniguchi, T. Akita, K. Yasuda and K. Miyazaki, J. Power Sources, 2004, 130, 42–49 CrossRef CAS; Y. Shao, G. Yin, Y. Gao and P. Shi, J. Electrochem. Soc., 2006, 153, A1093–A1097 CrossRef CAS; Y. Zhai, H. Zhang, D. Xing and Z. Shao, J. Power Sources, 2007, 164, 126–133 CrossRef CAS; E. Guilminot, A. Corcella, F. Charlot, F. Maillard and M. Chatenet, J. Electrochem. Soc., 2007, 154, B96–B105 CrossRef CAS; X. Wang, W. Li, Z. Chen, M. Waje and Y. Yan, J. Power Sources, 2006, 158, 154–159 CrossRef CAS.
- J. R. Taylor, An Introduction to Error Analysis, University Science Books, Sausalito, CA, 1997 Search PubMed.
- N. M. Markovic and P. N. Ross, Jr, Surf. Sci. Rep., 2002, 45, 121–229 CrossRef CAS; K. J. Mayrhofer, B. B. Blizanac, M. Arenz, V. Stamenkovic, P. N. Ross and N. M. Markovic, J. Phys. Chem. B, 2005, 109, 14433–14440 CrossRef CAS.
- J. Zhang, K. Sasaki, E. Sutter and R. R. Adzic, Science, 2007, 315, 220–222 CrossRef CAS.
Footnote |
| † Electronic supplementary information (ESI) available: Particle size distribution normalization and concentration profiles. See DOI: 10.1039/b821622n |
| This journal is © The Royal Society of Chemistry 2009 |