Thermodynamic study of the adsorbed hydrogen phase in Cu-based metal-organic frameworks at cryogenic temperatures
Received
17th October 2008
, Accepted 3rd February 2009
First published on 27th February 2009
Abstract
The hydrogen adsorption properties of two isostructural copper-based microporous metal-organic frameworks (MOFs) materials which differ in the length of the bridging ligands were investigated over the 50–100 K and 0–40 bar ranges. The measured excess adsorption isotherms were analyzed in terms of adsorption enthalpies, adsorbed phase densities and volumes. The characteristic excess maximum was found to be displaced to lower pressures and to vary less as a function of temperature on the material with the shorter ligand. This behaviour could be explained, on the basis of enthalpy calculations, by an enhanced hydrogen affinity in smaller pores. On the other hand, it was also found that the material with the shorter ligand has a reduced storage capacity. This observation could be explained, from measurements near saturation, by a reduction of both adsorbed phase density and volume. Despite their structural difference, both MOFs adsorbed hydrogen near saturation under an incompressible phase reaching bulk liquid densities. These properties suggest that repulsive forces may ultimately limit the packing of supercritical molecules in small pores despite apparently stronger solid–gas interactions.
Broader context
The safe and efficient storage of hydrogen constitutes one of the key challenges in the implementation of fuel cell vehicles. One of the strategies widely studied for that purpose is the hydrogen adsorption on microporous metal-organic frameworks (MOFs). Up to now, few hydrogen adsorption thermodynamics data are available for MOFs, limiting our understanding of the storage mechanisms. The purpose of this work is to address this issue in a comparative study of hydrogen adsorption on copper-based MOFs over wide ranges of pressure and temperature, including temperatures as low as 50 K. Such measurements allow for the determination of the solid–gas interactions and provide significant insights on the state of the adsorbed hydrogen and the physical limits of these solid–gas systems. These results offer original fundamental and practical perspectives in the field of hydrogen storage research.
|
1. Introduction
Hydrogen is foreseen as a part of a diversified energy portfolio that could help mitigate environmental and economical impacts associated with the current use of fossil fuels in transportation. In this context, hydrogen fuel cell vehicles could provide the benefits of electric propulsion while increasing the driving range beyond the limits of current battery technologies. However, the overall performance of a hydrogen vehicle is dependent on the implementation of an efficient method to store rapidly on-board large amounts of hydrogen in a light, compact and safe manner. Since the traditional compression and liquefaction methods have important limitations, new physical and chemical approaches are under investigation to store hydrogen under a dense, bound, state by means of hydrogen–solid interactions.1 Microporous metal-organic frameworks (MOFs) are among the materials attracting a lot of interest for the molecular storage of hydrogen. The materials known as IRMOF-1 and MOF-177, for instance, are capable of adsorbing rapidly large amounts of hydrogen, respectively storing up to 6–7 wt% in excess at 77 K and around 35 bar.2,3,4 Recently, it has been experimentally shown that an incompressible adsorbed hydrogen phase reaching a maximum density of 69 g L−1 forms in IRMOF-1 near saturation at 50 K.5 This conjunction of liquid state properties, unexpected above the critical temperature (33.2 K), could be explained in terms of micropore filling. These properties have appeared as a potential limiting factor to the packing density of supercritical hydrogen molecules under nanoscale confinement. Similar observations were made more recently on MOF-177 under similar conditions.6 The adsorption properties of porous materials are strongly dependent on the size of the pores. This phenomenon was illustrated in a study by Lin et al. who have investigated the influence of pore metrics on hydrogen adsorption on isostructural Cu-based MOFs.7 The adsorption on MOFs is recognized as physisorption, a moderately exothermic mechanism.8 The adsorption energy, usually increases as the pore size diminishes and potential wells from opposite walls overlap.9 Allegedly, this effect could favour the formation of a denser adsorbed phase.10 However, the influence of adsorption energetic on the nature of the adsorbed hydrogen phase in MOFs is actually not well known as only a few experiments have been performed to directly measure its volume and density. The objective of the present work is to investigate this matter by measuring and modelling hydrogen adsorption at different pressures and temperatures on MOFs differing solely by their pore size. The excess adsorption measurements were performed and analyzed over the 0–40 bar and 50–100 K ranges according to methods we recently presented.5,6 Since saturation is virtually reached at the lowest temperatures, the ultimate adsorbed phase densities and volumes could be extracted from the measurements. The copper-based MOFs described in a previous investigation at 77 K were chosen for this study as they have different ligand lengths.7 They also have open metal-sites which could be energetically favourable for hydrogen storage.11,12
2. Methodologies
2.1 Materials synthesis and characterization
The MOFs samples referred to as Cu2(bptc) and Cu2(tptc) were prepared at the University of Nottingham according to a method described by Lin et al.7 Cu2(3,3′,5,5′ biphenyl tetracarboxylate) and Cu2(3,3′,5,5′ terphenyl tetracarboxylate) are microporous crystalline materials composed of the Cu2(CO2)4 paddlewheel structural building unit linked by biphenyl and terphenyl connectors, respectively, to give frameworks with NbO-type topologies. Free solvent molecules in the CuII complexes could be degassed at 100 °C under vacuum to activate the porosity and prepare the materials for adsorption experiments. The porosity of the desolvated samples was measured using a Quantachrome Autosorb-1 automated gas-sorption apparatus. The Brunauer–Emmett–Teller (BET) specific surfaces areas (SSA) of the samples Cu2(bptc) and Cu2(tptc), evaluated from nitrogen adsorption isotherms at 77 K, are about 1350 m2 g−1 and 2510 m2 g−1, respectively. Note that these surfaces were calculated over a P × P−10 range of 5 × 10⁻²–1.5 × 10⁻¹, as these conditions can affect the values of the resulting areas.13Cu2(bptc) which is based on the shortest ligand shows the lowest BET specific surface area, pore size and porous volume as reported by Lin et al.7 The size (L) of the pores is about 0.65 nm on Cu2(bptc) and 0.73 nm on Cu2(tptc), in the range of micropores (L < 2 nm).7
2.2
Hydrogen
adsorption measurements
The hydrogen excess adsorption isotherms were measured using an automated Sieverts' apparatus (PCT-Pro 2000 from Hy-Energy LLC) in conjunction with a continuous-flow cryostat operated under a liquid helium flow. We have modified this system in order to obtain a very stable equilibrium temperature (ΔT ≅ 10 mK) over the 50–300 K temperature range in the pressurized sample cell. The excess isotherms were calculated from sets of successive gas expansion measurements by comparing the total amount of hydrogen sent to the sample cell with the amount of residual gaseous hydrogen in the cell after each expansion. In order to identify the equilibrium conditions accurately, Labview plotters were used to monitor real time pressure and temperature (P,T) in the system. The dead space volumes were determined at room temperature by helium expansion measurements with the assumption of a negligible adsorption of this gas.14 Ultra-high purity hydrogen and helium (99.999%) from Airgas Inc., were used. The measurements performed with this volumetric setup were previously validated with the reference data published by NIST.4,5 The experiments on the Cu-MOFs were repeated to verify their reproducibility. It was found that the adsorbents could easily be reactivated following a mild overnight degassing at ambient temperature. Moreover, desorption tests performed at 77 K revealed the reversibility of the adsorption isotherms with decreasing pressure, suggesting weak solid–gas interactions on both samples.
2.3 Analysis of hydrogen adsorption measurements
The analysis of the measurements was based on the fundamental relationship between absolute and excess adsorption isotherms. The absolute amount adsorbed Na, which represent all the molecules in the adsorbed phase, approaches a constant value as the micropores are being completely filled. This behaviour is reflected by the saturation plateau typical of many adsorption models. In contrast, the measured excess adsorption amount Nex, determined with reference to simple compression, exhibits a maximum as the bulk gas density increases at a faster rate than the adsorbed phase density.15 The formal relationship between the amounts Na and Nex is:9
The quantities ρg = P(ZRT)−1 and Va refer to the real gas phase density and the adsorbed phase volume, respectively. At low gas densities, the relationship Nex ≅ Na usually holds. At high densities, the amount Nex can be modelled using eqn (1) with a suitable absolute function Na(P,T). In pores of nanoscale dimensions micropore filling is likely to occur and Na(P,T) can generally be represented by the Dubinin–Astakhov (DA) model.9 The latter is commonly used in its original form for structural characterization. When expressed in terms of the DA model, eqn (1) takes the particular form:5
| |  | (2) |
where
ρa is the adsorbed phase density at saturation,
W0 is the limiting adsorption volume,
E is a characteristic energy,
R is the universal gas constant,
m is an heterogeneity parameter.
16Ps is a pseudo-saturation pressure which can be defined as
Ps = (
T/
Tc)
γPc for supercritical
adsorption.
17 The DA model has been successfully applied to hydrogen
adsorption isotherms on various microporous nanomaterials over the 50–100 K range.
5,6,14 It provides a formal basis to establish the dependence of the amount adsorbed on (
P,
T). The magnitude of the adsorption enthalpy, or heat of
adsorption, can be calculated using the Clausius–Clapeyron equation:
| |  | (3) |
where
θ is the fractional filling of the pores. When expressed as a function of the DA model parameters, Δ
H has a form explicitly dependent on
θ and
T:
5,16| |  | (4) |
The quantity  relates to the volumetric expansion of the adsorbed phase.18 The temperature dependent-part of eqn (4) was found to be non-negligible.14 The γ parameter, specific to the solid–gas system, is likely to be associated to the internal degrees of freedom of the adsorbate. Eqn (4) can represent the heat evolving as adsorption occurs over a range of filling corresponding to realistic operating conditions of a hydrogen storage system.
The saturation regime is particularly interesting in the study of the physical limits of an adsorbent. Near saturation, Na approaches monotonically a constant value and varies negligibly with increasing pressure. In these conditions the corresponding Nex amount varies mainly as a function of ρg and the following approximation can be made from eqn (1):5,19
| |  | (5) |
A constant Va value over the saturation region of the isotherm indicates an incompressible fluid behaviour. The quantity ρa can be calculated by accounting for the total amount of molecules present in Va. The relationship Va ≅ W0 was found to hold well for hydrogen adsorption in IRMOF-1.5 This observation is, in fact, consistent with the behaviour of eqn (2) which reduces to eqn (1) as P → Ps, assuming Va ≅ W0. The correspondence between these two volumes will also be verified for the present copper-based materials. The present methodologies involve a conjunction of experimental and theoretical methods allowing for the determination of the usually eluding set of thermodynamic quantities ΔH, ρa and Va. In contrast with usual approaches, the latter are determined independently of assumptions about the structure of the adsorbents or separate characterization of their porous volumes. The results will be compared for the different materials and discussed in the perspective of hydrogen storage.
3. Results and discussion
The measured excess hydrogen adsorption isotherms for the Cu2(tptc) and Cu2(bptc) materials are presented in Fig. 1 and 2. The adsorption amounts are reported in specific units of milligrams of hydrogen per gram of solid adsorbent. The qualitative behaviour of the isotherms as a function of temperature is common for supercritical adsorption in porous material.14,15 It can be seen that the excess adsorption uptake on Cu2(tptc) reaches a maximum of 70 mg g−1 at 50 K and about 7 bar. In comparison, on Cu2(bptc) it reaches a maximum value of 39 mg g−1 at 50 K and 5 bar. These excess uptakes decrease with increasing temperatures: at 77 K and about 30 bar, they are 55 mg g−1 and 34 mg g−1 for Cu2(tptc) and Cu2(bptc), respectively. Therefore, although the maximum adsorption is reduced on Cu2(bptc), it is steadier as a function of temperature, decreasing by only 13% on this material comparatively to 21% for Cu2(tptc) between 50 and 77 K. These observations can qualitatively be explained by an enhanced hydrogen affinity on Cu2(bptc) due to smaller pores.
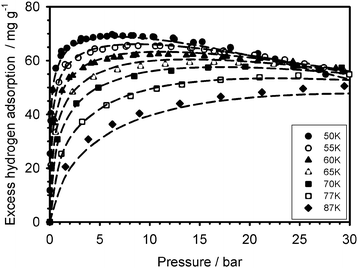 |
| | Fig. 1 Excess hydrogen adsorption isotherms measured (data points) on the Cu2(tptc) material over the 50–100 K range and modelled with the DA equation (dashed lines). | |
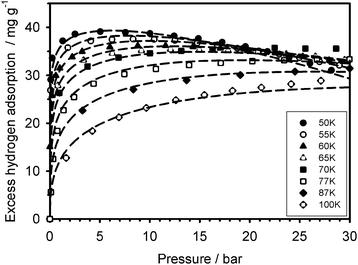 |
| | Fig. 2 Excess hydrogen adsorption isotherms measured (data points) on the Cu2(bptc) material over the 50–100 K range and modelled with the DA equation (dashed lines). | |
In order to get further insights on the hydrogen adsorption mechanism on these MOFs, the measurements were modelled using eqn (2) by performing two variable non-linear regressions on the sets of isotherms. The resulting parameters are presented in Table 1 and the corresponding model isotherms are superimposed on the Fig. 1 and 2 (dashed lines). The model represents well the measured isotherms with coefficients of determination R2 = 0.994 and 0.992 for Cu2(tptc) and Cu2(bptc), respectively. All parameters except α have relatively small uncertainties, below 5%. The comparatively lower R2 value on Cu2(bptc) is owed to some discrepancies in the high pressure region. In that respect, the high gas density regions will be investigated separately later in this section, allowing for some verification. The calculated adsorbed phase density (ρa) at 50 K is about 54 g L−1 for Cu2(bptc) and 59 g L−1 on Cu2(tptc). The limiting adsorption volumes are W(bptc)0 = 0.85 and W(tptc)0 = 1.32 mL g−1 on Cu2(bptc) and Cu2(tptc), respectively. These values are somehow higher than the porous volumes calculated in ref. 7 on the basis of crystallographic data (i.e.V(bptc)p = 0.68 mL g−1 and V(tptc)p = 1.08 mL g−1) possibly because of the additional contributions from hydrogen adsorbed at some defects and external surfaces. Yet, their ratios, W(bptc)0/W(tptc)0 ≅ V(bptc)p/V(tptc)p = 0.64 − 0.63, are in good agreement and correspond fairly well to that expected from their ligand lengths: (L(bptc)/L(tptc))3 ≅ 0.70, assuming a comparable geometry. Cu2(bptc) and Cu2(tptc) have roughly spherical pores.
Table 1 DA parameters extracted from the sets of measured excess isotherms
| Parameter |
Cu2(bptc)
|
Cu2(tptc)
|
| Value |
Error |
Value |
Error |
|
W
0/mL g−1 |
0.85 |
±0.02 |
1.32 |
±0.04 |
|
E/J mol−1 |
4132 |
±73 |
2971 |
±42 |
|
m (−) |
1.53 |
±0.05 |
2.08 |
±0.06 |
|
γ (−) |
3.06 |
±0.16 |
2.75 |
±0.14 |
|
α/K−1 |
≅0 |
<0.0005 |
0.0032 |
±0.0005 |
|
ρ
a
/g mL−1 |
0.054 |
±0.001 |
0.059 |
±0.002 |
The adsorption enthalpy values, calculated using eqn (4), are presented in Fig. 3–4 over a valid range of θ for the two adsorbents. It lies in magnitude between about 2–6 kJ mol−1 for Cu2(tptc) and 2–8 kJ mol−1 for Cu2(bptc), indicating physical types of interactions. For moderate fillings (θ < 0.5) and 50 K, the enthalpy is up to 1/3 larger on Cu2(bptc) than on Cu2(tptc). This result is conceivably a consequence of a more effective overlap of the potential wells inside the smaller pores. The diminution of ΔH with θ, particularly rapid for the material with smaller pores, may be due to a stronger variability in the energetic heterogeneity.20 This is in accordance with the smaller “m” value on Cu2(bptc), which can be associated to a more heterogeneous porosity.21 These observations imply that adsorption under such nanoscale confinement departs from a mechanism in which the interaction energy is constant as a function of the coverage (e.g. Langmuir model). The increase of ΔH with increasing temperature possibly reflects larger variations in the internal energy of the hydrogen molecules upon their adsorption. Note that the curve referred to as (Tind) on the Fig. 3 and 4 represents the temperature-independent part of eqn (4). Interestingly, the stronger solid–gas interactions on Cu2(bptc) do not translate into an enhanced ρa value. In fact, the latter is unexpectedly lower for Cu2(bptc). It could be noted that the 50 K excess maximum on Cu2(bptc) is reached at a pressure about 2 bar lower than on Cu2(tptc). This displacement to lower gas densities, apparently due to stronger solid–gas interactions, might had a detrimental effect on the ultimate adsorbed phase density.
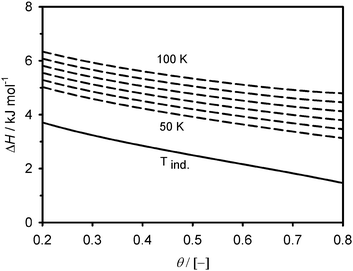 |
| | Fig. 3 Magnitude of the adsorption enthalpy as a function of the fractional filling on Cu2(tptc). The temperature-dependent curves are plotted with ΔT = 10 K temperature increments. | |
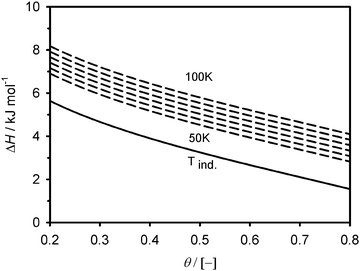 |
| | Fig. 4 Magnitude of the adsorption enthalpy as a function of the fractional filling on Cu2(bptc). The temperature-dependent curves are plotted with ΔT = 10 K steps. | |
The properties of the adsorbed phase near saturation can also be analyzed in detail by expressing the 50 and 55 K excess adsorption isotherms as a function of the gas density ρg as shown in Fig. 5 and 6. These curves clearly show the equilibrium shift of the excess maximum to lower gas density on the Cu2(bptc). It is also visible that past their maxima the excess isotherms decrease linearly as a function of ρg on both materials. This behaviour implies that Va is virtually constant with increasing pressure and hence, shows that an incompressible phase is formed as adsorption approaches saturation. This is reflected, as shown in Fig. 5 and 6, by excellent linear fits (dashed curves, R2 > 0.995) that could be used to calculate Va according to eqn (5). The corresponding Va values are about 1.40 ± 0.05 and 1.35 ± 0.05 mL g−1 for Cu2(tptc) as measured at 50 and 55 K. At the same temperatures, Va stays at about 0.85 ± 0.05 mL g−1 for Cu2(bptc). The adsorbed phase density ρa was calculated as ρa ≅ NexV−1a + ρg using the excess amounts and gas densities measured over the same regions. It ranges from about 55 to 57 ± 5 g L−1 for Cu2(tptc) between 50 and 55 K, respectively. Similarly, densities of 51 and 53 ± 5 g L−1 were found for Cu2(bptc) at the same temperatures. These values are comparable to those obtained by extrapolations down to Nex = 0 (also shown in Fig. 5 and 6), where the adsorbed phase is in equilibrium with a gas of the same density. This agreement reveals the consistency of the method. The error on these quantities stems mainly from the sensitivity of the approach in this high gas density region. All the measured ρa values fall into the range of liquid state values, which span from 38 to 75 g L−1 for bulk hydrogen.22,23 Both the accordance of ρa with these bulk values and the linearity of the excess isotherms near saturation show that the adsorbed hydrogen behaves like a liquid in these conditions. This behaviour seems to apply to all the adsorbed hydrogen as local density variations, which would be observable through deviations of linearity, are visibly small. The results extracted from these near-saturation data are in accordance with the previous micropore filling analysis, performed over extended sets of isotherms. In particular, a comparison of the Va values with the previously tabulated W0 ones reveals that the approximation Va ≅ W0 holds well, with about 10% differences. This correspondence indicates that the parameterized DA equations have correct limit behaviours. From the present standpoint, the quantity W0 can be seen as the volume of gas displaced at given (P,T) by a liquid. This observation offers new insights on the significance of the DA “micropore capacity”.24 The latter can be estimated as N0 = ρaW0 using values from Table 1. It is about 78 and 46 mg g−1 for Cu2(tptc) and Cu2(bptc), respectively, and roughly 15–20% more than the maximum excess uptakes at 50 K.
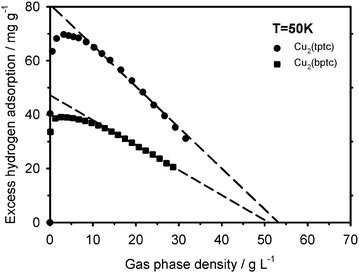 |
| | Fig. 5 Plot of the measured excess hydrogen adsorption as a function of the gas density up to the near-saturation region at 50 K. | |
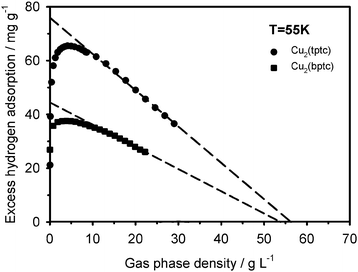 |
| | Fig. 6 Plot of the measured excess hydrogen adsorption as a function of the gas density up to the near-saturation region at 55 K. | |
4. Discussion and conclusions
The large hydrogen adsorption on the Cu-based MOFs, Cu2(bptc) and Cu2(tptc), at low temperatures, can be explained by a conjunction of relatively high measured adsorbed phase densities (ρa) and volumes (Va). The latter were found to correlate with the length of the ligands and correspond to the limiting volumes calculated from the DA analysis (i.e.Va ≅ W0). The differences in the amounts of adsorbed hydrogen in each sample are mainly due to variations in Va, and to a much smaller extent, by differences in ρa. Both quantities are favoured in the material with the longest ligands. On the other hand, the small diminution in pore width (less than 0.1 nm) on Cu2(bptc) leads to a significant enhancement in ΔH at low fillings, up to 33% over Cu2(tptc). Assuming the compounds have the same framework topology and only differ from the length of their bridging ligands, this increased affinity may be due to a rapid overlap of the potential wells on distances diminishing from about 0.7 to 0.6 nm. The excess maximum on Cu2(bptc) was found to occur at lower pressures and to be more stable in magnitude as a function of temperature. In that regard, the enhanced ΔH on this material might displace the phase equilibrium to lower densities and also prevent the adsorbed phase to dilute as the temperature increases. These stronger solid–gas interactions on Cu2(bptc), however, do not translate into an increased adsorbed phase density near saturation. Hence, the (P,T) conditions at which the excess maximum occurs may be improved to some extent by the smaller pores on Cu2(bptc), but at the cost of porous volume reduction while no gain is made in terms of ρa. Also, the range of ΔH values found, below 8 kJ mol−1, limits large hydrogen uptakes to the presented low temperatures. The above observations visibly expose some limitations of structural modifications for the optimization of physical adsorbents. Qualitatively, the behaviour of the excess adsorption isotherms with respect to pore size appears compatible with results presented by Bénard et al. for hydrogen adsorbed in different slit pores using a Grand Canonical Simulation approach.25 Despite their structural differences, both MOFs adsorb hydrogen, near saturation, under an incompressible phase whose density ranges over values (i.e. ∼50–60 g L−1) consistent with that of the bulk liquid. These common liquid state characteristics illustrate the importance of repulsive forces and quantum effects as possible limiting factors for molecular hydrogen storage under the present conditions.6 The present observations can be compared with those made on IRMOF-1. The pore sizes on the present samples are about half those found on IRMOF-1, on which they reach up to 1.5 nm.26 With larger pores, IRMOF-1 can store hydrogen under an adsorbed phase density of about 69 g L−1 at 50 K and 10 bar.5 From the present standpoint, this high density in the upper range of the bulk liquid suggests that IRMOF-1 might approach a maximum in term of packing density of molecular hydrogen at supercritical temperatures. To predict hydrogen storage uptakes on various adsorbents, it is usual to look for correlations between amounts adsorbed and surface areas or porous volumes.27 Considering the above-mentioned results, it is apparent that the quantity ρa can vary by up to 40% between different adsorbents. Such differences may thus be a significant cause of variability in trends relating adsorption uptakes with structural properties. In view of the adsorption thermodynamic properties of the presented MOFs, one may conclude that a reduction in the framework weight may be needed to increase the gravimetric capacity of MOFs under the present (P,T) operating conditions. Qualitative changes in the nature of the solid–gas interactions may be required to improve such systems beyond the identified thermodynamic limitations.
Acknowledgements
The authors wish to thank Dr Xiang Lin and Prof. Martin Schröder (University of Nottingham, UK) for providing us with the MOFs samples.
References
- M. Felderhoff, C. Weidenthaler, R. von Helmolt and U. Eberle, Phys. Chem. Chem. Phys., 2007, 9, 2643–2653 RSC.
- A. G. Wong-Foy, A. J. Matzger and O. M. Yaghi, J. Am. Chem. Soc., 2006, 128, 3494–3495 CrossRef CAS.
- S. S. Kaye, A. Dailly, O. M. Yaghi and J. R. Long, J. Am. Chem. Soc., 2007, 129, 14176–14177 CrossRef CAS.
- W. Zhou, H. Wu, M. R. Hartman and T. Yildirim, J. Phys. Chem. C, 2007, 111, 16131–16137 CrossRef CAS.
- E. Poirier and A. Dailly, J. Phys. Chem. C, 2008, 112, 13047–13052 CrossRef CAS.
- E. Poirier and A. Dailly, Nanotechnology, 2009 Search PubMed , in press.
- X. Lin, J. Jia, X. Zhao, K. M. Thomas, A. J. Blake, G. S. Walker, N. R. Champness, P. Hubberstey and M. Schröder, Angew. Chem., Int. Ed., 2006, 45, 7358–7364 CrossRef.
- D. J. Collins and H.-C. Zhou, J. Mater. Chem., 2007, 17, 3154–3160 RSC.
-
F. Rouquerol, J. Rouquerol and K. Sing, Adsorption by Powders and Porous Solids, Academic Press, London, 1999 Search PubMed.
- H. Frost and R. Q. Snurr, J. Phys. Chem. C, 2007, 111, 18794–18803 CrossRef CAS.
- V. K. Peterson, Y. Liu, C. M. Brown and C. J. Kepert, J. Am. Chem. Soc., 2006, 128, 15578–15579 CrossRef CAS.
- B. Panella, M. Hirscher, H. Pütter and U. Müller, Adv. Funct. Mater., 2006, 16, 520–524 CrossRef CAS.
- T. Düren, F. Millange, G. Férey, K. S. Walton and R. Q. Snurr, J. Phys. Chem. C, 2007, 111, 15350–15356 CrossRef.
- E. Poirier, R. Chahine, P. Bénard, L. Lafi, G. Dorval-Douville and P. A. Chandonia, Langmuir, 2006, 22, 8784–8789 CrossRef CAS.
- P. Bénard and R. Chahine, Langmuir, 2001, 17, 1950–1955 CrossRef CAS.
- D. Ramirez, S. Qi, M. J. Rood and K. J. Hay, Environ. Sci. Technol., 2005, 39, 5864–5871 CrossRef CAS.
- K. A. G. Amankwah and J. A. Schwarz, Carbon, 1995, 33, 1313–1319 CrossRef CAS.
- S. Ozawa, S. Kusumi and Y. Ogino, J. Colloid Interface Sci., 1976, 56(1), 83–91 CrossRef CAS.
- P. G. Menon, Chem. Rev., 1968, 68, 277–294 CrossRef CAS.
- A. Chakraborty, B. B. Saha, S. Koyama and K. C. Ng, Appl. Phys. Lett., 2006, 89, 171901 CrossRef.
- Y. H. Hu and E. Ruckenstein, Chem. Phys. Lett., 2006, 425, 306–310 CrossRef CAS.
- J. Y. Lee, J. Li and J. Jagiello, J. Solid State Chem., 2005, 178, 2527–2532 CrossRef CAS.
-
E. W. Lemmon, A. P. Peskin, M. O. McLinden and D. G. Friend, NIST12 Thermodynamic and Transport Properties of Pure Fluids - NIST Standard Reference Database 23, Version 8.0, U.S. Secretary of Commerce, Washington DC, 2007 Search PubMed.
-
K. S. W. Sing, in Physical Adsorption: Experiment, Theory and Applications, ed. J. Fraissard and C. W. Conner, Kluwer Academic Publishers, Dordrecht, The Nethelands, 1997, p. 15 Search PubMed.
- P. Bénard, R. Chahine, P. A. Chandonia, D. Cossement, G. Dorval-Douville, L. Lafi, P. Lachance, R. Paggiaro and E. Poirier, J. Alloys Compd., 2007, 446–447, 380–384 CrossRef CAS.
- H. Li, M. Eddaoudi, M. O'Keeffe and O. M. Yaghi, Nature, 1999, 402, 276–279 CrossRef CAS.
- K. M. Thomas, Catal. Today, 2007, 120, 389–398 CrossRef CAS.
|
| This journal is © The Royal Society of Chemistry 2009 |
Click here to see how this site uses Cookies. View our privacy policy here. 


 relates to the volumetric expansion of the adsorbed phase.18 The temperature dependent-part of eqn (4) was found to be non-negligible.14 The γ parameter, specific to the solid–gas system, is likely to be associated to the internal degrees of freedom of the adsorbate. Eqn (4) can represent the heat evolving as adsorption occurs over a range of filling corresponding to realistic operating conditions of a hydrogen storage system.


