Exploring the use of electrochemical impedance spectroscopy (EIS) in microbial fuel cell studies
Zhen
He
and
Florian
Mansfeld
*
Corrosion and Environmental Effects Laboratory (CEEL), The Mork Family Department of Chemical Engineering and Material Sciences, University of Southern California, Los Angeles, CA 90089-0241. E-mail: mansfeld@usc.edu.; Fax: (+213) 740-7797; Tel: (+213) 740-3016
First published on 14th November 2008
Abstract
Electrochemical impedance spectroscopy (EIS) is a powerful nondestructive technique that can act as a beneficial addition to the current techniques for studying microbial fuel cells (MFCs). Its application in MFC research should be further explored in the analysis of the internal resistance of MFCs, electrode materials, catalyst coatings on electrodes, biofilm development and electrochemical reactions on the anodes and the cathodes of MFCs.
 Zhen He Zhen He | Dr Zhen He is a postdoctoral research associate at the University of Southern California. He received his BS (2000) from Tongji University, MS (2003) from Technical University of Denmark and PhD (2007) from Washington University in St. Louis, all in environmental engineering. His research focuses on environmental biotechnology and bioenergy production. Since 2004, Dr He has been working on the investigation of microbial fuel cells using biological and electrochemical techniques and the development of microbial fuel cell reactors for wastewater treatment. |
 Florian Mansfeld Florian Mansfeld | Dr Mansfeld received his BS in Physics (1960) and MS (1964) and PhD (1967) in Physical Chemistry, all from the University of Munich, Germany. Since 1985 he has been Professor of Materials Science at the University of Southern California. In 1994 he became a Fellow of NACE and in 1995 he was named Fellow of The Electrochemical Society. He is a Past-Chairman of the Corrosion Division of The Electrochemical Society and a member of the Research Committee of NACE. Dr Mansfeld is also an ISI Highly Cited Researcher in Materials Science. |
Broader contextBioenergy production via microbial fuel cells (MFCs) is of great interest because of their potential applications in wastewater treatment, bioremediation, biosensors, production of valuable compounds and the possibility to provide power for remote electronic devices. MFCs are bio-electrochemical reactors in which different types of fuels (organic or inorganic) are converted into electric energy through microbial metabolism. A better understanding of the factors that determine the power output is a key to further improve the performance of different MFCs. Electrochemical impedance spectroscopy (EIS), which has been shown to be a very powerful technique in many areas, has many advantages in analyzing the limiting factors in MFCs. The use of EIS in MFC studies is still in its early stages and there is much potential to be explored. Hence, it is necessary to clarify the available methods for the collection and analysis of EIS data and to provide suggestions for MFC researchers to employ EIS in their studies. We believe that EIS coupled with other electrochemical or biochemical measurements will help to provide a better understanding of the different limiting factors in MFCs and allow us to optimize the design and operation of MFCs for power production. |
Introduction
Microbial fuel cell (MFC) technology has drawn increasing attention in the past decade due to an increased concern about the global energy crisis. In particular, using MFCs to convert organics and inorganic matter into electricity is of great interest for waste/wastewater treatment and powering of remote sensors.1,2 MFCs are bio-electrochemical reactors in which microbes oxidize fuel and produce electrons at the anode, and terminal electron acceptors (e.g. O2) are reduced by accepting these electrons at the cathode (Scheme 1). Electron flow through the external circuit generates current. The details of MFC theory and operation can be found in previous review articles.3,4 Research has been carried out to understand bacterial metabolism on electrodes, examine different substrates, select optimal electrode/catalyst materials and optimize reactor configurations.4 One of the key issues in MFC studies is to investigate biological and/or abiotic factors that limit power output, understand and overcome them. These limiting factors can be represented by the internal resistance (Rin) of a MFC, or reflected by the impedance of its individual electrodes. Rin consists of three components: activation (charge transfer) resistance, ohmic resistance (Rs, also called solution resistance, representing the resistance from solution, electrode materials and membrane) and concentration (diffusion) resistance. Descriptions of these three resistances and their effects on the performance of MFCs have been addressed in previous reviews.4,5 Either Rin or the impedance of an individual electrode can be measured by electrochemical impedance spectroscopy (EIS).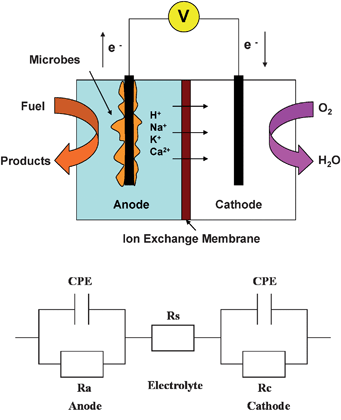 | ||
| Scheme 1 The schematic of a MFC and its equivalent circuit: Rs – solution resistance (ohmic resistance), Ra – anodic polarization resistance, Rc – cathodic polarization resistance and CPE – constant phase element. | ||
EIS is a powerful tool to study chemical and physical processes in solutions as well as in solids. For its fundamental theory, we refer to the well-known textbook “Impedance Spectroscopy – Theory, Experiment and Applications” edited by Barsoukov and Macdonald.6EIS has been applied to study different corrosion processes, batteries and fuel cells for many years.7,8 But only recently, EIS was adopted by MFC researchers to analyze Rin9 and its application in MFC studies requires further clarification. In the following, we will briefly introduce its measurement process and data analysis procedure for MFC applications.
EIS measurement and data presentation
EIS measurement is a fairly simple procedure that is conducted using instruments such as potentiostats that have EIS functions. A MFC can be connected to a potentiostat in either a three-electrode mode or a two-electrode mode, depending on the purpose of the measurement. The three-electrode mode is used to analyze an individual electrode. The anode or cathode is used as the working electrode, while the other electrode functions as a counter electrode. The third lead is attached to a reference electrode (e.g.Ag/AgCl) that has been placed in the anode and/or cathode compartment. The two-electrode mode is used to measure Rin of the whole cell at an applied cell voltage. One electrode serves as the working electrode and the other acts as both reference and counter electrode. No additional reference electrode is needed in the two-electrode mode. The potentiostat can be programmed (under EIS function) to determine impedance spectra in a wide frequency range such as from 100 kHz to 1 mHz. For MFC studies, 1 or 5 mHz should be sufficient as the lower frequency limit to provide accurate information. The scan time from 100 kHz to 1 mHz is about 3 h. A small ac signal (e.g. 10 mV amplitude) is applied during the measurement to stimulate the current response from the MFC without affecting its performance. Impedance spectra are collected at a constant applied potential – either the corrosion potential Ecorr or open-circuit potential (OCP).The results of the impedance measurement can be presented in two common ways: the complex plane plot (also called Nyquist plot or Cole–Cole plot) and the Bode plot. Fig. 1(a) shows a complex plane plot for the anode of the MFC shown in Scheme 1 (the cathode impedance can be measured and explained in a similar way as the anode). It expresses the impedance with a real part (plotted on the X-axis) and an imaginary part (plotted on the Y-axis that is negative) as a semicircle. Each point on the complex plane plot represents the impedance at a certain frequency. The impedance at the high frequency limit is the ohmic resistance Rs and the diameter of the semicircle is Rp. Rp is the polarization resistance (or charge transfer resistance), which is affected by the kinetics of the electrode reactions. A shortcoming of the complex plane plot is that it does not show the values of the frequency of the applied ac signal and the phase angle. The Bode plot, on the other hand, shows the information of impedance, frequency and phase angle. Fig. 1b is the Bode plot for the data in Fig. 1a. The axes of both impedance modulus |Z| and frequency f are logarithmic. The low- and high-frequency data can be easily determined from the plot, representing Rp + Rs and Rs, respectively.10 The difference between the low- and high-frequency data is Rp. A phase angle of −90° and an impedance slope of -1 indicate a pure capacitance, however under actual conditions both resistances and capacitances are present and thus the phase angle usually has values between 0 and −90°.
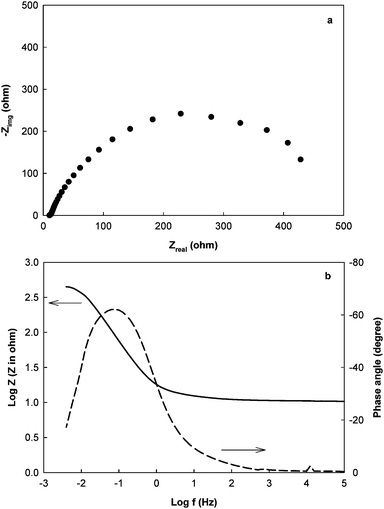 | ||
| Fig. 1 The impedance of the anode in a MFC using acetate solution as electrolyte: (a) the complex plan plot; (b) Bode plot.24 | ||
Accurate results are obtained by fitting the impedance data to an appropriate equivalent circuit (EC). ECs consist of common electric elements, such as resistors, capacitors and inductors. A simple EC used for describing the electrochemical properties of the MFC is shown in Scheme 1, which has elements: Rs – solution resistance (ohmic resistance), Ra – anodic polarization resistance, Rc – cathodic polarization resistance and C – capacitance. The sum of Ra, Rc and Rs will be Rin. Ra in parallel with C represents the anode. A constant phase element (CPE) usually substitutes the capacitance in ECs because of the inhomogeneous conditions (e.g.electrode roughness, coating, and distribution of reaction rate).11 A Warburg element may be added in parallel to Ra or Rc to represent a simple diffusion situation (Randles circuit). ECs can become more complicated by adding more elements with multiple sets of R–C (time constants), according to the complexity of the system. One or two time constants are usually sufficient to interpret the impedance data for most cases in MFC studies. Data fitting is accomplished by appropriate software, such as ANALEIS developed at CEEL.12 Some potentiostat manufacturers allow the users to build their own ECs and perform fitting/simulation using the software which is part of the potentiostats.
Analysis of Rin using EIS
The initial purpose of EIS application in MFC studies was to measure the value of Rin because it provides more comprehensive information than the earlier methods.8,9,13–15 The methods used to determine Rin in the early studies were the calculation based on Ohm's law or the current interruption method, both of which determine the ohmic resistance.3,5 In a system where the ohmic resistance is dominant, such as a PEM fuel cell, these methods can be employed as a simple and easy method to efficiently measure Rin. However, MFCs are bio-electrochemical systems in which microbial activities play an important role and these are associated with activation and concentration resistances. Under such conditions, the polarization resistance (or charge transfer resistance) becomes very important and both Ohm's law and current interruption methods are not able to accurately evaluate Rin.EIS can determine the values of Rin and the contribution of its components. In a tubular air–cathode MFC, it was found that 51.1% of Rin was the ohmic resistance, while the charge transfer resistance contributed 22.6% and the rest was due to diffusion effects.15 In some MFCs, the polarization resistance was several orders of magnitude larger than the ohmic resistance.16 A detailed study that used EIS to evaluate Rin of MFCs was conducted by Manohar et al.17 who measured Rin of a two-chamber MFC under four different conditions as a function of cell voltages (Fig. 2). Their results showed that Rin was much larger without bacterium than that when bacteria were present in the anolyte. Adding stainless steel balls into the anode compartment reduced Rin and increased the power output because of the increased electrode surface area. Under all conditions, Rin decreased as the cell voltage decreased (the cell current increased). In the authors' previous study, the external resistances (Rex) were computed as a function of cell voltage using P–V curves and compared with the corresponding Rin values. The results proved that the maximum power occurred when Rin equaled Rex.16
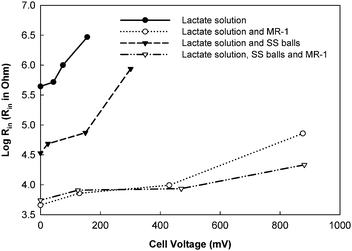 | ||
| Fig. 2 The dependence of Rin on cell voltage in a two-chamber MFC under four difference conditions.17MR-1: Shewanella oneidensis; SS balls: stainless steel balls. | ||
Analysis of individual electrodes using EIS
The EIS measurement of an individual electrode provides information that allows analyzing electrochemical reactions on electrodes, bacterial metabolism, as well as surface and material properties of electrodes, which are critical to the understanding of the electricity-generating process and the improvement of the power output of MFCs. A few studies have incorporated the EIS technique to investigate some of these aspects of their MFCs, but more research is undoubtedly needed.Electrode materials or coating layers can cause variation in polarization resistance. The impedance of different electrode materials tested in MFCs showed that, compared with metal electrodes, carbon cloth electrode exhibited a much lower polarization resistance and thus were able to deliver more power by reducing the loss at the electrode-solution interface.18 The performance of metal electrodes can be improved by coatings. Qiao et al.19 reported that adding carbon nanotubes into conducting polymer – polyaniline that coated a nickel electrode could reduce the charge transfer resistance. Their EIS results indicated that a higher loading rate of carbon nanotubes further decreased the charge transfer resistance and improved the reaction rate at the electrode, as well as electricity production in MFCs. Similarly, coating electrodes with catalysts will also reduce the polarization resistance and increase the capacitance. In Fig. 3, the low-frequency region of the spectra shows that the polarization resistance of a Pt-coated cathode (the base material is carbon fiber) is much lower than that of the anode made from the same material (without Pt coating), indicating that the rate of oxygen reduction on the cathode is faster than the rate of lactate oxidation on the anode. The cathode capacitance is much higher than that of the anode, due to the higher active surface area.
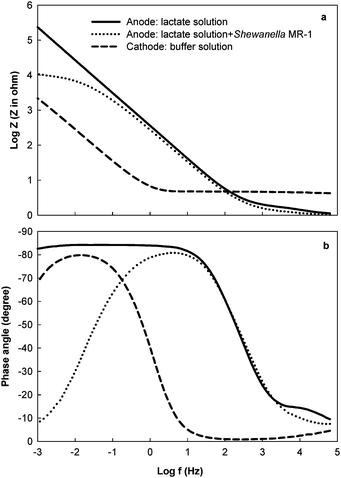 | ||
| Fig. 3 The impedance of the anode in the absence and presence of Shewanella oneidensisMR-1 in a two-chamber MFC, and the cathode with Pt catalyst: (a) impedance modulus; (b) phase angle.17 | ||
A more common “coating layer” on the electrodes of MFCs is a biofilm. By adding Shewanella oneidensisMR-1 into a lactate solution, Manohar et al.20 found that the polarization resistance of the anode of a MFC decreased from 7.79 MΩ to 10.2 KΩ and the phase angle reached values close to 0° at the lowest frequency (Fig. 3). The authors concluded that bacteria formed a biofilm on the surface of the electrode and their metabolism using lactate reduced the anodic polarization resistance. A similar study was conducted with Geobacter sulfurreducens, in which EIS data showed a decreased polarization resistance and an increased capacitance in the presence of bacteria, indicating the establishment of a conductive biofilm and a larger surface area due to biofilm.21EIS can also be used to examine the progress of biofilm formation as a function of time. A recent study collected the impedance of the anode on days 1 and 5 and after 3 weeks and reported that the polarization resistance decreased from 2.61 to 0.48 kΩcm2 within three weeks, implying that biofilm development improved the kinetics of the electrochemical reactions.22
EIS has been adopted to investigate and understand the effect of experimental conditions on electrochemical reactions. In a rotating cathode MFC, the anodic polarization resistance was increased from 28 to 65 Ω when the cathode electrode was rotating compared with non-rotating cathode, suggesting that rotation increased the concentration of dissolved oxygen that had a negative effect on the anodic bacterial metabolism.23 Meanwhile, the ohmic resistance slightly decreased from 50 to 40 Ω, possible due to a better ion transport by the mixing of water during the rotation. In another study, EIS was used to analyze the individual electrodes with different electrolyte pH in an air–cathode MFC.24 In such a system, the electrolyte pH affects both the anodic and cathodic reactions. It was found that the anodic polarization resistance was the lowest at pH 7, while the cathodic polarization resistance decreased with the increasing electrolyte pH from 5 to 10 (Fig. 4). These results confirmed that the anodic bacterial activity was optimal at a neutral pH and the electrochemical reaction on the cathode electrode was improved at a higher pH (within the test range).
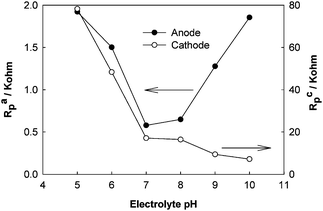 | ||
| Fig. 4 The polarization resistances of the anode and the cathode of an air–cathode MFC as a function of electrolyte (acetate solution) pH.24 | ||
Suggestions for future studies
EIS is an efficient tool to study electrode materials and MFC configurations; however, its use in MFC studies is still in its infancy. We expect a broader application of EIS in MFC studies in the near future. Herein we have made some suggestions of areas where the EIS technique may be well applied. Its application, however, is certainly not limited to the following examples.First, EIS can be used as an in situ tool to analyze electrochemical reactions and microbial metabolism on electrodes. Microorganisms are “biocatalysts” in MFCs and thus their metabolism affects the efficiency of the “food-to-electricity” process. Microbial reactions result in changes of the charge transfer resistance, which is affected by kinetically controlled electrochemical reactions and can be used as a parameter for the evaluation of microbial activities. Earlier studies have used EIS to investigate the interaction between bacteria and metal surfaces in corrosion processes.8 It will be very interesting to further develop this approach to understand the interaction between microorganisms and electrodes during the electricity generating process, and the kinetics of reactions or bacterial metabolism on electrodes.
Second, EIS can be employed to study the effect of electron mediators on electrochemical reactions, which is one of the questions that have not been well understood. Adding artificial electron mediators will improve electrochemical reactions on electrodes that will be detected using EIS. However, to develop mediator-less MFCs has been a common goal and thus more and more research focuses on endogenous electron mediators that are excreted by bacteria. Under properly designed experimental conditions, EIS may be used as a sensor. The production of these mediators can be quantitatively determined by the values of the impedance at certain frequencies. A similar application has been successful in DNA biosensors,7 but there have not been any reports from MFC studies.
Third, EIS can be used for quality control in fabricating electrode catalyst layers or monitoring biofilm development. The optimal catalyst loading can be determined by measuring the polarization resistance. The formation of catalyst layers on the surface of electrodes increases the capacitance due to the larger active surface area (Fig. 3). Hence, by analyzing both polarization resistance and capacitance, we can obtain the desired catalyst loading and structure. Likewise, EIS provides information as an indicator of biofilm formation, which will allow monitoring and control of biofilm development for different experimental conditions (e.g. substrates, flow rate, temperature and pH).
Fourth, EIS may help to improve the design of electrodes. The electrodes of MFCs are three-dimensioned structures. Not only do they have high surface area, but they also need to allow liquid to flow through pores and microbes to form biofilms. There has not been a single technique that can fully evaluate the properties of these electrodes. EIS, though still not able to do this alone, may be a beneficial supplement assisting the current techniques to examine the performance of electrodes through the measurement of reaction kinetics and capacitance.
Last but not least, EIS can be used to study diffusion processes (concentration resistance). Diffusion effects have not been a major issue for lab scale MFCs. You et al.13 found that diffusion effects contributed 21–27% of Rin in their upflow air–cathode MFCs and the ohmic resistance was dominant (51–60%). However, in large scale MFCs, especially the ones with the packed bed electrodes,9,25 the transport and distribution of substrates become very important. Uneven distribution of substrates within the MFC compartments will form “dead zones”. As a result, part of the electrode may not attract functional microbes and thus the efficiency of MFCs will be decreased. EIS may potentially allow detecting and understanding of diffusion effects.
Conclusions
EIS is an important, efficient and convenient tool to analyze bio-electrochemical processes in MFCs. It provides information for characterizing electrode interfaces, analyzing electrochemical reactions, monitoring biofilm development, examining different experimental conditions and bacterial interaction with electrodes. However, MFCs are complex bio-electrochemical systems, which will not be completely understood by means of any single technique. EIS is no exception to this. The design of a proper equivalent circuit and the interpretation of experimental data require previous information with respect to biochemical pathways and physical and mechanistic phenomena occurring in a MFC. Thus, the application of EIS must be combined with other analytic methods, such as cyclic voltammetry26 and biochemical measurements.4 Although the details of many future applications remain unknown, MFC researchers are encouraged to explore its use. We believe that this technique will improve our understanding of the electricity-generating process and its limiting factors in MFCs.Acknowledgements
The authors would like to thank Yuelong Huang and Aswin Manohar (CEEL, University of Southern California) for assisting in the preparation of EIS figures. We also thank anonymous reviewers for helpful comments.References
- L. T. Angenent, K. Karim, M. H. Al-Dahhan, B. A. Wrenn and R. Domiguez-Espinosa, Trends Biotechnol., 2004, 22, 477–485 CrossRef CAS.
- D. R. Lovley, Nat. Rev. Microbiol., 2006, 4, 497–508 Search PubMed.
- A. Rinaldi, B. Mecheri, V. Garavaglia, S. Licoccia, P. Di Nardo and E. Traversa, Energy Environ. Sci., 2008, 1, 417–429 RSC.
- B. E. Logan, B. Hamelers, R. A. Rozendal, U. Schroder, J. Keller, S. Freguia, P. Aelterman, W. Verstraete and K. Rabaey, Environ. Sci. Technol., 2006, 40, 5181–5192 CrossRef CAS.
- P. Clauwaert, P. Aelterman, T. H. Pham, L. De Schamphelaire, M. Carballa, K. Rabaey and W. Verstraete, Appl. Microbiol. Biotechnol., 2008, 79, 901–913 CrossRef CAS.
- E. Barsoukov, J. R. Macdonald, Impedance spectroscopy theory, experiment, and applications, 2nd edn, Wiley-Interscience, Hoboken, NJ, 2005 Search PubMed.
- E. Katz and I. Willner, Electroanalysis, 2003, 15, 913–947 CrossRef CAS.
- F. Mansfeld, Electrochim. Acta, 2007, 52, 7670–7680 CrossRef CAS.
- Z. He, N. Wagner, S. D. Minteer and L. T. Angenent, Environ. Sci. Technol., 2006, 40, 5212–5217 CrossRef CAS.
- F. Mansfeld and M. W. Kendig, Werkstoffe und Korrosion-Materials and Corrosion, 1983, 34, 397–401 Search PubMed.
- C. H. Hsu and F. Mansfeld, Corrosion, 2001, 57, 747–748 Search PubMed.
- F. Mansfeld in Analytical Methods in Corrosion Science and Engineering, ed. P. Marcus, F. Mansfeld, CRC Press, 2005; p. 463 Search PubMed.
- S. J. You, Q. L. Zhao, J. Zhang, H. Liu, J. Q. Jiang and S. Q. Zhao, Biosens. Bioelectron., 2008, 23, 1157–1160 CrossRef CAS.
- Y. Z. Fan, H. Q. Hu and H. Liu, J. Power Sources, 2007, 171, 348–354 CrossRef CAS.
- S. J. You, Q. L. Zhao, J. N. Zhang, J. Q. Jiang, C. L. Wan, M. A. Du and S. Q. Zhao, J. Power Sources, 2007, 173, 172–177 CrossRef CAS.
- A. K. Manohar, O. Bretschger, K. H. Nealson and F. Mansfeld, Bioelectrochemistry, 2008, 72, 149–154 CrossRef CAS.
- A. K. Manohar and F. Mansfeld, Electrochim. Acta DOI:10.1016/j.electacta.2008.06.047.
- S. Ouitrakul, M. Sriyudthsak, S. Charojrochkul and T. Kakizono, Biosens. Bioelectron., 2007, 23, 721–727 CrossRef CAS.
- Y. Qiao, C. M. Li, S. J. Bao and Q. L. Bao, J. Power Sources, 2007, 170, 79–84 CrossRef CAS.
- A. K. Manohar, O. Bretschger, K. H. Nealson and F. Mansfeld, Electrochim. Acta, 2008, 53, 3508–3513 CAS.
- S. Srikanth, E. Marsili, M. C. Flickinger and D. R. Bond, Biotechnol. Bioeng., 2008, 99, 1065–1073 CrossRef CAS.
- R. P. Ramasamy, Z. Ren, M. M. Mench and J. M. Regan, Biotechnol. Bioeng., 2008, 101, 101–108 CrossRef CAS.
- Z. He, H. Shao and L. T. Angenent, Biosens. Bioelectron., 2007, 22, 3252–3255 CrossRef CAS.
- Z. He, Y. Huang, A. K. Manohar and F. Mansfeld, Bioelectrochemistry, 2008, 74, 78–82 CrossRef CAS.
- P. Clauwaert, D. Van der Ha, N. Boon, K. Verbeken, M. Verhaege, K. Rabaey and W. Verstraete, Environ. Sci. Technol., 2007, 41, 7564–7569 CrossRef CAS.
- K. Fricke, F. Harnisch and U. Schröder, Energy Environ. Sci., 2008, 1, 144–147 RSC.
| This journal is © The Royal Society of Chemistry 2009 |
