Rhodanine dyes for dye-sensitized solar cells![[thin space (1/6-em)]](https://www.rsc.org/images/entities/h2_char_2009.gif) :
:![[thin space (1/6-em)]](https://www.rsc.org/images/entities/h2_char_2009.gif) spectroscopy, energy levels and photovoltaic performance†
spectroscopy, energy levels and photovoltaic performance†
Tannia Marinadoa, Daniel P. Hagbergb, Maria Hedlundc, Tomas Edvinsson‡a, Erik M. J. Johanssonc, Gerrit Boschloo§a, Håkan Rensmoc, Tore Brincka, Licheng Sun*b and Anders Hagfeldt§*a
aCenter of Molecular Devices, Royal Institute of Technology, School of Chemical Science and Engineering, Physical Chemistry, 100 44, Stockholm, Sweden. E-mail: anders.hagfeldt@fki.uu.se
bCenter of Molecular Devices, Royal Institute of Technology, School of Chemical Science and Engineering, Organic Chemistry, 100 44, Stockholm, Sweden. E-mail: lichengs@kth.se
cDepartment of Physics, Uppsala University, Box, 530, SE-751 21, Uppsala, Sweden
First published on 7th November 2008
Abstract
Three new sensitizers for photoelectrochemical solar cells were synthesized consisting of a triphenylamine donor, a rhodanine-3-acetic acid acceptor and a polyene connection. The conjugation length was systematically increased, which resulted in two effects: first, it led to a red-shift of the optical absorption of the dyes, resulting in an improved spectral overlap with the solar spectrum. Secondly, the oxidation potential decreased systematically. The excited state levels were, however, calculated to be nearly stationary. The experimental trends were in excellent agreement with density functional theory (DFT) computations. The photovoltaic performance of this set of dyes as sensitizers in mesoporous TiO2 solar cells was investigated using electrolytes containing the iodide/triiodide redox couple. The dye with the best absorption characteristics showed the poorest solar cell efficiency, due to losses by recombination of electrons in TiO2 with triiodide. Addition of 4-tert butylpyridine to the electrolyte led to a strongly reduced photocurrent for all dyes due to a reduced electron injection efficiency, caused by a 0.15 V negative shift of the TiO2 conduction band potential.
1. Introduction
At present there is a strong interest in developing metal free sensitizers for substitution of conventional ruthenium complexes1–5 in dye sensitized solar cells (DSCs). Organic sensitizers have the advantage of high extinction coefficients and can thus also meet the demand of good light harvesting efficiency with thinner TiO2 films. New less volatile redox systems such as ionic liquids6–9 and hole conductors10–12 demand thinner TiO2 films because of mass transport limitations or insufficient pore filling. A great variety of organic sensitizers based on polyene- triphenylamine,13–19 coumarin,20–22 and indoline23–26 moieties give respectable conversion efficiencies of 5–9% with the traditional iodide/triiodide redox system. However, still a better fundamental understanding of the energetic, kinetic and geometric interplay between the oxide/dye/electrolyte constituents is needed to be able to design new efficient and stable organic sensitizers for future devices.Here we present a study on three sensitizers, with a general structure donor–linker–acceptor, D–L–A, where the triphenylamine moiety acts as an electron donor and rhodanine-3-acetic acid moiety as an acceptor. The linker conjugation is systematically changed with methine and thiophene units to increase the spectral response. The dyes will be referred to as L0, L1 and L2, respectively, according to the linker length, see Fig. 1. The rhodanine-3-acetic acid anchoring group has shown very promising efficiencies for coumarin and indoline dyes23–25 and also recently for triphenylamine based dyes by Liang and Tian et al.27,28
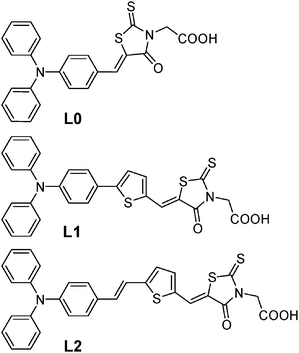 | ||
| Fig. 1 Molecular structure of the sensitizers used in this study: L0, L1 and L2. The number is related to the length of the conjugated linker between the triphenylamine and the rhodanine-3-acetic acid moieties. | ||
Spectroscopic and electrochemical properties were characterized experimentally and by density functional theory (DFT) computations. Photoelectron spectroscopy (PES) was used for element specific information on the electronic and molecular structure of the dye sensitized surface.29–32 The behavior of the dyes in functional solar cell devices was further investigated by current–voltage (IV), incident-photon-to-current-efficiency (IPCE), charge extraction, voltage and current decay measurements. For this series of dyes used in DSCs two main effects were studied and discussed: (i) the dependence of the linker conjugation length and (ii) the influence of the additive 4-tert-butylpyridine (4-TBP) on the overall solar cell performance for this series of dyes.
2. Experimental
2.1 Synthesis
The dyes were synthesized according to well known reactions; the detailed synthetic procedures are described in the ESI.† As a representative, the synthesis of L1 is illustrated in Scheme 1. Suzuki coupling of 4-(diphenylamino) bromobenzene and 5-formyl-2-thiophene-boronic acid under microwave irradiation provided compound 1. Condensation of the aldehyde moiety with rhodanine-3-acetic acid by the Knoevenagel reaction with excess amount of piperidine yielded L1′ as a precipitate which was filtered and washed with acetonitrile and water. The carboxylate-salt L1′ was dissolved in dichloromethane (DCM), washed with aq. HCl (1 M) and converted to the corresponding carboxylic acid L1.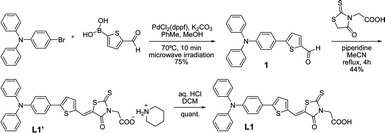 | ||
| Scheme 1 Synthetic route to dye L1. | ||
2.2 Dye-sensitized solar cells
Mesoporous TiO2 films (ca. 10 μm thick) were immersed in 500 μM dye solutions in acetonitrile for 12–14 h in room temperature, followed by immersion in pure acetonitrile for a few minutes and drying in an air flow. DSCs were further prepared using standard methods given in the ESI† and characterized using methods given there.3. Results and discussion
3.1 Spectroscopic and electrochemical characterization
The optical and electrochemical properties of the dyes in solution and adsorbed onto TiO2 are summarized in Table 1. A red-shift is observed with increasing the linker conjugation length; the absorption maxima in acetonitrile solution were observed at 459, 476 and 501 nm, for L0, L1 and L2, respectively. The corresponding molar extinction coefficients (εmax) were approximately 44![[thin space (1/6-em)]](https://www.rsc.org/images/entities/char_2009.gif) 000, 38
000, 38![[thin space (1/6-em)]](https://www.rsc.org/images/entities/char_2009.gif) 000 and 39
000 and 39![[thin space (1/6-em)]](https://www.rsc.org/images/entities/char_2009.gif) 000 M−1 cm−1 for L0, L1 and L2, respectively, at absorption maximum. The high extinction coefficients of these dyes meet the requirements for solid state dye-sensitized solar cells, where thinner TiO2 films are used to obtain efficient devices.10
000 M−1 cm−1 for L0, L1 and L2, respectively, at absorption maximum. The high extinction coefficients of these dyes meet the requirements for solid state dye-sensitized solar cells, where thinner TiO2 films are used to obtain efficient devices.10
| Dye | λmax/nm | εb/M−1 cm−1 | λema/nm | ED/D+c/V vs. NHE | E(o−o)d/eV | ED*/D+e/V vs. NHE |
|---|---|---|---|---|---|---|
| a Absorption of dyes in acetonitrile solutioni, adsorbed onto TiO2ii, and emission spectra in acetonitrile.b Absorption coefficient in THF.c The ground state oxidation potential, ED/D+, of the dyes were measured with DPV under following conditions: working electrode; Pt, electrolyte; 0.1 M tetrabutylammonium hexafluorophosphate, TBA(PF6) in acetonitrile. Potentials measured vs. Fc+/Fc were converted to NHE by addition of +0.63 V.48d E(o−o) is estimated from the intercept of the normalized absorption and emission spectra in acetonitrile.e ED*/D+ is estimated by subtracting E(0−0) to ED/D+. | ||||||
| L0 | 459i, 438ii | 44 000 | 607 | 1.27 | 2.38 | −1.11 |
| L1 | 476i, 459ii | 38 000 | 668 | 1.15 | 2.19 | −1.04 |
| L2 | 501i, 469ii | 39 000 | 726 | 0.98 | 2.08 | −1.10 |
The ground state oxidation potential (ED/D+) of the dye is an important parameter when evaluating the driving force for regeneration of the oxidized dye via the redox system. The oxidation potential must be sufficiently more positive than the potential of the redox couple iodide/triiodide to obtain fast regeneration kinetics. Sluggish regeneration kinetics are unfavorable for the overall solar cell efficiency.31,33,34 The oxidation potentials of the dyes in solution were measured by differential pulse voltammetry (DVP) and showed a clear dependence on the conjugation length: EL0/L0+ > EL1/L1+ > EL2/L2+, see Table 1. Although the absolute values might differ slightly when the dyes are adsorbed onto TiO2, the internal trend is expected to be similar. As the redox potential of the iodide/triiodide electrolyte is about 0.3 V vs. NHE, the regeneration driving force can be calculated to 0.69, 0.85 and 0.97 V, for L2, L1 and L0, respectively. This may be compared to 0.70 V for the conventional N719 ruthenium complex (oxidation potential of 1 V vs. NHE).2 The estimated excited state potential, ED*/D+, calculated from ED/D+–E0−0, seems to be sufficiently more negative than the TiO2 CB edge for all three dyes and hence should in theory have enough driving force for effective injection, as reported in Table 1.
PES measurements of the valence structure of sensitized TiO2 reveals the HOMO energy levels of the adsorbed organic dyes, see Fig. 2. The results support the trend observed in the electrochemical measurements. When compared to PES data from adsorbed N719,30 the peak positions of the HOMO energy levels of L2, L1 and L0 are shifted towards higher binding energy by approximately 0.2, 0.3 and 0.4 eV, respectively. While only one feature can be resolved in the HOMO level measured for L0 and L1, the less symmetric peak obtained in the measurements of L2 indicates that more than one state may be involved in the HOMO level of L2.
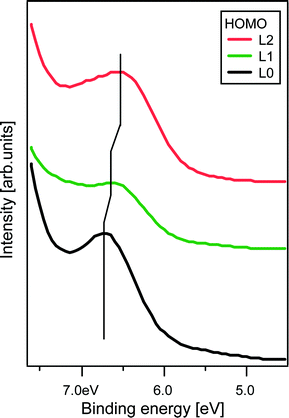 | ||
| Fig. 2 Photoelectron spectroscopy (PES) valence electronic structure of TiO2 sensitized with L0, L1 and L2. The measurement was performed with a photon energy of 100 eV. The energy scale was calibrated using the Ti3p peak of the TiO2 substrate. | ||
3.2 Quantum chemical calculations
In Table 2 we report experimental and computed absorption maxima for the lowest energy electronic transitions. Details of the quantum chemical calculations are given in the ESI.† Starting with the B3LYP and PBE1PBE gas phase results, we note that both methods provide a good prediction for λmax of the shortest dye, L0; the calculated wavelengths are 466 and 440 nm, respectively, which compares well with the experimental λmax of 459 nm for L0 in acetonitrile. However, the computations are not able to correctly predict the magnitude of the change in λmax going towards longer dyes. In going from L0 to L2 the energy of the absorption maximum decreases by 0.23 eV experimentally, whereas the computational methods predict a decrease of 0.53–0.54 eV. For example, our B3LYP calculation overestimates the energy of the absorption maximum of L2 in solution by 0.36 eV, whereas the PBE1PBE method does better with an overestimation of only 0.19 eV. The results are not surprising since TDDFT methods are known to underestimate the energies for charge-transfer states, and the underestimation generally increases with the distance of charge separation. The error can be partly reduced by the inclusion of Hartree–Fock exchange, which explains the slightly better performance of the PBE1PBE functional, as the latter includes more Hartree–Fock exchange than B3LYP. However, using the full Hartree–Fock exchange in the TDHF method leads to energies of the absorption maximum that are too low by 0.7–1.3 eV (data not shown here). Inclusion of solvent at the B3LYP and PBE1PBE levels using the PCM (polar continuum model) method generally reduces the transition energy by 0.21–0.23 eV. The gas phase results are, however, in better agreement with the experiments than the PCM results, for both the B3LYP and PBE1PBE methods. The reason for this is most likely a cancellation of errors; the underestimation of transition energies in the DFT calculations are partly compensated for by the higher transition energies in gas phase compared to solution. The computed oscillator strengths decrease slightly on going from L0 to the longer L1, which is in qualitative agreement with the experiments. The strong absorption calculated for L2 is not, however, supported by the experiments.| λmaxa/nm | εb/M−1cm−1 | λmaxc/nm | fd | λmaxe/nm | ff | |
|---|---|---|---|---|---|---|
| Dye | Exp. | Exp. | B3LYP | B3LYP | PBE1PBE | PBE1PBE |
| a Absorption maxima of dyes in acetonitrile solution at room temperature.b Absorption coefficient in THF.c TDDFT-B3LYP/6-31+G (d) computed vertical excitation wavelengths. (i) in acetonitrile using the PCM approach.d TDDFT-B3LYP/6-31+G (d) computed oscillator strengths.e TDDFT-PBE1PBE/6-31+G (d) computed vertical excitation wavelengths.f TDDFT-PBE1PBE /6-31+G (d) computed oscillator strengths. | ||||||
| L0 | 459 | 44 000 | 466, 510i | 0.89, 0.93i | 440, 476i | 0.95, 0.99i |
| L1 | 476 | 38 000 | 543, 605i | 0.88, 0.89i | 503, 553i | 0.94, 0.93i |
| L2 | 501 | 39 000 | 586, 653i | 1.22, 1.23i | 542, 596i | 1.35, 1.34i |
In Table 3, the experimental oxidation potentials are listed together with the computed oxidation potentials and reorganization energies. It can first be noted that the B3LYP and PBE1PBE methods yield oxidation potentials for all three dyes that are too positive by approximately 0.6 and 0.5 V, respectively. The relative position of the oxidation potentials within this group of dyes that are calculated are, however, in very good agreement with experiment. This indicates that the computations are able to reproduce differences in the oxidation properties between the dyes. It is interesting that the computed reorganization energy is almost identical for the three dyes. It is noted that the polyene diphenyl aniline cyanoacetic acid (D5), which showed high performance in solar cells reported by our group14 has a very similar calculated reorganization energy (0.97 eV).
| ΔED/D+a | ΔED/D+b | ΔED/D+c | λod/eV | |
|---|---|---|---|---|
| ED/D+[V vs. NHE]ii | ED/D+[V vs. NHE]ii | (ED/D+[V vs. NHE] ii) | (kcal mol−1) | |
| Dye | Exp. | B3LYP | PBE1PBE | |
| (i) The relative difference in ground oxidation potential, ΔED/D+, between the dyes normalized to the value for L0 and (ii) the absolute ground state oxidation potential, ED/D+vs. NHE ofa (exp) Dyes measured under following conditions; Working electrode; Pt, Electrolyte; 0.1 M tetrabutylammonium hexafluorophosphate, TBA(PF6) in acetonitrile. Potentials measured vs. Fc+/Fc were converted to NHE by addition of +0.63 V.48b (B3LYP) Values computed using equation. 1. at the PCM-B3LYP/6-31+G(d) level.c (PBE1PBE) Values computed at the PCM-PBE1PBE/6-31+G(d) level.d The electron-transfer reorganization energy computed using equation. 2 at the PCM-B3LYP/6-31+G(d) level. | ||||
| L0 | 0i (1.27)ii | 0i (0.73)ii | 0i (0.81)ii | 0.96 (22.1) |
| L1 | −0.12i (1.15)ii | −0.20i (0.53)ii | −0.19i (0.62)ii | 0.95 (22.0) |
| L2 | −0.29i (0.98)ii | −0.33i(0.40) | −0.30i (0.51)ii | 0.94 (21.6) |
Fig. 3 depicts the B3LYP computed LUMO orbitals of the dyes. In all three dyes the strongest absorption band is dominantly of HOMO–LUMO character, i.e. the expansion coefficient for the HOMO–LUMO transition is higher than 0.65. The electron redistribution of the orbitals indicates a charge separation upon electronic excitation. Both HOMO and LUMO are partially located on the conjugated system which supports the observed dependence of the oxidation potential upon the linker conjugation length. The LUMO orbital does not extend out to the carboxylate group that links the dye to the TiO2 surface, indicating a less strong electronic coupling between the dye LUMO and the acceptor states of TiO2 in comparison to for example cyanoacetic acid as anchoring group where the conjugation is extended out on the carboxylic group. In this context, it is also interesting to compare our results with the high efficiency indoline dye reported by Hourichi et al. using the same rhodanine-3-acetic acid anchoring group as in the present study.23,25,26 Our calculation of the indoline dye (not shown here) shows a lack of electron density of the LUMO on the anchoring group, which also suggests a less strong electronic coupling with TiO2 acceptor states.
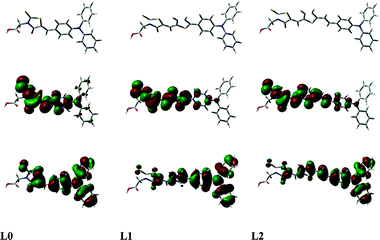 | ||
| Fig. 3 The frontier molecular orbitals of the HOMO (bottom) and LUMO (top) calculated with PCM-PBE1PBE/6-31+G(d) level. The electron redistribution of the orbitals shows a clear charge separation upon electronic excitation. | ||
3.3 Solar cell performance
The photovoltaic performance of solar cells based on L0, L1 and L2 dyes under AM 1.5G illumination, 100 mW cm−2, is summarized in Table 4. The efficiencies obtained with solar cells with electrolyte 1 (0.5 M LiI and 0.05 M I2 in acetonitrile) were η = 2.7% for L0, η = 2.3% for L1 and η = 1.7% for L2, showing that higher efficiencies were obtained for the dyes with a shorter conjugation length. In order to improve the open-circuit potential (VOC), 0.5 M 4-tertbutylpyridine (4-TBP) was added to the electrolyte. Although this gave rise to a modest increase of VOC by about 0.1 V, a dramatic decrease of the short-circuit current density (JSC) was observed, resulting in lower overall solar cell efficiencies.| Conditionsa | η/% | Voc/V | JSC/mA cm−2 | ff |
|---|---|---|---|---|
| a The TiO2 film thickness was ∼10 μm. Electrodes were dyed during 15 h in 500 μM dye solutions in acetonitrile. The active area was 0.48 cm2. | ||||
| L0, electrolyte 1 | 2.7 | 0.50 | 10.0 | 0.54 |
| L0, electrolyte 2 | 1.3 | 0.61 | 3.7 | 0.58 |
| L1, electrolyte 1 | 2.3 | 0.44 | 10.5 | 0.50 |
| L1, electrolyte 2 | 2.0 | 0.58 | 5.9 | 0.58 |
| L2, electrolyte 1 | 1.7 | 0.41 | 7.7 | 0.54 |
| L2, electrolyte 2 | 0.8 | 0.49 | 2.9 | 0.56 |
Spectra of the incident photon-to-current-conversion efficiency (IPCE) for L0, L1 and L2-based solar cells with electrolyte 1 (no 4-TBP) are shown in Fig. 4. In the range 500–550 nm, IPCE maxima of up to 84%, 74% and 50% were found for L0, L1 and L2, respectively. The effect of 4-TBP addition to the electrolyte is pronounced in the IPCE spectra. Fig. 5a–c shows IPCE spectra of L0, L1 and L2 using electrolyte with and without 4-TBP. Fig. 5d shows normalized IPCE spectra of L0 based solar cells with the two electrolytes. A pronounced blue shift of the IPCE spectrum is observed for L0. Similar blue shifts are found for L1 and L2.
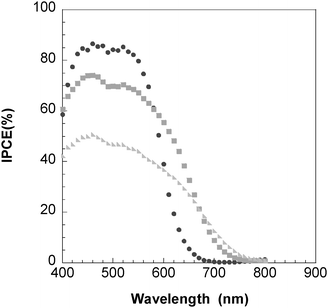 | ||
| Fig. 4 Spectra of monochromatic incident photon-to-current conversion efficiency (IPCE) for DSC based on L0 (●), L1 (■) and L2 (▶), respectively. Electrolyte: 0.5 M LiI and 0.05 M I2 in acetonitrile. | ||
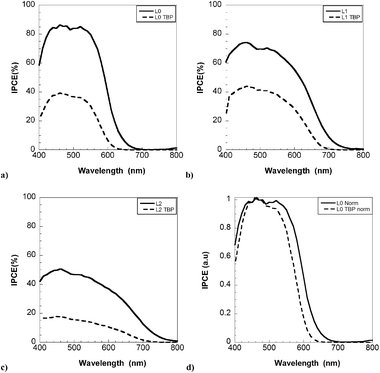 | ||
| Fig. 5 Spectra of monochromatic incident photon-to-current conversion efficiency (IPCE) for DSCs based on (a) L0 (b) L1 and (c) L2; with (- - -) and without (—) 4-TBP in the electrolyte, (d) normalized IPCE spectra for DSC based on L0. | ||
3.4 Origin of differences in photovoltaic performance of L0, L1 and L2
We will divide this section in two parts: First, we will discuss the internal differences observed in electrolyte without 4-TBP, and second we will discuss the effect of 4-TBP on the solar cell performance.Dye orientation: The dye orientation on the surface was further investigated by analyzing N1s (nitrogen) and S2p core-level PES. For a randomly ordered molecular layer (dye powder on conducting glass), the PES N1s intensities should show a 1![[thin space (1/6-em)]](https://www.rsc.org/images/entities/char_2009.gif) :
:![[thin space (1/6-em)]](https://www.rsc.org/images/entities/char_2009.gif) 1 ratio of the peak originating from the triphenylamine moiety (N1sTPA) and that from the rhodanine-3-acetic acid moiety (N1sR3A). As observed in Fig. 6, the N1s signal from these samples can indeed be reasonably well curve fitted with two components having the same intensity. The peak at lower binding energy can be assigned to N1sTPA and the peak at higher binding energy to N1sR3A.35
1 ratio of the peak originating from the triphenylamine moiety (N1sTPA) and that from the rhodanine-3-acetic acid moiety (N1sR3A). As observed in Fig. 6, the N1s signal from these samples can indeed be reasonably well curve fitted with two components having the same intensity. The peak at lower binding energy can be assigned to N1sTPA and the peak at higher binding energy to N1sR3A.35
 | ||
| Fig. 6 N1s PES spectra of L0 (top figure), L1 (middle figure) and L2 (lower figure). Both spectra of multilayers (ML) and spectra of dye-sensitized TiO2 are shown for the different dyes. The measurements were performed with a photon energy of 1487 eV for the ML and both 1487 and 758 eV for the dye-sensitized TiO2. | ||
In dye-sensitized TiO2 electrodes the ratio between these two peaks changed. An intensity ratio between the N1sR3A and N1sTPA peaks of about 0.5 was found at a photon energy of 1487 eV, which gives a strong evidence for a dominating orientation of the molecule having the triphenylamine moiety pointing out from the TiO2 surface.35 The surface sensitivity depends on the kinetic energy of the emitted electrons and can be improved by decreasing the photon energy. This explains why the intensity ratio between N1sR3A and N1sTPA decreasees further in the measurements performed at lower photon energy of 758 eV, see Table 5. Comparing the N1s ratios in more detail we observe that the intensity ratio decreases in the order L0, L1, L2. This change is in accordance with the decrease in the distance between the two nitrogen atoms in the different molecules. Previous measurements of the D5 molecule, also containing two spectroscopically distinguishable nitrogen atoms at a distance similar to that of L1, show very similar ratios.35 The PES analysis of the dye-sensitized samples therefore suggests that differences in molecular orientation among the L0, L1, L2 series is small and the preferred orientation is having the triphenylamine moiety pointing out from the surface and is similar to that of the D5 molecule. Additional measurements using the S2p signals confirm the results (see ESI).†
| N1sR3A/N1sTPA | N1sR3A/N1sTPA | |
|---|---|---|
| Dye | hν = 1487 eV | hν = 758 eV |
| L0 | 0.43 | 0.33 |
| L1 | 0.41 | 0.28 |
| L2 | 0.32 | 0.23 |
| D5 | 0.37 | 0.23 |
Light-harvesting efficiency: L2-sensitized TiO2 films absorb more sunlight than L1 or L0-sensitized films. The light-harvesting efficiency (LHE = (1 − 10−A), with A the absorbance of the film) was measured with dyes adsorbed on ∼3 μm thick TiO2 films, and is plotted in Fig. 7. As expected, L2 has the most red-shifted onset, followed by L1. Due to the high extinction coefficients, the LHE is 100% in the range 400–500 nm for all dyes. The IPCE in the same range was, however, significantly below 100%, see Fig. 4. IPCE can be expressed as follows:
| IPCE(λ) = LHE(λ)·ϕinj·ηreg·ηcc | (1) |
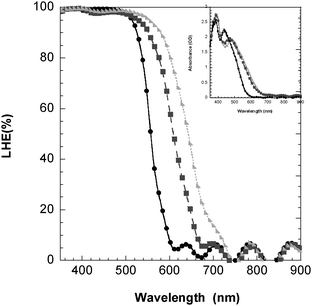 | ||
| Fig. 7 UV-Vis absorption spectra converted to LHE(%) of L0(●), L1 (■) and L2 (▶) adsorbed onto TiO2 in the presence of redox electrolyte. Inset: UV-Vis absorption spectra of L0, L1 and L2, respectively, adsorbed onto TiO2 in the presence of electrolyte. | ||
Injection efficiency: The injection efficiency is given by the ratio of the rate constant for electron injection and the sum of all deactivation rate constants for the excited dye molecule. The calculated LUMO levels for dyes L0, L1 and L2 are similar, see Table 1, and located well above the TiO2 conduction band edge. Furthermore, the dyes have identical binding groups and similar electronic structure, suggesting that electronic coupling to CB states will be similar. Therefore, no significant differences in ϕinj between the dyes are expected.
Regeneration of the oxidized dye: Photoinduced absorption (PIA) spectroscopy34,36 demonstrated clearly that the dyes were able to inject electrons into TiO2 upon excitation, as spectral characteristic of the oxidized dye molecules were observed (see Supporting Information). The spectral characteristic of the oxidized dye disappeared from the PIA spectrum when the redox electrolyte was added (see ESI).† This suggests that the regeneration of the dye (reduction of the oxidized dye by iodide) is efficient. As the oxidation potentials for the dyes differ, rate constants for regeneration may differ, and, based on driving force, are expected to be decrease in the order L0 > L1 > L2. Ultrafast laser spectroscopy studies, to be published elsewhere, are presently being performed on the system to determine injection and recombination kinetics, and their impact on the photocurrent generation. Different limitations in the ultrafast kinetics can reduce the value of ηreg and may explain in part the observed differences in IPCE.
Charge collection efficiency: Losses of injected electrons during transport in the porous TiO2 film are given by good approximation by the ratio of electron transport time and electron lifetime. These characteristic time constants were determined using photocurrent and photovoltage transients following small modulations of light intensity as previously described.37–41 No significant differences in electron transport times plotted against short-circuit charge density in the film are found (see ESI),† which can be expected as the transport is determined mostly by properties of the mesoporous TiO2 electrode and not by the dye.39 Electron lifetimes measured at the same light intensities, but under open-circuit conditions, differ significantly between the dyes, see Fig. 8a. Electron lifetimes under short-circuit conditions were estimated using the extracted charge under short-circuit conditions and the relation between charge and electron lifetime at open circuit condition that were measured separately (see ESI).†ηcc was estimated to be 0.9 for L2-sensitized solar cells and 1.0 for L1 and L0. In conclusion, the differences in IPCE as observed in Fig. 4 can be attributed to differences electron collection and possibly also to differences in dye regeneration efficiency.
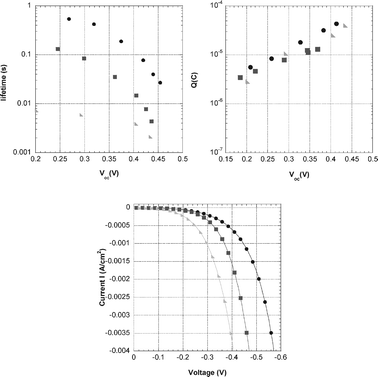 | ||
| Fig. 8 (a) Electron lifetime as function of open-circuit voltage. Time constants were determined using time-resolved small modulation techniques. Solar cells based on L0 (●), L1 (■) and L2 (▶), respectively, with 0.5 M LiI, 0.05 M I2 in acetonitrile. (b) Extracted charge as a function of open-circuit potential in dye sensitized solar cells based on L0 (●), L1 (■) and L2 (▶), respectively, with electrolyte (1) 0.5 M LiI, 0.05 M I2 in acetonitrile. (c) Dark current- voltage characteristics of DSC based on L0 (●), L1 (■) and L2 (▶), respectively. | ||
Electron lifetimes in dye-sensitized solar cells depend significantly on the type of sensitizing dye, as has been observed before in several studies.42,43 This is remarkable as the lifetime reflects the recombination between electrons in the TiO2 and triiodide in the electrolyte. The relatively large differences in electron lifetime between the dyes used in this study are even more surprising, considering the similarity of the dyes. In Fig. 8a electron lifetimes of DSCs based on L0, L1 and L2 are shown as a function of open-circuit voltage. Lifetimes decrease in the order L0 > L1 > L2. Adsorbed dye can affect the position of the TiO2 conduction band edge. The relation between charge and open-circuit voltage was therefore studied, see Fig. 8b. No significant differences in photovoltage–charge relation were found for the different dyes, indicating that the dyes affect the surface in a similar way. Differences in electron recombination are thus only due to the nature of the dye, and not due to band edge shifts.
It appears that dye molecules can catalyze the reduction of triiodide.43 To confirm this, dark current–voltage characteristics were measured, see Fig. 8c. The dark current decreases in the order L2, L1 and L0, which agrees well with the electron lifetime results. The higher dye load of L2 in comparison to L1 and L0 does not protect electrons in TiO2 from recombination with triiodide, but is in fact promoting this reaction. The origin of the catalysis of triiodide reduction may be the formation of a complex between the dye and iodine (or triiodide), as was recently suggested by O’Regan et al.43 Differences in binding constants of dye and iodine (or triiodide) are possibly the origin of the differences in electron lifetimes and dark currents.
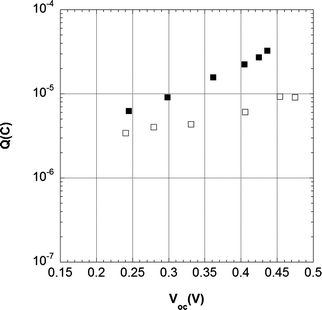 | ||
| Fig. 9 Extracted charge as a function of open circuit potential in L1-sensitized solar cells with electrolyte 1 (■) 0.5 M LiI, 0.05 M I2 in acetonitrile and 2 (□) 0.5 M LiI, 0.05 M I2, 0.5 M 4-TBP in acetonitrile. | ||
IPCE spectra are significantly lower and blue-shifted in the presence of 4-TBP, see Fig. 5. To explain these observations, we will again factorize the IPCE using eqn (1).
Light-harvesting efficiency: The absorption spectrum of the adsorbed dyes did not change in the presence of 4-TBP. Furthermore, no significant differences in dye-desorption was observed when sensitized films were exposed to redox electrolyte with and without 4-TBP. The blue-shift of the IPCE must originate from one of the other factors.
Regeneration of the oxidized dye: We do not expect that 4-TBP interferes significantly with the dye regeneration, although fast spectroscopic studies are needed to confirm this. ηreg is likely to be similar to the situation without 4-TBP in the electrolyte.
Charge collection efficiency: In contrast to N719-sensitized TiO2 solar cells,45–47 4-TBP did not increase the electron lifetime in L0, L1 and L2-sensitized solar cells. The collection efficiency is therefore not expected to be much affected. The presumed blocking effect of 4-TBP, by binding to uncovered TiO2 surface will be less important for small dye molecules. Furthermore, if the main reaction pathway of recombination is through a possible dye-iodine (-triiodide) complex, the surface blocking will not have much effect.
Injection efficiency: The observed changes in the IPCE spectra are most likely due to changes in the injection efficiency upon addition of 4-TBP. As discussed above, addition of 4-TBP leads to a shift of the TiO2 conduction band edge to higher energy. This will decrease the density of acceptor states in the TiO2 which are located at the same energy as the excited dye levels. This will result in a decrease of the electron injection rate constant and the injection efficiency. The observed blue shift in the IPCE spectra suggests that the injection efficiency is wavelength dependent and is illustrated in Fig. 10. If electron injection occurs from hot (= not vibronically relaxed) excited states a wavelength-dependent injection rates and injection efficiency may be expected. The excited state resulting from absorption of a red photon has less energy than that resulting from a blue photon, and its energy may not be high enough for successful electron injection.
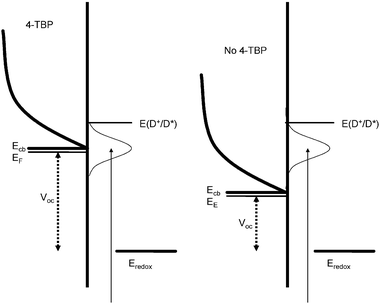 | ||
| Fig. 10 Energy scheme of the dye sensitized TiO2 solar cell, where the shift in CB, influencing the photovoltage is illustrated for the cases with and without 4-TBP. The possible variation in overlap between dye donor state and TiO2 acceptor states is also shown. | ||
It is interesting to compare the L2 sensitizer to the closely related D5 dye14,35 that differs in structure only by the acceptor group, cyanoacetic acid. This causes a difference in excited state potential, ED*/D+: values of −1.04 V for L2 and −1.36 V for D5 vs. NHE are estimated under the same conditions. In contrast to L2, high IPCE values are obtained for D5, even in the presence of 4-TBP, and significantly higher photovoltages are found. While the principle anchoring group to the TiO2 is identical, i.e. carboxylic acid, computational results show that in case of D5 the LUMO is extended to this group, whereas it is not in case of the rhodanine-3-acetic acid of L2 (see Fig. 3). This suggests that a combination of reduced injection driving force (∼0.2 V) and weaker coupling between the excited state level in L2 and TiO2 CB levels result in slower injection kinetics and poorer injection efficiencies in cases where the TiO2 CB levels are relatively close in energy to the excited state levels of the dye, i.e. when 4-TBP is present in the electrolyte.
4. Conclusions
A series of three closely related dyes has been designed, synthesized and investigated in dye-sensitized solar cells. The dyes consist of an electron donor moiety, triphenylamine, and an electron acceptor moiety, rhodanine-3-acetic acid, linked together using methine and thiophene moieties. Increase of the conjugation length resulted in a more red-shifted spectral response and less positive oxidation potentials. The calculated excited state levels were stationary. DFT calculations using PCM solvation corrected B3LYP and PBE1PBE was in good agreement with experimental electrochemical and optical data. The photovoltaic performance of this set of dyes as sensitizers in mesoporous TiO2 solar cells was investigated using electrolytes containing the iodide/triiodide redox couple. The dye with the best absorption characteristics, L2, showed the poorest solar cell efficiency, due to insufficient dye regeneration and charge collection efficiencies. Addition of 4-tert-butylpyridine to the electrolyte led to a strongly reduced photocurrent for all dyes due to a reduced electron injection efficiency, caused by a 0.15 V negative shift of the TiO2 conduction band potential.Acknowledgements
This work was supported by the Swedish Energy Agency, the Swedish Research Council, Knut och Alice Wallenberg Foundation, the Carl Trygger Foundation, the Swedish Foundation for Strategic Research (SSF) and BASF AG Ludwigshafen. We also thank ECN for supplying the TiO2 paste, and IVF Industrial Research and Development Corporation for screen-printing the TiO2 electrodes. Ms Rong Zhang in Dalian is acknowledged for the help with MS and Haining Tian and Xichuan Yang for helpful discussions of the dye synthesis.References
- B. O’Regan and M. Grätzel, Nature, 1991, 353(6346), 737–740 CrossRef CAS.
- M. K. Nazeeruddin, A. Kay, I. Rodicio, R. Humphry-Baker, E. Muller, P. Liska, N. Vlachopoulos and M. Grätzel, J. Am. Chem. Soc., 1993, 115(14), 6382–6390 CrossRef CAS.
- M. A. Green, K. Emery, D. L. King, Y. Hishikawa and W. Warta, Prog. Photovolt., 2007, 15(1), 35–40 CrossRef CAS.
- J. M. Kroon, N. J. Bakker, H. J. P. Smit, P. Liska, K. R. Thampi, P. Wang, S. M. Zakeeruddin, M. Grätzel, A. Hinsch, S. Hore, U. Wurfel, R. Sastrawan, J. R. Durrant, E. Palomares, H. Pettersson, T. Gruszecki, J. Walter, K. Skupien and G. E. Tulloch, Prog. Photovolt., 2007, 15(1), 1–18 CrossRef CAS.
- S. Ito, M. K. Nazeeruddin, P. Liska, P. Comte, R. Charvet, P. Pechy, M. Jirousek, A. Kay, S. M. Zakeeruddin and M. Grätzel, Prog. Photovolt., 2006, 14(7), 589–601 CrossRef CAS.
- S. Ito, S. M. Zakeeruddin, R. Humphry-Baker, P. Liska, R. Charvet, P. Comte, M. K. Nazeeruddin, P. Pechy, M. Takata, H. Miura, S. Uchida and M. Grätzel, Adv. Mater., 2006, 18(9), 1202 CrossRef CAS.
- N. Papageorgiou, Y. Athanassov, M. Armand, P. Bonhote, H. Pettersson, A. Azam and M. Grätzel, J. Electrochem. Soc., 1996, 143(10), 3099–3108 CAS.
- P. Wang, S. M. Zakeeruddin, M. Grätzel, W. Kantlehner, J. Mezger, E. V. Stoyanov and O. Scherr, Appl. Phys. A, 2004, 79(1), 73–77 CrossRef CAS.
- P. Wang, S. M. Zakeeruddin, J.-E. Moser, R. Humphry-Baker and M. Grätzel, J. Am. Chem. Soc., 2004, 126, 7164–7165 CrossRef CAS.
- L. Schmidt-Mende, U. Bach, R. Humphry-Baker, T. Horiuchi, H. Miura, S. Ito, S. Uchida and M. Grätzel, Adv. Mater., 2005, 17(7), 813 CrossRef.
- U. Bach, D. Lupo, P. Comte, J. E. Moser, F. Weissortel, J. Salbeck, H. Spreitzer and M. Grätzel, Nature, 1998, 395(6702), 583–585 CrossRef.
- J. Hagen, W. Schaffrath, P. Otschik, R. Fink, A. Bacher, H. W. Schmidt and D. Haarer, Synth. Met., 1997, 89(3), 215–220 CrossRef CAS.
- S. Kim, J. K. Lee, S. O. Kang, J. Ko, J. H. Yum, S. Fantacci, F. De Angelis, D. Di Censo, M. K. Nazeeruddin and M. Grätzel, J. Am. Chem. Soc., 2006, 128(51), 16701–16707 CrossRef CAS.
- D. P. Hagberg, T. Edvinsson, T. Marinado, G. Boschloo, A. Hagfeldt and L. Sun, Chem. Commun., 2006,(21), 2245–2247 RSC.
- K. Hara, T. Sato, R. Katoh, A. Furube, T. Yoshihara, M. Murai, M. Kurashige, S. Ito, A. Shinpo, S. Suga and H. Arakawa, Adv. Funct. Mater., 2005, 15(2), 246–252 CrossRef CAS.
- T. Kitamura, M. Ikeda, K. Shigaki, T. Inoue, N. A. Anderson, X. Ai, T. Q. Lian and S. Yanagida, Chem. Mater., 2004, 16(9), 1806–1812 CrossRef CAS.
- D. P. Hagberg, T. Marinado, K. M. Karlsson, K. Nonomura, P. Qin, G. Boschloo, T. Brinck, A. Hagfeldt and L. Sun, J. Org. Chem., 2007, 72(25), 9550–9556 CrossRef CAS.
- D. P. Hagberg, J. H. Yum, H. Lee, F. De Angelis, T. Marinado, K. M. Karlsson, R. Humphry-Baker, L. Sun, A. Hagfeldt, M. Gratzel and M. K. Nazeeruddin, J. Am. Chem. Soc., 2008, 130(19), 6259–6266 CrossRef CAS.
- H. Qin, S. Wenger, M. Xu, F. Gao, X. Jing, P. Wang, S. M. Zakeeruddin and M. Gratzel, J. Am. Chem. Soc., 2008, 130(29), 9202 CrossRef CAS.
- K. Hara, Z. S. Wang, T. Sato, A. Furube, R. Katoh, H. Sugihara, Y. Dan-Oh, C. Kasada, A. Shinpo and S. Suga, J. Phys. Chem. B, 2005, 109(32), 15476–15482 CrossRef CAS.
- K. Hara, T. Sato, R. Katoh, A. Furube, Y. Ohga, A. Shinpo, S. Suga, K. Sayama, H. Sugihara and H. Arakawa, J. Phys. Chem. B, 2003, 107(2), 597–606 CrossRef CAS.
- K. Hara, K. Sayama, Y. Ohga, A. Shinpo, S. Suga and H. Arakawa, Chem. Commun., 2001,(6), 569–570 RSC.
- T. Horiuchi, H. Miura and S. Uchida, Chem. Commun., 2003,(24), 3036–3037 RSC.
- T. Horiuchi, H. Miura, K. Sumioka and S. Uchida, J. Am. Chem. Soc., 2004, 126(39), 12218–12219 CrossRef CAS.
- T. Horiuchi, H. Miura and S. Uchida, J. Photochem. Photobiol., A: Chem., 2004, 164(1-3), 29–32 CrossRef CAS.
- D. Kuang, S. Uchida, R. Humphry-Baker, S. M. Zakeeruddin and M. Gratzel, Angew. Chem., Int. Ed., 2008, 47(10), 1923–1927 CrossRef CAS.
- M. X. W. Liang, F. Cai, P. Chen, B. Peng, J. Chen and Z. Li, J. Phys. Chem. C, 2007, 111, 4465–4472 CrossRef CAS; M. X. W. Liang, F. Cai, P. Chen, B. Peng, J. Chen and Z. Li, J. Phys. Chem. C, 2007, 111, 4465–4471 CrossRef CAS.
- H. N. Tian, X. C. Yang, R. K. Chen, R. Zhang, A. Hagfeldt and L. Sun, J. Phys. Chem. C, 2008, 112(29), 11023–11033 CrossRef CAS.
- H. Rensmo, K. Westermark, S. Sodergren, O. Kohle, P. Persson, S. Lunell and H. Siegbahn, J. Chem. Phys., 1999, 111(6), 2744–2750 CrossRef CAS.
- E. M. J. Johansson, M. Hedlund, H. Siegbahn and H. Rensmo, J. Phys. Chem. B, 2005, 109(47), 22256–22263 CrossRef CAS.
- E. M. J. Johansson, P. G. Karlsson, M. Hedlund, D. Ryan, H. Siegbahn and H. Rensmo, Chem. Mater., 2007, 19(8), 2071–2078 CrossRef CAS.
- K. Westermark, H. Rensmo, H. Siegbahn, K. Keis, A. Hagfeldt, L. Ojamae and P. Persson, J. Phys. Chem. B, 2002, 106(39), 10102–10107 CrossRef CAS.
- M. Alebbi, C. A. Bignozzi, T. A. Heimer, G. M. Hasselmann and G. J. Meyer, J. Phys. Chem. B, 1998, 102(39), 7577–7581 CrossRef CAS.
- P. Qin, X. Yang, R. Chen, L. Sun, T. Marinado, T. Edvinsson, G. Boschloo and A. Hagfeldt, J. Phys. Chem. C, 2007, 111(4), 1853–1860 CrossRef CAS.
- E. M. J. Johansson, T. Edvinsson, M. Odelius, D. P. Hagberg, L. Sun, A. Hagfeldt, H. Siegbahn and H. Rensmo, J. Phys. Chem. C, 2007, 111(24), 8580–8586 CrossRef CAS.
- G. Boschloo and A. Hagfeldt, Chem. Phys. Lett., 2003, 370(3-4), 381–386 CrossRef CAS.
- G. Boschloo, L. Häggman and A. Hagfeldt, J. Phys. Chem. B, 2006, 110(26), 13144–13150 CrossRef CAS.
- J. Nissfolk, K. Fredin, A. Hagfeldt and G. Boschloo, J. Phys. Chem. B, 2006, 110(36), 17715–17718 CrossRef CAS , 22950.
- S. Nakade, T. Kanzaki, W. Kubo, T. Kitamura, Y. Wada and S. Yanagida, J. Phys. Chem. B, 2005, 109(8), 3480–3487 CrossRef CAS.
- K. Hara, K. Miyamoto, Y. Abe and M. Yanagida, J. Phys. Chem. B, 2005, 109(50), 23776–23778 CrossRef CAS.
- B. C. O’Regan and F. Lenzmann, J. Phys. Chem. B, 2004, 108(14), 4342–4350 CrossRef CAS.
- N. Koumura, Z. S. Wang, S. Mori, M. Miyashita, E. Suzuki and K. Hara, J. Am. Chem. Soc., 2006, 128(44), 14256–14257 CrossRef CAS.
- B. C. O’Regan, I. Lopez-Duarte, M. V. Martinez-Diaz, A. Forneli, J. Albero, A. Morandeira, E. Palomares, T. Torres and J. R. Durrant, J. Am. Chem. Soc., 2008, 130(10), 2906–2907 CrossRef CAS.
- N. W. Duffy, L. M. Peter and K. G. U. Wijayantha, Electrochem. Commun., 2000, 2(4), 262–266 CrossRef CAS.
- K. Hara, Y. Dan-Oh, C. Kasada, Y. Ohga, A. Shinpo, S. Suga, K. Sayama and H. Arakawa, Langmuir, 2004, 20(10), 4205–4210 CrossRef CAS.
- Z. P. Zhang, S. M. Zakeeruddin, B. C. O’Regan, R. Humphry-Baker and M. Grätzel, J. Phys. Chem. B, 2005, 109(46), 21818–21824 CrossRef CAS.
- N. R. Neale, N. Kopidakis, J. van de Lagemaat, M. Grätzel and A. J. Frank, J. Phys. Chem. B, 2005, 109(49), 23183–23189 CrossRef CAS.
- V. V. Pavlishchuk and A. W. Addison, Inorg. Chim. Acta, 2000, 298(1), 97–102 CrossRef.
Footnotes |
† Electronic supplementary information (ESI) available![[thin space (1/6-em)]](https://www.rsc.org/images/entities/char_2009.gif) : :![[thin space (1/6-em)]](https://www.rsc.org/images/entities/char_2009.gif) Detailed synthetic procedures; preparation and characterization methods of dye-sensitized solar cells and additional experimental results; details of quantum chemical calculations; photoelectron spectroscopy details and additional results. See DOI: 10.1039/b812154k Detailed synthetic procedures; preparation and characterization methods of dye-sensitized solar cells and additional experimental results; details of quantum chemical calculations; photoelectron spectroscopy details and additional results. See DOI: 10.1039/b812154k |
| ‡ Current address: Uppsala University, Department of Materials Chemistry, Box 538, 751 21 Uppsala, Sweden. |
| § Current address: Uppsala University, Department of Physical and Analytical Chemistry, Box 259, 751 05 Uppsala, Sweden. |
| This journal is © the Owner Societies 2009 |
