Water absorption and transport in bis-silane films
Yimin
Wang
a,
Peng
Wang
a,
Doug
Kohls
a,
William A.
Hamilton†
b and
Dale W.
Schaefer
*a
aDepartment of Chemical and Materials Engineering, University of Cincinnati, Cincinnati, OH 45221-0012, USA. E-mail: dale.schaefer@uc.edu; Fax: +1 (1)206 600![[thin space (1/6-em)]](https://www.rsc.org/images/entities/char_2009.gif) 3191; Tel: +1 (1)513 5565431
3191; Tel: +1 (1)513 5565431
bSolid State Division, Oak Ridge National Laboratory, Oak Ridge, TN 37831, USA
First published on 4th November 2008
Abstract
Water (D2O) ingress in bis-amino silane and bis-sulfur silane films was studied by in situneutron reflectivity. Bis-amino silane film absorbs substantially more D2O (33 vol%) than the bis-sulfur silane film (4.6 vol%) at equilibrium. The volume increase (swelling) of both films, however, is much smaller than the total volume of D2O absorbed in the films. The results suggest that the absorbed water exists in two populations: one is dissolved in the polymer matrix (Henry’s mode) while the other occupies unrelaxed free volume existing in the polymer (Langmuir mode). The dominance of Langmuir mode accounts for the small film thickness change during the water absorption. Dual-mode sorption is also consistent with the observed two-stage swelling process whereby an initial rapid increase in film thickness is followed by a slower process extending over 11 h.
Introduction
Water absorption is a major concern for protective coatings especially for anti-corrosion applications where a high-energy surface such as metal or metal oxide is involved. Although recent research1,2 shows that silane serves as a physical barrier as opposed to an electrochemical corrosion inhibitor, research on equilibrium water uptake3–5 indicates that most silanes are not effective water barriers even though the films show excellent anti-corrosion behaviour.Organofunctional silanes have the general structure of R′Si(OR)3, where R is a hydrolyzable group and R′ is an organofunctional group. The hydrolysis, condensation and bonding mechanisms of silane are reasonably well established.6,7 When silane is dissolved into water, the hydrolyzable groups react with water and hydrolyse into a silanol (–SiOH) and an alcohol, ROH. The silanols (–SiOHs) then condense to form siloxane (–SiOSi–). When the hydrolyzed silane solution is applied on an inorganic substrate surface such as Si and Al, the silanols will also condense with the surface hydroxyl groups (–MeOH) of the substrate and bond with the substrate surface. The hydrolysis, condensation and bonding on metal surface can be expressed by the following reactions:
| R′Si(OR)3 + 3H2O → R′Si(OH)3 + 3ROH |
Condensation:
| R′Si(OH)3 + 3ROH → R′Si(OR)3 + 3H2O |
Bonding with metal surface:
| R′Si(OH)3 + 3MeOH → R′Si(OMe)3 + 3H2O |
Among all the silane species, bis-type silanes [with the general formula of (OR)3Si(CH2)3–R′–(CH2)3Si(OR)3] offer effective corrosion protection on metals such as aluminium and steel.1 Bis-silanes show varying behaviours traceable to their bridging groups. Bis-[3-(triethoxysilyl) propyl] tetrasulfide (bis-sulfur silane), for example, is hydrophobic due to its –SX– group. Bis-sulfur silane shows effective corrosion performance on Al.2,8Bis-[trimethoxysilylpropyl]amine (bis-amino silane), on the other hand, offers good bonding to metal surfaces but poor corrosion resistance due to its hydrophilic secondary amine group. Equilibrium water intake of bis-amino silane and bis-sulfur silane was reported previously by Pan et al.3,9
Previous work focused on the equilibrium water distribution within the silane films.3–5,10–12 Present work, by contrast, focuses on the kinetics of water penetration measured by in situneutron reflectivity (NR). Time-resolved water ingress was determined from evolution of the neutron scattering length density (SLD) profile. Two-stage water ingress is observed, which is traced to the dual-mode13,14 nature of the sorption process.
Experimental
Materials
Bis-[3-(triethoxysilyl) propyl] tetrasulfide (bis-sulfur silane) (H5C2O)3Si–(CH2)3–S4–(CH2)3–Si(OC2H5)3 and Bis-[trimethoxysilylpropyl]amine (bis-amino silane) (H3CO)3Si–(CH2)3–NH–(CH2)3–Si(OCH3)3 were both provided by GE Silicons (now Momentive Performance Materials, Friendly, WV, USA). The molecular structures of the silanes are shown in Scheme 1. The silanes were used without further purification. One-side-polished, 3-inch (111) Si wafers were purchased from Semiconductor Processing Co. (West Palm Beach, FL. USA). The wafers were cleaned using sulfuric acid/hydrogen peroxide (7:3 vol. ratio) immersion at room temperature for 20 min, followed by a de-ionized (DI) water rinse and blow-dry. D2O (99.9 atom %) and glacial acetic acid were obtained from Aldrich and used as received.![Molecular structure of (a) bis-[trimethoxysilylpropyl]amine (bis-amino silane) and (b) bis-[3-(triethoxysilyl) propyl] tetrasulfide (bis-sulfur silane).](/image/article/2009/CP/b808741e/b808741e-s1.gif) | ||
| Scheme 1 Molecular structure of (a) bis-[trimethoxysilylpropyl]amine (bis-amino silane) and (b) bis-[3-(triethoxysilyl) propyl] tetrasulfide (bis-sulfur silane). | ||
Procedures
The films were deposited by spin coating using a Larrell single-wafer spin processor (WS-400A-6NPP-Lite, North Wales, PA, USA). During the spin coating, the silane solution was pipetted onto the Si(111) wafers and was stabilized for one minute to allow complete wetting and reaction with the substrate. The wafers were then accelerated to 2000 rpm and held for 30 s to spin off the excess solution and dry the film. To remove all traces of solvent and cure the film, the samples were then dried in an oven at 180 °C for 1 h. The as-prepared samples were desiccated until further measurement.
The scattering length density (SLD) plays a central role in the interpretation of reflectivity data. The SLD of a material is a function of density and atomic composition, expressed as15
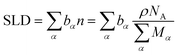 | (1) |
 is the sum of scattering lengths of all the atoms in that molecule. The number density is obtained from the mass density, ρ, divided by the sum of atomic masses, M, multiplied by Avogadro’s number, NA.
Penetrant species distributions are revealed by the SLD profile obtained by fitting the reflectivity data with a four-layer model. The recursive Parratt formalism16 was used here to simulate the reflectivity from a candidate model structure. The model parameters (layer thicknesses, SLDs and interface widths) were optimized by means of nonlinear regression. We accept the simplest layered model that fits the data.
Before the NR measurements, the as-prepared films were kept in a closed container in the presence of desiccant for at least two days. Experiments were performed in an aluminium can. The beam is incident on the film from the airside of the film. There is almost no flux loss in the Al wall of the can. Reflectivity of the as-prepared and re-dried films was measured with desiccant inside the can at ambient temperature. During the in situ D2O-vapour absorption experiment, the desiccant was removed and a drop of D2O was added. Time is recorded as soon as the can is sealed. The NR was performed for designated time intervals after exposure to saturated D2O vapour. Equilibrium saturation of the film was confirmed by measuring the reflectivity with time until no further change is observed. After finishing the measurement in the “wet” condition, the samples were again dried in desiccators at ambient temperature for 10 h before the measurement in the re-dried state.
FTIR-RA measurements were conducted on a Perkin-Elmer Spectrum One spectrometer in mid-IR range (600–4000 cm−1). The IR spectra were obtained with an incidence angle of 45° with a spectral resolution of 4 cm−1. Sixty-four scans were collected for each measurement. Background spectra on bare Si wafer were collected before each run. The background spectra were subtracted from each scan to obtain the IR spectra. The spectra of the as-prepared films were measured with the desiccant in the sealed sample chamber.
Results and discussion
FTIR of as-prepared films
Fig. 1 shows the FTIR spectra of the as-prepared bis-sulfur silane and bis-amino silane films. The peaks between 870–890 cm−1 are assigned to the hydrogen-bonded silanol (–SiOH). Both silanes show a peak at 970 cm−1, which is due to the asymmetric Si–O stretching of unhydrolyzed SiOCH2CH3.5 The peaks between 1070 and 1100 cm−1 are assigned to asymmetric Si–O stretching of the siloxane (–SiOSi–).17,18 The presence of the siloxane peak in both silanes indicates condensation polymerization has occurred.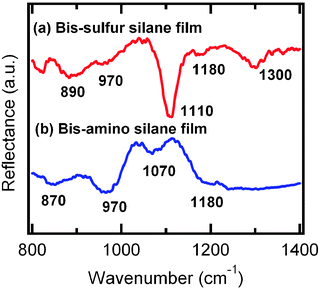 | ||
| Fig. 1 FTIR spectra of as-prepared (a) bis-sulfur silane and (b) bis-amino silane films. | ||
The siloxane (–SiOSi–) peak of bis-sulfur silane at 1110 cm−1 in Fig. 1 is more pronounced than that of the bis-amino silane peak at 1070 cm−1, which suggests that bis-sulfur silane film is more densely crosslinked than that of the bis-amino silane. A peak at 1180 cm−1 is assigned to the CH2CH3 rocking mode of SiOCH2CH3group.18,19 Another peak at 1300 cm−1 is assigned to the CH2 wagging mode in SiOCH2CH2.18,19
Neutron reflectivity
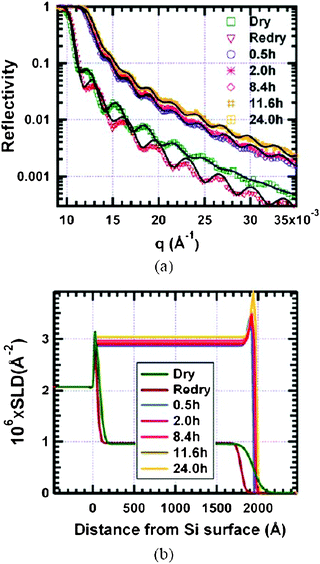 | ||
| Fig. 2 Change of reflectivity (a) and SLD (b) of the bis-amino silane film on exposure to D2O vapour. The lines through the data points of Fig. 2a indicate the best-fit of the reflectivity data using the corresponding model SLD in Fig. 2b. The data show a rapid uptake of D2O within first 30 min. However, equilibrium is not reached until 11.6 h of exposure to D2O vapour. | ||
The reflectivity and the critical edge (the angle at which the beam first penetrates the film) of the bis-amino silane film rapidly increase during the first 0.5 h indicating the rapid increase of the SLD of the film. After 0.5 h, the reflectivity slowly increases until equilibrium is reached at 11.6 h. The reflectivity of the re-dried film shows a shift of the fringe maxima and minima as compared with the reflectivity of the film in the dry state. The spacing (Δq) between fringes is related to thickness of the film (d) by d ≅ 2π/Δq.15 Thus the increase in Δq shown in Fig. 2a indicates a slight decrease in the film thickness upon redry after D2O exposure as indicated in Fig. 2b.
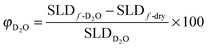
The SLD profile shown in Fig. 2b shows that the SLD increases abruptly within 0.5 h of water conditioning with only a small thickness increase. After 0.5 h, the SLD increases slowly until equilibrium is reached after 11.6 h. By employing eqn (2), the volume fraction of D2O absorbed by the film, φD2O, can be calculated:
 | (2) |
Fig. 3 shows the calculated volume fraction of D2O in film as a function of D2O conditioning time for both bis-amino and bis-sulfur silane films. Fig. 3 indicates that 33 vol% of film is occupied by water at saturation with 30 vol% being absorbed in the initial 0.5 h in bis-amino silane (represent by black symbol). The 30–40 vol% equilibrium water sorption was observed previously for bis-amino silane and related silane mixtures.3,5
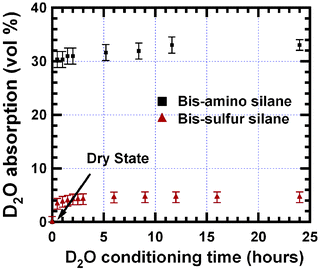 | ||
| Fig. 3 Volume fraction of D2O absorption in bis-amino silane and bis-sulfur silane films. Water rapidly occupies 30 vol% in 0.5 h and then slowly increases to 33 vol% over the next 11.1 h in bis-amino silane film. In contrast, only 4.6 vol% of bis-sulfur silane film is occupied by D2O equilibrium. | ||
Fig. 4 shows the thickness increase of the bis-amino silane as a function of the water-conditioning time. Interestingly, despite the 33 vol% of D2O absorption, the increase of the film thickness is only 2.3%. Comparing to Fig. 3, the thickness increase lags behind water absorption. Nevertheless, the thickness increase reaches equilibrium after 11.6 h, which is consistent with the time for SLD to reach equilibrium as shown in Fig. 3. By assuming the film swells uniaxially, which should be valid given the large surface-area-to-volume ratio and the impermeable substrate,20 the increase in the film volume is thus only 2.3%. The large difference between the volume of water absorption and swelling of the film implies that about 30 vol% of D2O is accommodated in pre-existing free space in the as-prepared film. About 30 vol% free volume was also observed in our previous study on bis-amino silane-related film.5
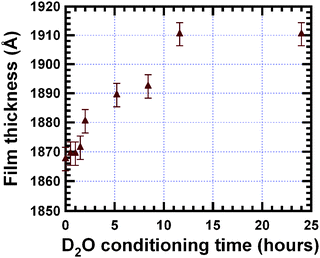 | ||
| Fig. 4 Thickness increase of bis-amino silane film as a function of the D2O-vapour conditioning time. The thickness increase is slower than water absorption shown in Fig. 3. | ||
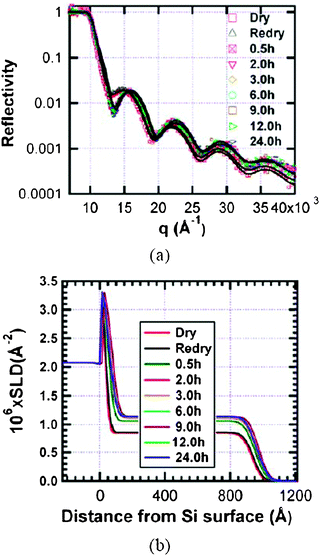
As shown in Fig. 2b, all D2O-conditioned films show enhanced SLD on the air-side surface regardless of the conditioning time implying a D-rich region attributed to D2O absorption on the hydrophilic secondary amino groups at the air-side surface.3 This D2O-rich layer has been repeatedly observed for hydrophilic silane and epoxy-silane films.3,4,9,21 Previous work on the tri-functional analogue of bis-aminosilane: γ-aminopropyl-triethoxysilane (γ-APS) by Fowkes et al.22 also observed free amino groups located at the air-side of the γ-APS film surface with angle-resolved XPS.
Interestingly, the SLD of the surface D2O-rich layer is constant during the water conditioning until the equilibrium state is reached. After water absorption reaches equilibrium at 11.6 h, the SLD of the surface D2O-rich layer increases, indicating more D2O is absorbed near surface after equilibrium state is reached. This observation suggests the D2O-rich layer serves as a reservoir for the supply of the D2O during the D2O penetration. Once the equilibrium state is reached, D2O surface absorption increases and finally saturates.
The thickness of the re-dried film is totally come back and even slightly smaller than that of the dry film. The totally recovery and slightly decrease in thickness as compared with the original thickness after water-conditioning indicates most water was absorbed physically in the film during the D2O conditioning and some further condensation between silane molecules occurred during the D2O conditioning resulting in a slight decrease in thickness after redry.
 | ||
| Fig. 5 Change of reflectivity (a) and SLD (b) of the bis-sulfur silane film on exposure to D2O vapour. The lines through the data points in (a) indicate the best-fit of the reflectivity data using the corresponding model SLD in (b). The data show a rapid uptake of D2O within first 30 min but equilibrium is not reached until after 6 h exposure to D2O vapour. | ||
Compared to bis-amino silane film, little change is observed in the reflectivity of bis-sulfur silane after the 24-hour D2O conditioning. An increase in R(q), however, is noticeable from the fact that the first minimum is at slightly lower q and the tail of the curve is slightly higher relative to the as-prepared state. By fitting the reflectivity curve, the SLD profile is obtained (Fig. 5b). The thickness of as-prepared bis-sulfur silane film is 920 Å, which is much less than that of the bis-amino silane film even though the same spin rate and same solution concentration were employed during preparation.
The most widely accepted theory of silane deposition postulates that condensation occurs between the silanols (–SiOH) and the hydroxyl groups (MeOH) on the metal surface through hydrogen bonding during deposition.1,23 However, recent studies5,24–26 present evidence that silanes with organofunctional groups can also be absorbed onto the metal surface through the bridging functional groups. The bonding between silane and mineral surface depends on the availability and nature of these functional groups. As mentioned previously, the –Sx– functional group on bis-sulfur silane is hydrophobic and the –NH functional group of bis-amino silane is hydrophilic. The hydrophobic –Sx– group does not bond as readily to the oxide surface as the hydrophilic –NH group on bis-amino group. The smaller film thickness upon deposition reflects this difference.
As in the case of bis-amino silane, the SLD of the bis-sulfur silane increases rapidly in 0.5 h but the degree of absorption is much smaller. Also, after 0.5 h, minimal SLD increase is observed during prolonged D2O conditioning. Equilibrium in water absorption is reached after 6 h. The more rapid approach to equilibrium of bis-sulfur film correlates to the lower amount of total D2O absorption of bis-sulfur silane film. No D2O-enhanced layer is observed on the film surface also due to the hydrophobic nature of bis-sulfur silane.9
By employing eqn (2), D2O absorption with swelling time can be calculated as shown in Fig. 3 (lower curve). The total water absorption at equilibrium is 4.6 vol%, which is substantially less than the 33 vol% of water absorption observed for bis-amino silane film.
For bis-sulfur silane the film thickness increase is much smaller than that of bis-amino silane. The time-resolved thickness increase is hard to establish due to the comparable fitting error. However, the final equilibrium film thickness increase can still be estimated to be 0.45 ± 0.18%. By assuming uniaxial swelling in thickness direction, the volume of the film also increases by 0.45 ± 0.18 vol%. Considering the 4.6 vol% of D2O absorbed in bis-sulfur silane film as calculated from eqn (2), we conclude that most of the D2O is physically accommodated in the free space of bis-sulfur silane film with minimal swelling as is the case for bis-amino silane film reported above.
Although swelling is observed for both films, the water absorption and swelling behaviour for bis-amino and bis-sulfur silanes are significantly different due to different bridging groups. The hydrophilicity of the amino group and more open crosslink structure (as reflected by the moderate –SiOSi– peak in FTIR analysis) results in greater water absorption in bis-amino silane film. On the other hand, the hydrophobicity and more densely cross-linked structure contribute to the lower water absorption in bis-sulfur silane film.
The sorption isotherms of small molecule penetrants in many glassy polymers follow the dual-mode sorption model.13,14 This model postulates that the penetrant exists in two populations: one population is dissolved in the polymer matrix according to Henry’s law, which usually involves the relaxation of the molecular chains and swelling of the film, while the other population occupies pre-existing un-relaxed free volume within the polymer according to the Langmuir isotherm.
The dual-mode sorption isotherm is given as:13,14
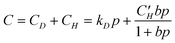 | (3) |
Since water molecules in the Langmuirian mode are absorbed in voids already present in the sample, little activation energy is needed. On the other hand, more energy is needed for a molecule to absorb in the Henry’s law mode since reorganization of the polymer chains is required for water to penetrate by this mechanism. At higher temperature, the Henry’s law mode will become more important since it involves more activation energy.
Based on above NR results, both Langmuir and Henry absorption modes are observed in bis-silane films. However, the sorption is dominated by the Langmuirian mode. D2O rapidly physically occupies and saturates the free space of the film with negligible alternation of the network or swelling, which results in the rapid SLD increase during the initial 0.5 h of the D2O conditioning. As time progresses, the Henry’s law mode comes into play. D2O first bonds with silane network through hydrogen bond and then interacts with the silane leading to relaxation and swelling of the film. Since the interaction involves the relaxation of the polymer network, this process lags behind the absorption in the Langmurian mode. A previous X-ray reflectivity study5 on the closely-related bis-amino silane and vinyl triacetoxysilane mixture films showed that these cured silane films are also not fully dense. About 30 vol% free volume exists in the films. Grazing incidence small-angle X-ray scattering (GISAXS) study showed that the free volume arises from frozen density fluctuations. The bonding requirements of the hexa-functional silane preclude efficient packing of the highly-crosslinked chains leading to molecular-scale free volume. The lower water absorption in bis-sulfur silane film may result from a smaller Langmuir affinity constant, b, of water in eqn (3) due to the hydrophobicity of the –Sx– group as well as higher (–SiOSi–) crosslink density after condensation. D2O cannot be easily accommodated in the free space in the bis-sulfur silane film.
Conclusions
Water absorption in bis-silane films was investigated with neutron reflectivity to understand the effect of bridging groups on the water response of bis-silane films. From these observations, the following conclusions can be drawn:(1) Bis-amino silane film absorbs substantially more D2O (33 vol%) than the bis-sulfur silane film (4.6 vol%) at equilibrium. Bis-sulfur silane, however, reaches equilibrium more rapidly than the bis-amino silane film.
(2) Both Henry and Langmuir absorption modes are observed in both films. Henry’s mode is related to the relaxation of the siloxane network and Langmuir’s mode is related to the physical occupation of existing free space. The Langmuir absorption mode dominates the absorption process in both films.
(3) The thickness increase of both films is much smaller than the volume of D2O absorbed for both films, which implies that the most of water resides in the free space instead of swelling the film.
(4) The increase of the film thickness lags behind the water absorption, which suggests Langmuir absorption is more rapid than the Henry absorption.
(5) A D2O-enriched layer is observed at the air-side of hydrophilic bis-amino silane film surface. No D2O-rich layer is detected on hydrophobic bis-sulfur silane surface.
Acknowledgements
The authors gratefully acknowledge the Strategic Environmental Research and Development Program (SERDP) for sponsoring the research (http://www.serdp.org). We benefited from the use of SPEAR at the Lujan Neutron Scattering Center at the Los Alamos National Laboratory supported under US Department of Energy (DOE) Contract W7405-ENG-36 and by the DOE Office of Basic Energy. We thank Dr Jaroslaw Majewski for the help during the NR measurement. We also benefited from using the MIRROR facility at HIFR at Oak Ridge National Laboratory for scoping studies.References
- W. J. Van Ooij, D. Zhu, G. Prasad, S. Jayaseelan, Y. Fu and N. Teredesai, Surf. Eng., 2000, 16, 386 CrossRef CAS.
- D. Zhu and W. J. Van Ooij, J. Corros. Sci., 2003, 45, 2177 Search PubMed.
- G. Pan, H. Yim, M. S. Kent, J. Majewski and D. W. J. Schaefer, J. Adhes. Sci. Technol., 2003, 17, 2175 CrossRef CAS.
- G. Pan, D. W. Schaefer and J. Ilavsky, J. Coll. Interface Sci., 2006, 302, 287 Search PubMed.
- Y. Wang, E. Watkins, J. Ilavsky, T. L. Metroke, P. Wang, B. Lee and D. W. Schaefer, J. Phys. Chem. B, 2007, 111, 7041 CrossRef CAS.
- E. D. Osterholtz and E. R. J. Pohl, J. Adhes. Sci. Technol., 1992, 6, 127 CrossRef CAS.
- E. P. Plueddemann, Silane Coupling Agents, Plenum Press, New York, 2nd edn, 1991 Search PubMed.
- D. Q. Zhu and W. J. Van Ooij, Electrochim. Acta, 2004, 49, 1113 CrossRef CAS.
- G. Pan, D. W. Schaefer, W. J. Van Ooij, M. Kent, J. Majewski and H. Yim, Thin Solid Films, 2006, 515, 2771 CrossRef CAS.
- M. S. Kent, W. F. McNamara, D. B. Fein, L. A. Domeier and A. P. Y. J. Wong, J. Adhes., 1999, 69, 121 CrossRef CAS.
- M. S. Kent, W. F. McNamara, D. B. Fein, L. A. Domeier and A. P. Y. J. Wong, J. Adhes., 1999, 69, 139 CrossRef CAS.
- M. S. Kent, G. S. Smith, S. M. Baker, A. Nyitray, J. Browning, G. Moore and D. W. Hua, J. Mater. Sci., 1996, 31, 927 CrossRef CAS.
- W. R. Vieth, J. M. Howell and J. H. Hsieh, J. Membr. Sci., 1976, 1, 177 CrossRef CAS.
- W. R. Vieth and K. J. J. Sladek, J. Colloid Sci., 1965, 20, 1014 CrossRef CAS.
- R. J. Roe, Methods of X-ray and Neutron Scattering in Polymer Science, Oxford University Press, New York, 2000 Search PubMed.
- L. G. Parratt, Phys. Rev. Lett., 1954, 95, 359 Search PubMed.
- J. P. Matinlinna, J. Areva, L. V. J. Laqssila and P. K. Vallittu, Surf. Interface Anal., 2004, 36, 1314 CrossRef CAS.
- J. K. Premachandra, W. J. Van Ooij and J. E. Mark, J. Adhes. Sci. Technol., 1998, 12, 1361 CrossRef CAS.
- D. Zhu and W. J. J. Van Ooij, J. Adhes. Sci. Technol., 2002, 16, 1235 CrossRef CAS.
- B. D. Vogt, C. L. Soles, H. J. Lee, E. K. Lin and W. Wu, Polymer, 2005, 46, 1635 CrossRef CAS.
- H. Yim, M. Kent, W. F. McNamara, R. Ivkov, S. Satija and J. Majewski, Macromolecules, 1999, 32, 7932 CrossRef CAS.
- F. M. Fowkes, D. W. Dwight and D. A. J. Cole, J. Non-Cryst. Solids, 1990, 120, 47 CrossRef CAS.
- D. Zhu and W. J. Van Ooij, Prog. Org. Coat., 2004, 49, 42 CrossRef CAS.
- P. H. Harding and J. C. Berg, J. Appl. Polym. Sci., 1998, 67, 1025 CrossRef CAS.
- J. S. Quinton and P. C. Dastoor, Surf. Interface Anal., 2000, 30, 21 CrossRef CAS.
- J. S. Quinton, L. Thomsen and P. Dastoor, Surf. Interface Anal., 1997, 25, 931 CrossRef CAS.
Footnote |
| † Present address: Bragg Institute, Australian Nuclear Science and Technology Organization, Lucas Heights, NSW 2234, Australia. |
| This journal is © the Owner Societies 2009 |