Selectivity of butanol isomers by enclathration†
Peter W.
Linder
,
Luigi R.
Nassimbeni
* and
Hong
Su
Chemistry Department, University of Cape Town, Rondebosch, 7701, Cape Town, South Africa. E-mail: luigi.nassimbeni@uct.ac.za; Fax: +0027 21 6854580; Tel: +0027 21 6502569
First published on 14th November 2008
Abstract
The structures of the inclusion compounds formed by the host 1,1-bis(4-hydroxyphenyl)cyclohexane with 1-butanol, iso-butanol and 2-butanol have been elucidated. Competition experiments between pairs of butanol guests and simultaneously by all three butanols show that the selectivity is in the order: 2-butanol > iso-butanol > 1-butanol. This correlates with their thermal stabilities measured by DSC.
Introduction
Quantifying the process of molecular recognition in host–guest chemistry in solution may be carried out by measuring the equilibrium constant of the association reaction between the host H and the guest G:| H + nG⇔H·nG |
When multiple equilibria occur, giving rise to several host–guest species in solution with different host![[thin space (1/6-em)]](https://www.rsc.org/images/entities/char_2009.gif) :guest stoichiometries, then the various binding constants may be determined. This requires knowledge of the total as well as the equilibrium concentrations of the various species.
:guest stoichiometries, then the various binding constants may be determined. This requires knowledge of the total as well as the equilibrium concentrations of the various species.
When a host is exposed to multiple guests, the selectivity is defined as the ratio of the equilibrium constants,1 but when the host–guest compounds precipitate, the evaluation of the equilibrium constants is difficult, requiring accurate measurements of the solubilities of the host–guest compounds in their mother liquor.
We therefore prefer the idea of the selectivity coefficient, first employed by Ward,2 which defines the selectivity coefficient of a given host for two guests A and B as
| KA:B=(KB:A)−1 = ZA/ZB*XB/XA |
While the selectivity constants derived in this way do not allow the evaluation of the Gibbs free energy, ΔG, of the enclathration reaction, they do yield a quantitative measure of the relative affinity of the host for a particular guest from a mixture of guests. Selectivity experiments have been performed on a number of host–guest systems. Miyata et al5 measured the selectivity of meta- and para xylenes by cholic acid, while Fogagnolo et al employed the related host dehydrocholic acid to measure the separation profiles between pairs of solvents comprising acetone, dimethylsulfoxide, dimethylformamide and N-methyl-2-pyrrolidinone.6Tetraphenylethanediol has been employed to separate mono-halo substituted benzenes,7 as well as the picoline isomers.8
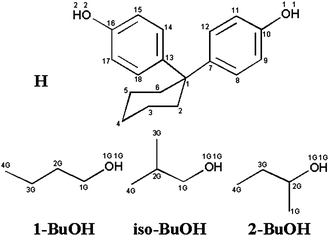
We now present the results of the selectivity by the host 1,1-bis(4-hydroxyphenyl)cyclohexane (H) for the three isomers 1-butanol (1-BuOH), 2-methyl-1-propanol (iso-butanol, iso-BuOH) and 2-butanol (2-BuOH). The results are discussed in terms of the structures of the inclusion compounds, their lattice energies, and their thermal stabilities. The atomic numbering scheme is given in Scheme 1 and the crystallographic data are summarised in Table 1.
 | ||
| Scheme 1 | ||
| Compound | H· 1-BuOH | H·iso-BuOH | H· 2-BuOH |
|---|---|---|---|
| Structure formula | C18H20O2·C4H10O | C18H20O2·C4H10O | C18H20O2·C4H10O |
| Formula weight | 342.46 | 342.46 | 342.46 |
| Temperature | 173(2) K | 173(2) K | 173(2) K |
| Space group |
P![[1 with combining macron]](https://www.rsc.org/images/entities/char_0031_0304.gif) |
P |
P21/n |
| a/Å | 6.2403(3) | 6.2259(2) | 6.299(1) |
| b/Å | 10.7398(4) | 10.8829(6) | 28.658(2) |
| c/Å | 14.7067(7) | 15.2046(8) | 10.987(1) |
| α/° | 98.713(3) | 94.029(2) | 90 |
| β/° | 91.987(2) | 100.875(3) | 102.579(3) |
| γ//° | 101.320(3) | 101.498(3) | 90 |
| Volume/Å3 | 953.20(7) | 985.15(8) | 1935.8(4) |
| Z | 2 | 2 | 4 |
| D c/g cm−3 | 1.193 | 1.154 | 1.175 |
| µ/mm−1 | 0.077 | 0.075 | 0.076 |
| F(000) | 372 | 372 | 744 |
| Crystal size/mm | 0.12 × 0.15 × 0.15 | 0.09 × 0.10 × 0.38 | 0.12 × 0.22 × 0.28 |
| 2 θ range//° | 2.22–25.68 | 2.23–25.67 | 2.84–25.36 |
| Limiting indices | ±7; ±13; ±17 | 0,7; −13,12; ±18 | ±7; ±33; ±12 |
| Reflections collected/unique | 6713/3616 | 6838/3722 | 10829/3532 |
| No. of parameters/restraints | 248/0 | 239/0 | 239/0 |
| Extinction coefficient | 0.032(5) | 0.016(3) | 0.008(3) |
| Goodness-of-fit | 1.029 | 1.021 | 1.000 |
| Final R indices [I > 2σ(I)] | R1 = 0.0470; wR2 = 0.1122 | R1 = 0.0443; wR2 = 0.1022 | R1 = 0.0564wR2 = 0.1433 |
| R indices (all data) | R1 = 0.0843; wR2 = 0.1320 | R1 = 0.0839; wR2 = 0.1202 | R1 = 0.1080wR2 = 0.1720 |
| Largest diff. peak and hole/e Å−3 | 0.424/−0.254 | 0.195/−0.211 | 0.467/−0.234 |
Results and discussion
Structures
The compound H·1-BuOH crystallises in the space groupP with Z = 2. There are thus two host and two guest molecules in the cell, all in general positions. The packing is shown in Fig. 1a, which displays the host molecules in double layers held by hydrophobic interactions, alternating with hydrophilic layers containing the 1-butanol guest molecules. The latter are hydrogen bonded to the host molecules, which are, in turn hydrogen bonded to each other. There are three unique hydrogen bonds: (Host)O1–H1⋯O1G(Guest), (Guest)O1G–H1G⋯O2(Host) and (Host)O2–H2⋯O1(Host), the metrics of which are given in Table 2. The hydrogen bonds form host⋯guest spirals in the [100] direction and host⋯host chains in [010] direction, as shown in Fig. 1b.
| Structures | Donor(D)–H/Å | H⋯Acceptor(A)/Å | D⋯A/Å | ∠D–H⋯A/° |
|---|---|---|---|---|
| H· 1-BuOH | ||||
| O1–H1⋯O1G | 0.98(3) | 1.65(3) | 2.624(2) | 172(2) |
| O2–H2⋯O1 | 0.94(3) | 1.76(3) | 2.694(2) | 172(2) |
| O1G–H1G⋯O2 | 0.91(3) | 1.84(3) | 2.742(2) | 174(3) |
| H·iso-BuOH | ||||
| O1–H1⋯O1G | 0.89(3) | 1.71(2) | 2.602(2) | 177(2) |
| O2–H2⋯O1 | 0.98(2) | 1.69(3) | 2.671(2) | 173(2) |
| O1G–H1G⋯O2 | 0.86(2) | 1.87(2) | 2.722(2) | 172(2) |
| H· 2-BuOH | ||||
| O1–H1⋯O1G | 0.92(4) | 1.71(4) | 2.593(2) | 162(4) |
| O2–H2⋯O1 | 0.90(3) | 1.77(3) | 2.676(2) | 175(2) |
| O1G–H1G⋯O2 | 0.92(3) | 1.80(3) | 2.719(3) | 177(3) |
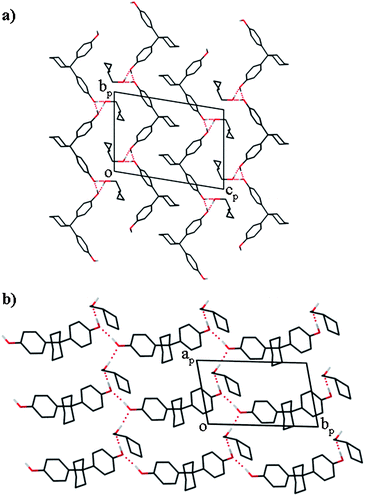 | ||
| Fig. 1 Projections of the crystal structure of H·1-BuOH. The 1-butanol guest is shown as disordered. All the hydrogen atoms are omitted except the hydroxyl hydrogens and the hydrogen bonds are shown as dotted lines. | ||
The 1-butanol guest molecules are disordered, with C3G distributed over two positions with site occupancies of 0.75 and 0.25, respectively. The packing of the H·iso-BuOH and H·2-BuOH is essentially the same as that of H·1-BuOH, and we have compared them by Hirshfeld surface analysis of the three structures using the CrystalExplorer program.9–11 The fingerprint plots of the host are shown in Fig. 2. Each structure exhibits two distinct spikes, labelled (1) and (2), and wings, labelled as (3). (1) is associated with hydrogen bonds, (2) is associated with H⋯H contacts and (3) is associated with C⋯H contacts. These occur in each structure. We have displayed two plots for H·1-BuOH, one for each of the two disordered guests, whose site occupancy factors are 75 and 25%, respectively. We observe enhanced C–H contacts in the latter. We note, in addition, the area labelled (4) in the H·iso-BuOH structure. This is due to a vacant space in the structure, an unusual feature, which has however been noted in the structure of unsolvated carbamazepine.12 We traced this by analysing the vacant space in the structure, by employing the program Section.13 We noted a vacant space centred at x ≅ 0.22, y ≅ 0.25, z ≅ 0.05, a feature which did not occur in the other structures. In addition, we carefully examined the difference electron maps, but could find no peaks in this region. The similarity between the three structures is also summarised by the percentage area14 of the contacts of type H⋯H, C⋯H and O⋯H, which are:
| H· 1-BuOH | 68.3% 19.0% 12.7% |
| H·iso-BuOH | 68.1% 18.4% 13.4% |
| H· 2-BuOH | 68.2% 19.0% 12.8% |
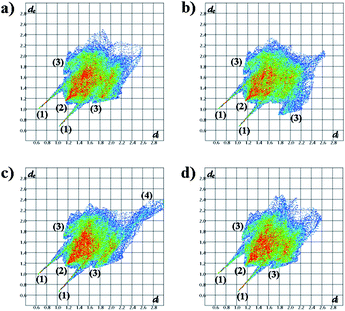 | ||
| Fig. 2 Hirshfeld surface fingerprint plots of the hosts in structures (a) H·1-BuOH with 75% guest component; (b) H·1-BuOH with 25% guest component; (c) H·iso-BuOH; (d) H·2-BuOH. | ||
Selectivity
The results of the two component competition experiments are shown in Fig. 3(a, b and c), in which the mole fractions X of a given butanol isomer in the mother liquor are plotted against the mole fractions Z found in the crystal.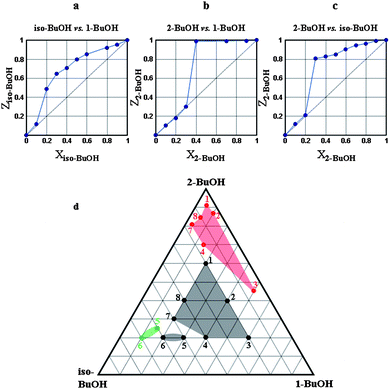 | ||
| Fig. 3 Results of two- and three-component competition experiments. | ||
In Fig. 3a, iso-butanol is favoured over 1-butanol for the whole competition range of the mixtures, with a selectivity constant Kiso-BuOH:1-BuOH ≅ 3.3. In Fig. 3b we note that 2-butanol is only selected over 1-butanol when X2-BuOH > 0.3 and, similarly, 2-butanol is selected over iso-butanol when X2-BuOH > 0.2. Fig. 3d shows the results of the three isomers in simultaneous competition, and the apices of the equilateral triangle represent the pure isomers. The starting compositions (black dots) reveal a drift towards 2-butanol (red dots) upon enclathration by the host, except for when the starting mole fraction of iso-butanol is high. The split occurs when Xiso-BuOH > 0.45 and X2-BuOH < 0.25, giving rise to the green area of Fig. 3d.
In summary, the competition experiments show that the selectivity preference is in the order
H· 2-BuOH > H·iso-BuOH > H·1-BuOH
Stability
We recorded the DSC traces of the three compounds. These are characterised by an initial endotherm due to the release of the butanol guest followed by the endotherm of the host melt. The results are summarised in Table 3 in which we note that Ton − Tb or Tpeak − Tb, which are a measure of the stability of the host–guest compound,15 convincingly follows the sequenceH· 2-BuOH > H·iso-BuOH > H·1-BuOH
This result is in agreement with that derived from the competition experiments.
| Compound | T b a | T on a | T on − Tb | T peak a | T peak − Tb |
|---|---|---|---|---|---|
| a T b is the normal boiling point of the guest; Ton and Tpeak are the onset and peak temperature of the endotherm corresponding to the guest release. | |||||
| H· 1-BuOH | 117 | 111.5 | −5.5 | 113.8 | −3.2 |
| H·iso-BuOH | 108 | 120.6 | 12.6 | 129.0 | 21.0 |
| H· 2-BuOH | 99.5 | 132.0 | 32.5 | 136.7 | 37.2 |
We also calculated the lattice energies of the three inclusion compounds using the technique of atom–atom potentials. We employed the program OPIX16 which has atom pair potentials of the form Uij = Aexp(−BRij) − CR6ij, where Rij is the interatomic distance and the constant A, B and C have been parameterised against the known sublimation energies of selected organic compounds. For these calculations we employed parameters which are derived from the final structure refinement and in which the C–H distances were fixed at 1.08 Å and the O–H distances were those obtained from freely refined H atom positions. We obtained the following lattice energies in kJ mol−1:
H· 1-BuOH −211.7
H·iso-BuOH −202.9
H· 2-BuOH −215.5
This is disappointing in that they do not follow the sequence found in the competition experiments nor that of the thermal analysis. We note however that the butanol guest in the H·1-BuOH structure was disordered, giving rise to unreliable bond lengths and angles for one of the CH2 moieties. We note in addition that the results are close, with a maximum difference of ca. 6%, and we surmise therefore that the parameters defining the force field may not be sufficiently precise to yield a reliable answer.
Experimental
X-Ray single crystal structure
Data were collected on a Nonius KappaCCD diffractometer with graphite monochromated MoKα radiation. The temperature was controlled with an Oxford Cryostream system. The structures were solved by direct methods and refined by least-squares with SHELXL-9717 refining on F2. All non-hydrogen atoms were refined anisotropically, and all hydrogen atoms bound to carbon were refined with geometric constraints as a riding model but hydroxyl hydrogens were first located in the electron density maps and refined with independent isotropic temperature factors.Competition experiment
These were carried out by dissolving 50 mg of the host in mixtures of two or three guests with known mole fractions. The guest mixture was always in excess with a Host:total Guest ratio of approximately 1:20. The ensuing crystals were dried on blotting paper and the ratio of host:guests in the crystals were analysed by NMR spectroscopy on a Varian Unity 400MHz spectrometer. Appropriate integrations were carried out: the host from aromatic protons in the region δ = 7.0–7.2, 1-butanol methyl protons at δ = 0.78, 2-butanol methyl protons at δ = 0.89 and 1.17 and iso-butanol CH2protons at δ = 3.4. The results yielded a constant crystal stoichiometry of Host:total Guest of 1:1.
Thermal analysis
Differential scanning calorimetry (DSC) was performed on a Perkin-Elmer PC7 Series thermal station and was recorded at 10 °C min−1 in the temperature range 30–300 °C with sample masses in the range 3–6 mg and with a dried nitrogen gas purge at 40 mL min−1.Conclusions
The diol host 1,2-bis(4-hydroxyphenyl)cyclohexane forms inclusion compounds with isomers of butanol which all have host:guest stoichiometries of 1:1 and similar packings. The structures are stabilised by host⋯host and host⋯guest hydrogen bonds. Competition experiments show a preferred selectivity in the sequence 2-butanol > iso-butanol > 1-butanol. This correlates with thermal stabilities measured by DSC but not with the calculated lattice energies.
Acknowledgements
We thank Mr Peter Roberts for obtaining the NMR spectra and advising on their interpretation.References
- J. W. Steed, D. R. Turner and J. K. Wallace, in Core Concepts in Supramolecular Chemistry and Nanochemistry, Wiley, Chichester, 2007, Chapter 1, pp 4–27 Search PubMed.
- A. M. Pivotar, K. T. Holman and M. D. Ward, Chem. Mater., 2001, 13, 3018 CrossRef.
- L. R. Nassimbeni, in Separations and Reactions in Organic Supramolecular Chemistry, ed. F. Toda and R. Bishop, Wiley, Chichester, 2004, ch. 5, p. 123 Search PubMed.
- M. R. Caira, T. Le Roex and L. R. Nassimbeni, CrystEngComm, 2006, 8, 275 RSC.
- K. Nakano, E. Mochizuki, N. Yasui, K. Morioka, Y. Yamauchi, N. Kanehisa, Y. Kai, N. Yoswathananout, N. Tohnai, K. Soda and M. Miyata, Eur. J. Org. Chem., 2003, 242, 2436.
- M. Fogagnolo, G. Fantin and O. Bortolini, Int. J. Mol. Sci., 2007, 8, 662 Search PubMed.
- S. A. Bourne, K. C. Corin and L. R. Nassimbeni, Supramol. Chem., 2006, 18, 587 CrossRef CAS.
- S. A. Bourne, K. C. Corin, L. R. Nassimbeni and F. Toda, Cryst. Growth Des., 2005, 5, 379 CrossRef CAS.
- S. K. Wolff, D. J. Grimwood, J. J. McKinnon, D. Jayatilaka and M. A. Spackman, CrystalExplorer 2.0, University of Western Australia, Perth, Australia Search PubMed.
- J. J. McKinnon, M. A. Spackman and A. S. Mitchell, Acta Crystallogr., Sect. B, 2004, 60(6), 627 CrossRef.
- M. A. Spackman and J. J. McKinnon, CrystEngComm, 2002, 4, 378 RSC.
- F. P. A. Fabbiani, L. T. Byrne, J. J. Mckinnon and M. A. Spackman, CrystEngComm, 2007, 9, 728 RSC.
- L. J. Barbour, J. Appl. Chem., 1999, 32, 353 Search PubMed.
- J. J. McKinnon, D. Jayatilaka and M. A. Spackman, Chem. Commun., 2007, 37, 3814 Search PubMed.
- L. R. Nassimbeni, Acc. Chem. Res., 2003, 36, 631 CrossRef CAS.
- A. Gavezzotti, OPIX, A computer program package for the calculation of intermolecular interactions and crystal energies, University of Milan, 2003 Search PubMed.
- G. M. Sheldrick, SHELXL-97: Program for the Refinement of Crystal Structures, University of Göttingen, 1997 Search PubMed.
Footnote |
| † CCDC reference numbers 696305–696307. For crystallographic data in CIF or other electronic format see DOI: 10.1039/b812887a |
| This journal is © The Royal Society of Chemistry 2009 |