Rapid method for qualitative detection of 2,4,6-trinitrotoluene in environmental water samples
Evgenia Yu.
Basova
a,
Irina Yu.
Goryacheva
*a,
Dmitry A.
Mikhirev
a,
Tatiana Yu.
Rusanova
a,
Natalia A.
Burmistrova
a,
Barbara
Kerkaert
b,
Tania
Cucu
b,
Sarah
De Saeger
c and
Bruno
De Meulenaer
b
aDepartment of Common and Inorganic Chemistry, Chemistry Institute, Saratov State University, Astrakhanskaya 83, 410012, Saratov, Russia. E-mail: goryachevaiy@info.sgu.ru; Fax: +7 8452516959; Tel: +7 8452516959
bResearch Group Food Chemistry and Human Nutrition, Department of Food Safety and Food Quality, Faculty of Bioscience Engineering, Ghent University, Coupure Links 653, B-9000, Ghent, Belgium
cLaboratory of Food Analysis, Department of Bioanalysis, Faculty of Pharmaceutical Sciences, Ghent University, Harelbekestraat 72, B-9000, Ghent, Belgium
First published on 16th November 2009
Abstract
A gel-based immunoassay that can be used for the detection of 2,4,6-trinitrotoluene (TNT) in water samples was developed. Four polyclonal antibodies were generated in chickens using TNT derivatives. The assay was based on the immunoaffinity preconcentration and immuno-enzyme analysis of TNT in the gel. The results of the assay, assessed by color development, were evaluated visually and also by using a flatbed scanner and subsequent digital processing of the scanned gel. The most sensitive color mode, parameter S (saturation, HSB mode), was used for the immunoassay optimization and evaluation of the results. The immunoassays with the best parameters were optimized and characterized. A cut-off level of 5 µg TNT L−1 was reached for water samples. It was shown that tap and environmental water samples could be analyzed directly, without sample preparation and dilution. The developed test is acceptable for use in an on-site field test to provide rapid (about 15 min for six samples), qualitative and reliable results for making environmental decisions such as identifying “hot spots”, monitoring of military and terrorist activities, and selecting of site samples for laboratory analysis.
Introduction
The detection of 2,4,6-trinitrotoluene (TNT) is an important environmental, security and health concern for the global community. TNT enters the environment in waste waters and solid wastes resulting from the manufacture of the compound, the processing and destruction of bombs and grenades, and the recycling of explosives; different military and terrorist activities (e.g., manufacturing, waste discharge, testing and training) have resulted in extensive contamination of soil and ground water by TNT.1Generally, liquid–liquid extraction or solid-phase extraction followed by analysis with gas or liquid chromatography are used. But these assays require preconcentration of analyte and are relatively time-consuming and difficult to perform on-site. Consequently, sensitive and reliable analytical methods are needed to evaluate the presence of TNT in field conditions.
Immobilized biomolecules are emerging as a popular analytical tool because of their reusability and sensitivity. This has led to the development of a wide variety of immunoassay detection systems in numerous fields. As solid supports for biomolecules immobilization different kinds of plates, incl. microtiter plates,2 beads,3 waveguides,4gold surface,5–7membranes,8etc. are used, which enabled to develop different kinds of tests for TNT detection. The tests were developed for laboratory and non-laboratory application that use simple equipment: ELISAs,2 different kinds of sensors,9–12 fluoroimmunoassays13 and microarray techniques.14
Non-instrumental rapid tests could be a method of choice for the screening of explosives and other environmental pollutants because they can be promptly performed outside a laboratory environment, in the place of sampling (even without power supply). Rapid tests with visual result evaluation are based mostly on membranes. Lateral flow tests for TNT detection were reported in the review, Ref. 15. For optimization of the membrane-based tests16,17 and also for improvement of test sensitivity18,19 different kinds of reader were used as a quantitative test system, making the on-field application more difficult.
Recently gel-based rapid tests for mycotoxins and PAH detection have been developed.20–23 Gel-based immunoassay enabled combination preconcentration with an immunoaffinity column and detection of analyte by an enzymatic reaction. As the sample solution is drawn through the column, the analyte concentrates on specific antibody binding sites. The next applied enzyme-analyte conjugate (tracer) could be bound by an antibody only if they are not occupied by an analyte. Consequently, the intensity of the color developed after chromogenic substrate application is in inverse relationship with the analyte concentration. In the presence of analyte no color development occurs. The development of any color at detection time was interpreted as a negative result. So the main source of errors originates from a wrong interpretation of the developed color.
We herein report the development of a rapid test for TNT detection. Different readers and color system parameters were examined for results evaluation in comparison with results, evaluated with the naked eye.
Experimental
Materials
TNT standard and 2,4,6-trinirobenzenesulfonic acid (TNBS) were supplied from “Supelco” (Bornem, Belgium). Tween 20 (Tween) was purchased from Sigma Chemical Co. (Bornem, Belgium). CNBr-activated Sepharose 4B (Sepharose) was supplied from GE Healthcare Bio-Sciences (Uppsala, Sweden). The substrate chromogenic solution used was Colorburst™Blue TMB/Peroxide (ALerCHEK, Inc. USA). 4-amino-2,6-dinitrotoluene (4-ADNT) and 2-amino-2,6-dinitrotoluene (2-ADNT) were purchased from Promochem (Wesel, Germany).N-hydroxysuccinimide (NHS) was supplied from Sigma (Steinheim, Germany). N,N′-dicyclohexylcarbodiimide (DCC) were purchased from Sigma (Poole, Dorset, UK). Soybean trypsin inhibitor (STI), bovine serum albumin (BSA), chicken egg albumin (ovalbumin, OVA), horse-radish peroxidase (HRP), were supplied from Sigma (Steinheim, Germany). All the other chemicals and solvents were of analytical grade; doubly distilled water was used throughout. Tubes (Bond Elut reservoir, 1 ml) and polyethylene frits (1/4 in. diameter) were supplied by Varian Belgium NV/SA (Sint-Katelijne-Waver, Belgium).
Phosphate-buffered saline (PBS) 0.01 M, pH 7.4, was used as an assay buffer for the gel-based immunoassay. Proclin 300 (5-chloro-2-methyl-4-isothiazolin-3-one and 2-methyl-4-isothiazolin-3-one) was purchased from Supelco (Bellefonte, PA, USA) and was added to PBS as an antimicrobial preservative. PBS with 0.05% Tween (v/v) was used as a wash solution. Stock solutions of TNT, toluene, 4-ADNT, 2-ADNT, and TNBS, (100 mg L−1) were prepared in acetonitrile and diluted with water to obtain standard solutions which cover the concentration range 1–1000 µg L−1.
Immunogen synthesis
4-ADNT–GA was activated by standard succinimide method. 11.5 mg (100 µmol) of NHS and 20.6 mg (100 µmol) of DCC were dissolved in 1 ml of pure dimethyl formamide (DMF). 12.5 mg (40 µmol) of 4-ADNT-GA was dissolved in 400 µl of this solution. The reaction mixture was incubated overnight at the room temperature. Then it was centrifuged at 9000 g for 10 minutes and the supernatant was used for coupling with proteins.
STI (0.5 µmol) was dissolved in 2 ml of 50 mM carbonate buffer (pH 9.6) with addition of 5% (vol.) DMF. 150 µl of 4-ADNT-GA NHS ester solution was added drop by drop under stirring (mole ratio hapten/protein was 30![[thin space (1/6-em)]](https://www.rsc.org/images/entities/char_2009.gif) :1). The reaction mixture was incubated overnight at the room temperature and then dialyzed in distilled water at 4 °C during 3 days. After that conjugate was lyophilized and kept at 4 °C until immunization. The synthetic pathway is given in Fig. 1A.
:1). The reaction mixture was incubated overnight at the room temperature and then dialyzed in distilled water at 4 °C during 3 days. After that conjugate was lyophilized and kept at 4 °C until immunization. The synthetic pathway is given in Fig. 1A.
 :1), then mixed and incubated overnight at the room temperature. Methods of purification and storage were the same as described above. The synthetic pathway is given in Fig. 1B.
HRP conjugates synthesis
:HRP was 3:1. The reaction mixture was incubated overnight at the room temperature, then dialysed in 3 l deionised water at 4 °C during 3 days. The conjugate solution was labeled as 4-ADNT–GA and stored at a concentration of 0.2 mg ml−1 in 50% glycerol at −20 °C.
:1). After the reaction, the conjugate mixture was dialysed in 3 l deionized water at 4 °C for 3 days. The produced TNB–HRP conjugate was stored at a concentration of 0.2 mg ml−1 in 50% glycerol at −20 °C.
Immunization and immunoglobulin isolation
Chickens were immunized adapting the method originally described by De Meulenaer et al.25 Briefly, 4-ADNT–GA–STI, TNB–BSA, TNB–STI, TNB–OVA, conjugates were dissolved in PBS. The concentration was 0.5 mg ml−1. These solutions were mixed with complete Freud's adjuvant 1:1 and emulsified. The chickens were injected with 1 ml of emulsion intramuscularly. The second immunization was 40 days later, and the incomplete Freud's adjuvant was used instead of the complete one. Totally 3 chickens were immunized with each conjugate and 3 more chickens were used as a blank control.
The immunoglobulins were isolated from the egg yolk using a modified aqueous dilution method.25,26 After separation of the egg yolk from the egg white, it was washed with in 300 ml distilled water by manually stirring the egg yolk without breaking it. The egg yolk was broken, separated from the sieve and diluted with distilled water 10 times, and pH was set with 1 M HCl between 5.0 and 5.2. After incubation for 16 h at 4 °C and centrifugation (10000g, 1 h, 4 °C), the supernatant was filtered. Then 72 g of ammonium sulfate and about 170 mL of water was added in order to achieve a 60% saturated solution of ammonium sulfate, the mixture was incubated for 1 h at room temperature (RT) and centrifuged (10000g, 20 min, RT). The residue was dissolved in a 19% (w/v) sodium sulfate solution. After it was incubated for 20 min at RT and centrifuged (2000g, 20 min, RT), the residue was dissolved in a 14% (w/v) sodium sulfate solution. After it was incubated for 20 min at RT and centrifuged (2000g, 20 min, RT), the residue was dissolved in sixth of PBS and stored in small aliquots at −18 °C.
Gels preparation
Gel coupled with anti-TNT antibody and blocked gel preparation was adapted from Goryacheva et al.21 Namely, for coupled gel preparation 0.5 g of freeze-dried Sepharose (gave about 1.7 ml final gel volume) was washed on a sintered glass filter using 100 ml 1 mM HCl. For antibody binding, 250 µl of antibody solution (1 mg ml−1) and 100 µl of PBS were added and this suspension was shaken for 2 h at RT. After incubation, the gel was washed with 5 ml of NaHCO3buffer, 0.1 M, pH 8.3 containing 0.5 M NaCl to remove excess antibody. For the blocking remaining active groups five gel volumes of the blocking agent (0.2 M glycine, pH 8.0) were added to the gel and mixed for 2 h at RT. Furthermore, the gel was washed with 3 cycles of alternating pH and five gel volumes of each buffer. Each cycle consisted of a wash with 0.1 M acetate buffer, pH 4.0, containing 0.5 M NaCl followed by a wash with NaHCO3buffer, 0.1 M, pH 8.3 containing 0.5 M NaCl. The blocked gel was prepared by the same way except for a binding step.The gel coupled with anti-TNT antibody and the blocked gel were suspended in PBS (1/3, v/v) and stored at 4 °C.
Column test preparation
To prepare the assay gel for the test layer, the gel with coupled specific anti-TNT antibody was mixed with the blocked gel. Dilution of the coupled gel was necessary to decrease the quantity of antibody specific binding sites and thus to increase sensitivity. The optimal ratio was found to be 1:200. The assay gel (200 µl) was placed on the bottom frit in the 1 ml tube and then covered with the second frit.
Assay procedure
For the assay procedure an aliquot of 5 ml of the standard TNT solutions or water sample (0, 1.0, 3.0, 5.0 or 10 µg L−1) was drawn into the tube through the top by the plunger of 10-ml syringe. The next step was the application of 4-ADNT–GA–HRP conjugate solution (50 µl) in appropriate dilution (1:4000, 0.05 µg ml−1) through the bottom of the tube. The test layer was incubated with the conjugate solution for 1 min. For removing the excess of conjugates, PBS–Tween 0.2% (v/v, 3 ml) was passed through the top of the tube. The last step was the application of the chromogenic substrate (50 µl) via the bottom of the tube (Fig. 2). The color of the test layer was visually evaluated in 3 minutes after chromogenic substrate application. The cut-off level was validated as the lowest TNT concentration which did not result in color development during this detection time.
 | ||
| Fig. 2 Scheme of the assay procedure. | ||
Quantitative results interpretation
To evaluate the possibility for quantitative data interpretation, three kind of reading machines were used: flatbed scanner (“CanoScan LiDE 25”, Canon), digital photocamera (DiMADE S414, Konika-Minolta) and a densitometer (“Sorbfil”, Sorbpolimer, Krasnodar, Russia, equipped with digital videocamera NV-RZ17, Panasonic). The whole columns with the test layers were placed on the flatbed scanner or in the densitometer. The images were saved in JPEG format. To evaluate the obtained images “Adobe Photoshop CS3” was used and values of all possible parameters were tested: red (R, non-dimensional value), green (G, non-dimensional value), blue (B, non-dimensional value) (RGB mode); hue (H, °), saturation (S, %), brightness (B, %) (HSB mode); cyan (C, %), magenta (M, %), yellow (Y, %), black (K, %) (CMYK mode); lightness (L, non-dimensional value) and also color ranges a and b (non-dimensional values) (Lab mode). For that, a rectangular zone of the gel was selected, lens blur filter was applied and the values of each of the above mentioned parameters was obtained using the Color Picker dialog box, which directly displays the values. At least three measurements were performed for each column (by turning the column) and the average value was used further.Determination of 2,4,6-trinitrotoluene in water samples
The anti-TNB–BSA antibody, the 4-ADNT–GA–HRP conjugate and four water types (lake water, river water, melted snow and tap water) were used for the investigation of matrix influence on the developed gel-based immunoassay. The surface water samples were collected near the banks of the river Volga (pH 6.2) and a lake from the town park (Saratov) (pH 5.3). The tap water (pH 5.1) was obtained from the local water supply system using Volga river water as a source. Snow was collected in the central part of Saratov city and melted at the room temperature (pH 4.8). The surface water samples and snow were collected in glass bottles (1 L) and directly used for the immunoassay, i.e. without any sample pretreatment like filtration or extraction.Results and discussion
Minimization of nonspecific interaction
The Sepharose gel has a higher specific surface compared to traditionally used membranes and other solid supports. Generally, this permits use of high sample volume and thus high assay sensitivity can be achieved. On the other hand, nonspecific sorption on the surface could also be sizeable. So the first step of the optimization was to look for those experimental conditions to minimize nonspecific sorption of the tracer. Columns with only blocked gel were prepared and tracer solution, washing buffer and chromogenic substrates were applied as it was described in Experimental section.In a first series of experiments, the composition of the HRP-conjugate solution was optimized. It was shown that in the case of 4-ADNT–GA–HRP dilution at 1:100 in PBS and washing with 5 ml of PBS, the development of the blue color started immediately after the application of the chromogenic substrate. A similar 4-ADNT–GA–HRP dilution in PBS containing 0.1% casein (w/v) as well gave a clear reduction of color development, which indicated diminution of the nonspecific interaction. Therefore, PBS −0.1% casein (w/v) was used for the dilution of the tracer in further experiments.
In order to find the optimal conditions, three columns were prepared: the first one without specific antibody (to control nonspecific interaction) and the others with specific antibodies (anti-4-ADNT–GA–STI antibody, dilution at 1:40). Blank solution (5 ml) was passed through the first and second columns and solution with 10 µg L−1TNT (5 ml) through the third column. According to our previous developments, the optimal region of immunoreagents' concentration provides color development within 2–10 min in the case of absence of analytes. Dilutions of HRP conjugates at 1:100, 1:200, 1:500, 1:1000, 1:2000, 1:4000, 1:6000 in PBS −0.1% casein (w/v) were tested and dilution at 1:4000 (0.25 µg ml−1) was chosen for 4-ADNT–GA–HRP as optimal. For the TNB–HRP tracer optimal dilution was found at 1:200 (5 µg ml−1). An application of higher concentrations of conjugates resulted in too fast color development and less difference in the color intensity for spiked and blank solutions. Lower concentration of HRP conjugates resulted in weak and slow color development.
To optimize the washing procedure, PBS–Tween (Tween concentration at 0, 0.05, 0.2, 0.4% v/v) and PBS–casein (casein concentration at 0, 0.1, 0.5, 1% w/v) at a volume of 2, 3, 5, 7 ml were evaluated. Usually, increasing the volume of washing solution and surfactant concentration results in the minimization of the nonspecific interactions. However, both may result in a decrease of the specific interactions between coupled antibody and analyte, thus reducing the assays' sensitivity. The optimal result (color development in the second column and no color development in the first and third columns) was provided by the application of 3 ml of PBS–Tween (0.2% v/v).
Antibody testing and application of detection equipment
To check the binding of HRP-conjugates to different antibodies, four different gels with bound antibodies were prepared, diluted 5 times with the blocked gel and placed between two frits into the columns. One column, containing only blocked gel, was used as a control for nonspecific interaction. 4-ADNT–GA–HRP conjugate (50 µl) was applied to each column and after the washing step (3 ml of PBS–Tween (0.2% v/v)) 50 µl of chromogenic substrate was added. Results obtained for 4-ADNT–GA–HRP are presented in Fig 3A. The blocked gel remained white for 10 minutes. A very slow color development indicated a lack of nonspecific sorption of the tracer on the gel. The same procedure was repeated for TNB–HRP-conjugate (Fig. 3B). The outcomes for the two conjugates were similar. The most intense color and fast color development were for the 4-ADNT–GA–HRP tracer, in combination with the anti-TNB-BSA antibody or the anti 4-ADNT–GA–STI antibody. These indicated the good binding of the tracer with the antibodies. For anti-TNBS-OVA antibody and anti-TNBS–STI antibody the color development was less intense. | ||
| Fig. 3 Response of the gels coupled with different antibodies and blocked gel to HRP–conjugates. A: scanning image, tracer 4-ADNT–GA–HRP; B: scanning image, tracer TNB–HRP; C: parameter R values (RGB mode); D: parameter H values (HSB mode); E: parameter S values (HSB mode). Detection time is 10 min. | ||
In order to enable a quantitative interpretation of the data, the color of the gels was electronically assessed as described in the experimental section. In preliminary experiments it was shown that images, obtained with densitometer, characterized with a bad image definition quality. Digital photo camera was high sensitive to any changes in light conditions. Application of digital camera with “black box” also was not successful. For this reason flatbed scanner was further employed.
It was observed that the most sensitive parameters were R, H and S for images, obtained with the flatbed scanner and digital processing using Adobe Photoshop CS3. Fig. 3C–E presents the value of R, H and S parameters for the gels shown in Fig. 3A and 3B. As can be observed, parameter S (Fig. 3E) showed to be the most sensitive, since it changed from 4–6 value for white blocked gel up to value of 46 for both tracers in combination with the of TNB–BSA antibody. Consequently, parameter S was selected for the quantitative evaluation of the results in further optimization experiments. The comparison of the obtained qualitative (the naked eye) and quantitative (parameter S) results evaluation showed us that the color, perceptible as white by the naked eye, corresponds to 3–4 up to 6–7 range of parameter S. Blue color corresponds to S value above 8. At least three measurements were performed for each column by turning the column. It was shown that the absolute deviation between obtained parameter S values did not exceeded 1 unit. Reproducibility from column to column depended on the color intensity. Maximal absolute deviation for S value was for intense colored gels (parameter S value >25) and did not exceed 3 (relative deviation ∼12%).
Sensitivity of tests
The four pairs of immunoreagents, which gave the most intense color (pair A: anti-TNB–BSA antibody and 4-ADNT–GA–HRP; pair B: anti-4-ADNT–GA–STI antibody and 4-ADNT–GA–HRP; pair C: anti-TNB–BSA antibody and TNB–HRP; and pair D: anti-4-ADNT–GA–STI antibody and TNB–HRP) were chosen for further development. A series of TNT standard solutions were analyzed. The optimal concentration of specific antibodies was adjusted by dilution of the antibody-coupled gel with the blocked gel in a 1:5 to 1:400 range. The highest effective dilution of the coupled gel, which provided the best sensitivity, was 1:200 for both antibodies in combination with 4-ADNT–GA–HRP dilution at 1:4000 or TNB–HRP dilution at 1:200. As can be observed from Fig. 4A and 4C, 4-ADNT–GA–HRP in combination with both antibodies enabled to distinguish TNT concentrations in the range of 0, 1, 3, 5, and 10 µg L−1. The blank solution resulted in the most rapid color development. Increasing TNT concentrations gave rise to a decrease of both color intensity and rate of its development. Application of TNB–HRP with both antibodies (Fig. 4B and 4D) resulted in not so good difference in intensity developed color. Therefore, the combinations of anti-TNB–BSA and anti-4-ADNT–GA–STI antibodies with 4-ADNT–GA–HRP were chosen for further experiments in which the cut off value of the assay was determined. As the detection time, 3 min was chosen because of the good difference in the developed color, which was in fact easily distinguishable by the naked eye. It was shown that to color development could be stopped by the washing buffer application (to remove chromogenic substrate). The obtained results are presented in Fig. 5. TNT concentration higher than 5 µg L−1 resulted in no color development (evaluated by naked eye). Comparison of the quantitative color development results showed that both tested antibodies (anti-TNB–BSA and anti-4-ADNT–GA–STI) enabled to get a reasonable sensitivity.
 | ||
| Fig. 4 Kinetics of the color development for series of TNT concentrations C (TNT): 1 – 0 µg L−1; 2 – 1 µg L−1; 3 – 3 µg L−1; 4 – 5 µg L−1; 5 – 10 µg L−1. Detection time is 3 min (dashed line). A: anti-TNB–BSA antibody (coupled gel dilution at 1:200) and 4-ADNT–GA–HRP (dilution at1:4000); B: anti-4-ADNT–GA–STI antibody (coupled gel dilution at 1:200) and 4-ADNT–GA–HRP (dilution at 1:4000); C: anti-TNB–BSA antibody (coupled gel dilution at 1:200) and TNB–HRP (dilution at 1:200); D: anti-4-ADNT–GA–STI antibody (coupled gel dilution at 1:200) and TNB–HRP (dilution at 1:200). | ||
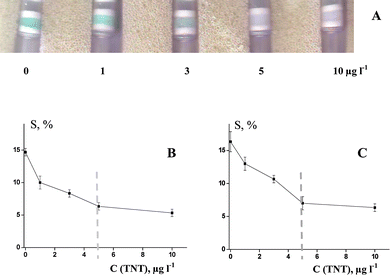 | ||
| Fig. 5
TNT determination with tracer 4-ADNT–GA–HRP (dilution at 1:4000). A: Scanning image, gel coupled with anti-TNB–BSA antibody; B: Parameter S values, gel coupled with anti-TNB–BSA antibody (n = 3); C: Parameter S values, gel coupled with anti-4-ADNT–GA–STI antibody (n = 3). Detection time is 3 min. Dashed lines present the cut-off level of the assay. | ||
Time-dependent response of immunoassay for TNT, toluene and also for haptens, used for conjugate synthesis, was examined and compared (Fig. 6). The results showed that the blocked gel remained white for 5 min and afterwards an insignificant color developed. The most rapid color development (after 1 min) was obtained for the blank (curve 1) and toluene solution (curve 2). Color development for the TNT solution at the cut off level (curve 6) and for haptens at the same concentrations (curves 3–5) started in 4 min after the chromogenic substrate application. As 2-ADNT and 4-ADNT are also metabolites of TNT and could appear in water samples. It should be mentioned that the proposed assay could detect only their total amount.
 | ||
| Fig. 6 Kinetics of the color development for 1: blank solution; 2: toluene; 3: 4-ADNT; 4: 2-ADNT; 5: TNBS; 6: TNT (tracer 4-ADNT–GA–HRP, dilution at 1:4000). A: gel coupled with anti-TNB–BSA antibody; B: gel coupled with anti 4-ADNT–GA–STI antibody. C (analyte) = 5 µg L−1. For comparison the results for TNT application to gel without an antibody (blocked gel) are also presented. | ||
Validation of the test using spiked water samples
To assess TNT in different water types, we used surface water from a river and a lake, tap water and melted snow for the investigation of matrix effect, e.g. the interference of other sample constituents such as humic acids. The evaluation of the matrix effect was done by comparing the standard curves run in different water types (Fig. 7). Standard curves run in the standard solutions, in the tap water and in the melted snow were almost identical, i.e. no interferences were found. A slight decrease of the intensity of blue color was observed when the lake water and the river water were analyzed. In the case of a quantitative assay this could result in the overestimation of the analyte, especially at low concentrations. For qualitative test with the cut-off level at 5 µg L−1 this was not critical, because TNT at 5 µg L−1 completely suppressed the color development in all tested water types. The blank sample and sample spiked with TNT at 1 µg L−1 produced blue color after the chromogenic substrate application. For the river water and the lake water at 3 µg L−1 of TNT (S value at 7.0 ± 1.0 and 7.4 ± 0.6, respectively) the color of the gel was almost white and could overcome false positive results. For no water types false negative results were obtained, so this test could be recommended for TNTon-site screening in water samples with a cut-off level at 5 µg L−1. | ||
| Fig. 7 Dose–response of the gel-based immunoassay with 4-ADNT–GA–HRP for TNT prepared with anti TNB–BSA antibody in different water types (n = 3). | ||
The reason of the relatively week matrix effect for samples without any sample pretreatment was a big volume of washing buffer (3 ml of PBS–Tween 0.2% v/v), which removed most of interfering substances.
Conclusions
A non-instrumental test for TNT rapid screening in water with a control level at 5 µg L−1 was developed with chicken antibodies, produced against two different haptens. The application of scanning the gels and digital processing of the color data, gave the possibility to use quantitative parameters for the development of the assay. In the present study a flatbed scanner was evaluated as the detection equipment for immunoassays. This permitted us to compare assay selectivity and sensitivity, to choose optimal immunoreagents and conditions of assay. Homological (anti-4-ADNT–GA–STI antibody and 4-ADNT–GA–HRP) and heterological (anti-TNB–BSA antibody and 4-ADNT–GA–HRP) pairs of immunoreagents were found to be optimal for TNT screening. There was no necessity for sample preparation like extraction, centrifugation, filtering etc. We suggest that the proposed assay could be applied to non-instrumental in situ monitoring of TNT in complex matrices such as surface water, rainfall, and ground water.Acknowledgements
The research was supported by NATO Collaborative Linkage Grants CBP.NR.CLG.982651 “New strategy for biodetection of explosive nitro-chemicals in environmental samples”.References
- N. Miura, D. R. Shankaran, T. Kawaguchi, K. Matsumoto and K. Toko, Electrochemistry, 2007, 75, 13–22 CAS.
- P. M. Kramer, E. Kremmer, C. M. Weber, I. M. Ciumasu, S. Forster and A. A. Kettrup, Anal. Bioanal. Chem., 2005, 382, 1919–1933 CrossRef.
- L. C. Shriver-Lake, P. T. Charles and A. W. Kusterbeck, Anal. Bioanal. Chem., 2003, 377, 550–555 CrossRef CAS.
- K. E. Sapsford, P. T. Charles, C. H. Patterson and F. S. Ligler, Anal. Chem., 2002, 74, 1061–1068 CAS.
- R. Wilson, C. Clavering and A. Hutchinson, Analyst, 2003, 128, 480–485 RSC.
- K. Matsumoto, A. Torimaru, S. Ishitobi, T. Sakai, H. Ishikawa, K. Toko, N. Miura and T. Imato, Talanta, 2005, 68, 305–311 CrossRef CAS.
- D. R. Shankaran, T. Kawaguchi, S. J. Kim, K. Matsumoto, K. Toko and N. Miura, Anal. Bioanal. Chem., 2006, 386, 1313–1320 CrossRef CAS.
- S. Y. Rabbany, W. J. Lane, W. A. Marganski, A. W. Kusterbeck and F. S. Ligler, J. Immunol. Methods, 2000, 246, 69–77 CrossRef CAS.
- Y. Mizuta, T. Onodera, P. Singh, K. Matsumoto, N. Miura and K. Toko, Biosens. Bioelectron., 2008, 24, 191–197 CrossRef CAS.
- T. Kawaguchi, D. R. Shankaran, S. J. Kim, K. V. Gobi, K. Matsumoto, K. Toko and N. Miura, Talanta, 2007, 72, 554–560 CrossRef CAS.
- H. Aizawa, M. Tozuka, S. Kurosawa, K. Kobayashi, S. M. Reddyc and M. Higuchi, Anal. Chim. Acta, 2007, 591, 191–194 CrossRef CAS.
- E. Bromage, G. Vadas, E. Harvey, M. Unger and S. Kaattari, Environ. Sci. Technol., 2007, 41, 7067–7072 CrossRef CAS.
- E. R. Goldman, G. P. Anderson, N. Lebedev, B. M. Lingerfelt, P. T. Winter, C. H. Patterson and J. M. Mauro, Anal. Bioanal. Chem., 2003, 375, 471–475 CAS.
- G. P. Anderson, S. C. Moreira, P. T. Charles, I. L. Medintz, E. R. Goldman, M. Zeinali and C. R. Taitt, Anal. Chem., 2006, 78, 2279–2285 CrossRef CAS.
- R. G. Smith, N. D'Souza and S. Nicklin, Analyst, 2008, 133, 571–584 RSC.
- L. Sibanda, S. De Saeger and C. Van Peteghem, Int. J. Food Microbiol., 1999, 48, 203–209 CrossRef CAS.
- C. Paepens, S. De Saeger, L. Sibanda, I. Barna-Vetro, I. Leglise, F. Van Hove and C. Van Peteghem, Anal. Chim. Acta, 2004, 523, 229–235 CrossRef CAS.
- M. Lonnberg and J. Carlsson, Anal. Biochem., 2001, 293, 224–231 CrossRef.
- R. Salter, D. Douglas, M. Tess, B. Markovsky and S. J. Saul, JAOAC Int., 2006, 89, 1327–1334 CAS.
- M. Lobeau, S. De Saeger, L. Sibanda, I. Barna-Vetró and C. Van Peteghem, Anal. Chim. Acta, 2005, 538, 57–61 CrossRef CAS.
- I. Y. Goryacheva, S. De Saeger, M. Lobeau, S. A. Eremin, I. Barna-Vetró and C. Van Peteghem, Anal. Chim. Acta, 2006, 577, 38–45 CrossRef CAS.
- I. Y. Goryacheva, E. Y. Basova, C. Van Peteghem, S. A. Eremin, L. Pussemier, J.-C. Motte and S. De Saeger, Anal. Bioanal. Chem., 2008, 390, 723–727 CrossRef CAS.
- I. Y. Goryacheva, N. V. Beloglazova, S. A. Eremin, D. A. Mikhirev, R. Niessner and D. Knopp, Talanta, 2008, 75, 517–522 CrossRef CAS.
- A. J. Schuetz, M. Winklmair, M. G. Weller and R. Niessner, Fresenius J. Anal. Chem., 1999, 363, 625–631 CrossRef CAS.
- B. De Meulenaer, K. Baert, H. Lanckriet, V. Van Hoed and A. Huyghebaert, J. Agric. Food Chem., 2002, 50, 5273–5282 CrossRef CAS.
- E. M. Akita and S. Nakai, J. Food Sci., 1992, 57, 629–634 CrossRef CAS.
| This journal is © The Royal Society of Chemistry 2009 |