Thermo-responsive columns for HPLC: The effect of chromatographic support and polymer molecular weight on the performance of the columns
Farnoosh
Roohi
,
Yasemin
Fatoglu
and
Maria-Magdalena
Titirici
*
Max-Planck Institute for Colloids and Interfaces, Research Campus Golm, Am Mühlenberg 1, D-14476, Golm, Germany. E-mail: Magdalena.Titirici@mpikg.mpg.de; Fax: +49 (0)331-567-9502; Tel: +49 (0)331-567-9508
First published on 7th September 2009
Abstract
Recently a novel technique has been developed in chromatography, namely thermo-responsive chromatography. This employs the use of thermo-responsive polymers grafted onto pre-formed stationary phases for the separation of hydrophobic analytes. The resultant thermo-responsive silica exhibits temperature-controlled hydrophilic–hydrophobic properties. In this study, the themo-responsive polymers were grafted in situ into the pre-packed aminated silica columns. It was found that the molecular weight of the grafted thermo-responsive polymers should be optimized in order to obtain an efficient thermo-responsive column. Furthermore, within this study it was observed that the type of stationary phase (monolithic or packed beads) and the presence of mesoporosity in the system are important parameters influencing the final performance of the thermo-responsive column.
Introduction
Thermo-responsive polymers have attracted much attention in liquid chromatography, due to their advantage of being able to separate mixtures of biomolecules (large peptides, proteins) in a pure aqueous environment under isocratic conditions.1 Thus, the harsh conditions normally associated with protein separation by employing RP-18 columns in the presence of acetonitrile can then be avoided.One of the most commonly used thermo-responsive polymers is poly-N-isopropylacrylamide (PNIPAAm), which has a sharp phase transition at 32 °C.2 Below this temperature which is called the lower critical solution temperature (LCST), the polymer chains show an expanded conformation in water due to strong hydration. Above the LCST the PNIPAAm changes to compact forms by dehydration and intermolecular hydrogen bonding between the carbonyl and NH groups. Due to this temperature dependent behaviour PNIPAAm grafted surfaces exhibit temperature-responsive hydrophilic–hydrophobic surface property alterations. By using these features, PNIPAAm and related polymers have been used to generate temperature-sensitive stationary phases for size exclusion,3 hydrophobic,4 ionic5 and affinity chromatography6 and have been used for the separation of steroids,6,7amino acids4 or nucleotides.8
So far in the literature, PNIPAAm has been grafted, with a few exceptions,9,10 mainly onto silica beads.11,12 Although thermo-responsive stationary phases are known in the literature since the early 90s, according to our knowledge there is no study yet on the influence of the stationary support, and polymer molecular weight distribution on the efficiency of separation. However such a study might be useful in order to understand the optimal parameters one should consider in designing a thermo-responsive stationary phase. Here, we report on in situ grafting of thermo-responsive polymer chains inside the pre-packed silica columns and we compare the performance of the resultant thermo-responsive columns according to the molecular weight of the grafted polymer and support morphology.
Experimental
Chemicals
Rehydroxylated silica monolithic columns (100 × 4.6 mm), Si-100 and Si-1000 were kindly provided by Merck. (3-Aminopropyl)triethoxysilane (APS) was obtained from Aldrich. N-isopropylacrylamide and 2,2′-azobisisobutyronitrile (AIBN) were purchased from Acros and were re-crystallized from n-hexane and methanol respectively. The RAFT agent [(S-1-dodecyl-S′-(α,α′-dimethyl-α″-acetic acid)trithiocarbonate, DDAT)] was synthesized according to the literature.13N-hydroxysuccinimide was purchased from Fluka, N,N-dicyclohexylcarbodimide (DCC) and ethylacetate were obtained from Fluka. Diethylether was purchased from Riedel de Haën. The steroids hydrocortisone, hydrocortisone acetate, dexamethasone, prednisolone, and testosterone were purchased from Sigma-Aldrich. De-ionized water was taken from a Seral purification system (PURELAB Plus) with a conductivity of 0.06 µS cm−1.Characterization methods
Scanning electron microscopy (SEM) measurements were performed using the high resolution scanning electron microscope, Gemini 1550 (120 kV, Carl Zeiss, Oberkochen). The samples were dried on a carbon sample holder for SEM.Transmission electron microscopy (TEM) of the samples was measured using a Zeiss Omega 912 (100 kV, Carl Zeiss, Oberkochen). The diluted samples were applied as drops on 400 mesh copper grids that were vaporized with carbon film. The solvent was evaporated under normal pressure. Size exclusion chromatography (SEC) setups were used equipped with UV (TSP UV1000) and refractive index (Shodex RI-71) detectors. The column set employed was 30 × 0.8 cm, 5 µm MZ-SDplus: 103, 105, and 106 Å. Analyses were performed at 70 °C with N-methylpyrrolidone (NMP) as the eluent at a flow rate of 0.8 ml min−1.
The FT-IR spectra were recorded on an FTS 6000 spectrometer (Bio-Rad). (C,H,N,S) elemental analyses were performed on a Vario EL Elementar (Elementar Analysen-System, Hanau, Germany). The nitrogen adsorption was measured using a QUADROSORB SI, equipped with automated surface area and pore size analyzer. Before analyzing the samples were degassed at 80 °C for 20 h using a Masterprep degasser (Model: QUADRASORB). Nuclear magnetic resonance spectra (NMR) were recorded on a Bruker DPX 400 spectrometer at 400.1 MHz in D2O and deuterated chloroform. The HPLC measurements were performed using an Agilent 1200 series equipped with 3D-quaternary pump with degasser and a diode-array detector. The mobile phase was Milli-Q water with the flow rate of 1 ml min−1. The elution behavior was monitored by UV 254 nm.
RAFT polymerization of PNIPAAm in solution
4 g (35 mmol) NIPAAm was dissolved in 5 ml dry DMF. 106 mg (0.3 mmol) of RAFT agent (DDAT) and 2.6 mg (0.024 mmol) AIBN were added to this solution. After 3 freeze–dry cycles the reaction mixture was heated up to 70 °C. The polymerization was stopped after the desired molecular weight was obtained. The solvent was removed, and the polymer was obtained by precipitation into diethyl ether and was dried under vacuum overnight.Activation of carboxylated PNIPAAm
2 g (0.14 mmol) of carboxylated PNIPAAm was activated with 115 mg (1 mmol) of N-hydroxysuccinimide and 206 mg (1 mmol) of DCC in 10 ml ethylacetate and was stirred at 0 °C for 2 h following by stirring at room temperature overnight. The activated polymer solution was filtered, the solvent was removed and the polymer was isolated by precipitation in diethylether. The polymer was dried overnight under vacuum. The FT-IR spectrum of the modified polymer showed an extra peak at 1780 cm −1 related to the stretching of (C![[double bond, length as m-dash]](https://www.rsc.org/images/entities/char_e001.gif) O) groups.
O) groups.
Modification of silica beads and monoliths
70 ml of 17% HCl were poured into a 100 ml three-necked round bottom flask, equipped with a condenser. 4 g of calcined silica was added to the flask, while stirring. The whole suspension was refluxed at 110 °C overnight. Afterwards, the silica was filtered and washed with 150 ml of methanol and dried in a vacuum oven at 80 °C overnight.
1 ml of APS was dissolved in 90 ml dry toluene. After purging with argon for 10 min, 15 ml of the solution was pumped into the already packed rehydroxylated silica monoliths and beads, by employing an HPLC pump, equipped with a degasser. The columns were closed and heated up to 65 °C for 24 h. For characterization, the same reaction was performed on free standing monoliths and spherical silica beads (Si-100 and Si-1000).
In situ coupling of polymer to the aminated silica monoliths and beads
1 g modified polymer was dissolved in 60 ml dry 1,4-dioxane. 15 ml of this solution was injected into the aminated silica columns using an HPLC pump equipped with a degasser. The columns were closed and kept at room temperature for 1 day. After each coupling cycle, the columns were washed and evaluated based on the separation of the mixture of the five steroids. If the separation was poor, such that the hydrophobicity of the column was not enough for a good separation of steroids, the coupling cycles were repeated again until a thick enough polymer layer was bonded on the packed silica columns. This means until there was no more improvement in the efficiency of the column.For characterization the same reaction was performed on free standing monoliths and beads.
HPLC measurements
The thermo-responsive composite materials were evaluated chromatographically using water as the mobile phase at 55 °C. The flow rate was 1 ml min−1 and 10 µl aliquots of 1 mg ml−1 solutions of analytes and a mixture of them was injected. The elution was monitored at 254 nm. The retention factors (k), selectivity (α), plate number (N) and resolution (R) were calculated as reported before,9 employing the following equations respectively;
k = (tR − t0)/t0 and α = k1/k2 where tR = retention time of the analyte and t0 = retention time of the void marker, benzene.14
Determination of the grafting density of polymer on the surface
The grafting density of polymer chains on the surface was calculated using the following equation:15NA = Avogadro's number, Mn = number average molecular weight of grafted PNIPAAm, mp = amount of grafted polymer on the silica beads (g m−2)
%CP = increase in carbon percent from elemental analysis after the polymer grafting, %CP(theory) = calculated weight percent of carbon in the polymer, %Ci = increase in carbon percent from elemental analysis, %Ci(theory) = calculated weight percent of carbon in initiator or monomer, S = specific surface area (m2 g−1).
Results and discussion
Effect of molecular weight of polymer on the performance of the silica monolithic column
The molecular weight of the grafted polymer can have a major influence on the performance of the column. This is due to the dependence of the polymer’s thermo-responsivity on its molecular weight, which directly translates into the hydrophobicity of the surface. On the other hand, the final mesopore size of the composite depends on the chain length and molecular weight of the grafted polymer. Thus, in order to study the effect of molecular weight of the grafted polymer on the performance of the final thermo-responsive composite, three batches of polymers with different molecular weights were synthesized. The polymers were synthesized according to the RAFT polymerization technique, in the presence of a carboxylated RAFT agent, AIBN as an initiator and in DMF as solvent. The mechanism is shown in Scheme 1. The number-average molecular weight of the polymers was determined by size exclusion chromatography to be 4200, 8500 and 13![[thin space (1/6-em)]](https://www.rsc.org/images/entities/char_2009.gif) 800 g mol−1, employing NMP as solvent and phospholipid PS as standard. In the next step and after the activation of carboxylated polymer chains with N-hydroxysuccinimide, the polymer chains were dissolved in 1,4-dioxane and were flushed into the pre-packed aminated monolithic silica columns. In order to characterize the materials, the coupling was also performed under the exact same conditions on free standing silica monoliths previously modified with amino groups. Table 1 shows the characterization data of the resultant thermo-responsive composites obtained from elemental analysis, nitrogen sorption and equations described in the Experimental. At lower molecular weights, the pore size remains similar to the original size, however the pore size decreased dramatically in the case of Si-PNIPAAm-3 (Mn: 13
800 g mol−1, employing NMP as solvent and phospholipid PS as standard. In the next step and after the activation of carboxylated polymer chains with N-hydroxysuccinimide, the polymer chains were dissolved in 1,4-dioxane and were flushed into the pre-packed aminated monolithic silica columns. In order to characterize the materials, the coupling was also performed under the exact same conditions on free standing silica monoliths previously modified with amino groups. Table 1 shows the characterization data of the resultant thermo-responsive composites obtained from elemental analysis, nitrogen sorption and equations described in the Experimental. At lower molecular weights, the pore size remains similar to the original size, however the pore size decreased dramatically in the case of Si-PNIPAAm-3 (Mn: 13![[thin space (1/6-em)]](https://www.rsc.org/images/entities/char_2009.gif) 800 g mol−1) from 16 to 6 nm. Si- PNIPAAm-2 (Mn: 8500 g mol−1) has the highest specific surface area (160 m2 g−1) and the largest average pore size diameter (15 nm). This can also be observed from the pore size distributions in Fig. 1. As explained in the Experimental, the grafting procedure of the polymer was repeated until the perfomance of the column was acceptable or a thick polymer layer was grafted on the surface. This is indeed the reason for the higher grafting density of Si-PNIPAAm-1 compared to the two other systems (see Table 1). The higher grafting density of this polymer is responsible for the lower specific surface area and smaller pore size, compared to Si-PNIPAAm-2. The mesopores of three silica composites are shown in the microtomed TEM micrographs in Fig. 2. Although the pores are completely filled in the case of Si-PNIPPAm-3 (Fig. 2d), no complete pore filling can be observed for the two other composites (cf.Fig. 2b, c), which is in agreement with the results of nitrogen sorption experiments (cf.Table 1 and Fig. 1).
800 g mol−1) from 16 to 6 nm. Si- PNIPAAm-2 (Mn: 8500 g mol−1) has the highest specific surface area (160 m2 g−1) and the largest average pore size diameter (15 nm). This can also be observed from the pore size distributions in Fig. 1. As explained in the Experimental, the grafting procedure of the polymer was repeated until the perfomance of the column was acceptable or a thick polymer layer was grafted on the surface. This is indeed the reason for the higher grafting density of Si-PNIPAAm-1 compared to the two other systems (see Table 1). The higher grafting density of this polymer is responsible for the lower specific surface area and smaller pore size, compared to Si-PNIPAAm-2. The mesopores of three silica composites are shown in the microtomed TEM micrographs in Fig. 2. Although the pores are completely filled in the case of Si-PNIPPAm-3 (Fig. 2d), no complete pore filling can be observed for the two other composites (cf.Fig. 2b, c), which is in agreement with the results of nitrogen sorption experiments (cf.Table 1 and Fig. 1).
 | ||
| Scheme 1 Mechanism of RAFT polymerization of PNIPAAm. | ||
| Native silica | 1a | 2b | 3c | |
|---|---|---|---|---|
a 1: Si-PNIPAAm-1; Mn: 4200 g mol−1, Mw: 4500 g mol−1, PDI: 1.08.
b 2: Si-PNIPAAm-2; Mn: 8500 g mol−1, Mw: 9300 g mol−1, PDI: 1.09.
c 3: Si-PNIPAAm-3; Mn: 13![[thin space (1/6-em)]](https://www.rsc.org/images/entities/char_2009.gif) 800 g mol−1, Mw: 14 800 g mol−1, Mw: 14![[thin space (1/6-em)]](https://www.rsc.org/images/entities/char_2009.gif) 700 g mol−1, PDI: 1.07. 700 g mol−1, PDI: 1.07.
|
||||
| %Cof Si–OH | 0.69 | 0.69 | 0.69 | 0.69 |
| %Cof Si–NH2 | — | 6.00 | 5.02 | 9.36 |
| %Cof the last coupling cycle | — | 15.07 | 13.32 | 15.7 |
| Grafting density of polymer/µg m−2 | — | 470 | 413 | 340 |
| Specific surface area/m2 g−1 | 317 | 130 | 160 | 116 |
| Av. pore size diameter/nm | 16 | 12.7 | 15 | 6 |
| Av. pore volume/ml g−1 | 1.3 | 0.39 | 0.46 | 0.36 |
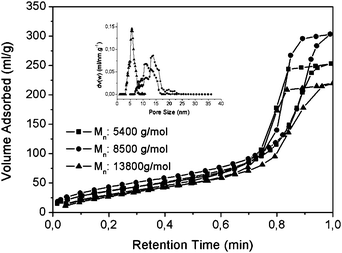 | ||
| Fig. 1 Nitrogen sorption isotherm of three silica composites with different molecular weights. | ||
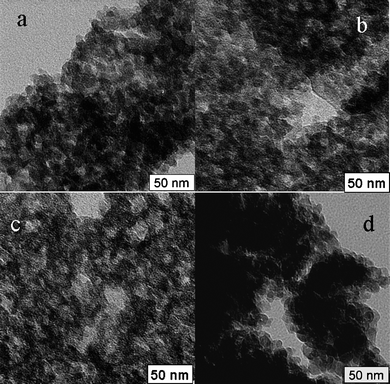 | ||
| Fig. 2 Microtomed TEM micrographs of silica composites: (a) native silica, (b) Si-PNIPAAm-1, (c) Si-PNIPAAm-2, (d) Si-PNIPAAm-3. | ||
Chromatographic characterization
The performance of the three monolithic silica composites was evaluated using an aqueous mixture of five steroids in pure aqueous mobile phase at 55 °C under isocratic conditions. The back pressure for all columns was about 35 bar. These elution profiles are shown in Fig. 3. While all steroids could be well separated in the case of Si-PNIPAAm-2 and Si-PNIPAAm-3, hydrocortisone and prednisolone could not be well separated on the Si-PNIPAAm-1 column. This is probably due to the lower molecular weight of PNIPAAm-1 (4200 g mol−1). It is known that the thermo-responsivity of the PNIPAAm depends on the molecular weight16.17 and the lower the molecular weight, the less the hydrophobicity is. In this case and although Si-PNIPAAm-1 has the highest grafting density (cf.Table 1), its surface hydrophobicity is not high enough to distinguish between these two analytes, as they have very similar log P values, and more or less the same hydrophobicity (cf.Table 218). In addition, the tailing which is pronounced in the case of Si-PNIPAAm-3 is diminished in both cases of Si-PNIPAAm-1 and Si-PNIPAAm-2. This is becuause the chains are in the collapsed state (above LCST) and the analytes can also diffuse into the collapsed chains. This in fact takes place in the case of all three silica composites. But in the case of Si-PNIPAAm-3, the collapsed chains are so bulky that makes it difficult for the analytes to diffuse and leads to the tailing in the elution peaks. The selectivities, retention factors, plate numbers and resolution of eluted peaks in three columns at 55 °C are given in Table 2 (for the equation see the Characterization methods section, HPLC measurements). The plate numbers, which are an indication of the efficiency of the column, in the case of Si- PNIPAAm-2 is 3 to 5 times higher than that of the other two columns. showing that the efficiency of the thermo-responsive column can be improved by lowering the molecular weight to 8000 g mol−1. This is in fact due to the higher amounts of available mesopores by lowering the molecular weight of grafted polymers. However, in the case of Si-PNIPAAm-1, which has the lowest molecular weight, the efficiency decreases. This is due to the lower hydrophobicity of PNIPAAm at lower molecular weights. The retention factors of steroids (except for testosterone) increases with increasing the molecular weight which translates to the increasing hydrophobicity of the grafted polymers (cf.Table 2 and Fig. 4). This is an indication that the hydrophobicity of the column increases by increasing the molecular weight, showing again that the main factor for retention of the steroids in the column is based on the hydrophobic–hydrophobic interaction. In addition we can observe that the resolutions (cf.Table 2) of eluted peaks in the case of Si-PNIPAAm-2 are much higher than the other two columns, which supports the above mentioned explanation.| log P | Selectivity α | Retention factor k | Plate number N (1/m) | Resolution Rd | |||||||||
|---|---|---|---|---|---|---|---|---|---|---|---|---|---|
| 1a | 2b | 3c | 1a | 2b | 3c | 1a | 2b | 3c | 1a | 2b | 3c | ||
a Si-PNIPAAm-1; Mn: 4200 g mol−1.
b Si-PNIPAAm-2; Mn: 8500 g mol−1.
c Si-PNIPAAm-3; Mn: 13![[thin space (1/6-em)]](https://www.rsc.org/images/entities/char_2009.gif) 800 g mol−1.
d The resolution is calculated for two adjacent peaks; i.e. the resolution between prednisolone and hydrocortisone is calculated and written in the second row belonging to prednisolone and so on. 800 g mol−1.
d The resolution is calculated for two adjacent peaks; i.e. the resolution between prednisolone and hydrocortisone is calculated and written in the second row belonging to prednisolone and so on.
|
|||||||||||||
| Hydrocortisone | 1.61 | — | — | — | 0.7 | 0.8 | 1 | 14![[thin space (1/6-em)]](https://www.rsc.org/images/entities/char_2009.gif) 360 360 |
38![[thin space (1/6-em)]](https://www.rsc.org/images/entities/char_2009.gif) 500 500 |
10![[thin space (1/6-em)]](https://www.rsc.org/images/entities/char_2009.gif) 000 000 |
— | — | — |
| Prednisolone | 1.62 | 1.28 | 1.25 | 1.3 | 0.9 | 1.0 | 1.3 | 11![[thin space (1/6-em)]](https://www.rsc.org/images/entities/char_2009.gif) 400 400 |
40![[thin space (1/6-em)]](https://www.rsc.org/images/entities/char_2009.gif) 400 400 |
10![[thin space (1/6-em)]](https://www.rsc.org/images/entities/char_2009.gif) 500 500 |
2.81 | 5 | 3.3 |
| Dexamethasone | 1.83 | 1.3 | 1.4 | 1.4 | 1.2 | 1.4 | 1.8 | 13![[thin space (1/6-em)]](https://www.rsc.org/images/entities/char_2009.gif) 000 000 |
47![[thin space (1/6-em)]](https://www.rsc.org/images/entities/char_2009.gif) 800 800 |
10![[thin space (1/6-em)]](https://www.rsc.org/images/entities/char_2009.gif) 100 100 |
3.89 | 9.1 | 4.44 |
| Hydrocortisone- acetate | 2.30 | 1.25 | 1.35 | 1.44 | 1.5 | 1.9 | 2.6 | 10![[thin space (1/6-em)]](https://www.rsc.org/images/entities/char_2009.gif) 200 200 |
58![[thin space (1/6-em)]](https://www.rsc.org/images/entities/char_2009.gif) 200 200 |
10![[thin space (1/6-em)]](https://www.rsc.org/images/entities/char_2009.gif) 000 000 |
3.03 | 10.4 | 5.5 |
| Testosterone | 3.32 | 2.6 | 2.6 | 1.8 | 3.9 | 5.0 | 4.7 | 8300 | 60![[thin space (1/6-em)]](https://www.rsc.org/images/entities/char_2009.gif) 350 350 |
9600 | 11.16 | 31.23 | 8.9 |
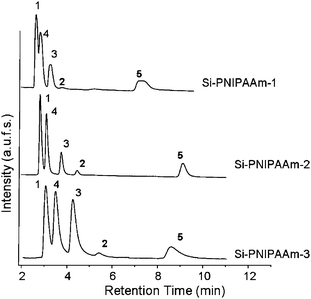 | ||
| Fig. 3 Elution profile of an aqueous mixture of five steroids at 55 °C on the monolithic columns packed with thermo-responsive polymer chains with different molecular weights. (1) Hydrocortisone. (2) Hydrocortisone acetate. (3) Dexamethasone. (4) Prednisolone. (5) Testestorone. flow rate: 1 ml min−1. mobile phase: water. | ||
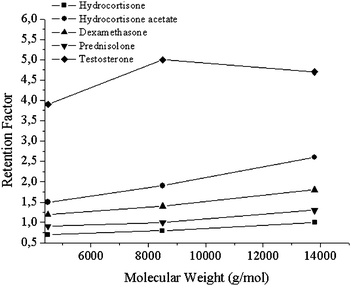 | ||
| Fig. 4 Effect of molecular weight on retention factor of analytes. | ||
Effect of type of stationary phase on the performance of the packed silica column
In order to study the effect of type of stationary phase on the performance of the final thermo-responsive column, three different types of packed silica columns with different pore size and morphologies were chosen. 10 nm mesoporous Si-100, monolithic silica with a hierarchical distribution of meso and macro pores and Si-1000 with available 100 nm macropores were the chosen stationary phases. Table 3 shows the properties of these stationary phases. At first, the silica beads were rehydroxylated, aminated and then were slurry packed into the stainless steel chromatographic columns (100 × 4.6 mm). In the next step, the activated PNIPAAm which showed the highest performance in the previous section (number average molecular weight of 8500 g mol−1) was grafted in situ directly into all three packed columns. The back pressure in the case of Si-100 was in the range of 50 bar and that of Si-1000, was in the range of 130 bar. Table 4 shows the characteristic results as well as the grafting density of the polymer chains on the resultant thermo-responsive columns obtained from elemental analysis and nitrogen sorption experiments. In the case of Si-100, the polymer grafting density was slightly higher than that of monolithic column. As a result of higher grafting density of polymer, the final average mesopore size of Si-PNIPAAm-100 was smaller than that of Si-PNIPAAm-m. This can clearly be observed in pore size distribution graphs obtained from nitrogen sorption experiments in Fig. 5.| Si-m | Si-100 | Si-1000 | |
|---|---|---|---|
| Particle size/µm | 5 | 10 | |
| Specific surface area/m2 g−1 | 317 | 300 | 30 |
| Av. pore size diameter/nm | 16 | 15 | 6.3 |
| Av. pore volume/ml g−1 | 1.3 | 1.0 | 0.08 |
| Si-PNIPAAm -m | Si-PNIPAAm-100 | Si-PNIPAAm-1000 | |
|---|---|---|---|
| %Cof Si–OH | 0.69 | 0.65 | 0.1 |
| %Cof Si–NH2 | 5.02 | 9.1 | 2.7 |
| %Cof the last coupling cycle | 13.32 | 18.15 | 6.45 |
| Grafting density of polymer/(µg m−2)/(chains nm−2) × 10−3 | 413/29.1 | 512/36.3 | 166/11.75 |
| Specific surface area/m2 g−1 | 160 | 157 | 27.4 |
| Av. pore size diameter/nm | 15 | 11.1 | 3.3 |
| Av. pore volume/ml g−1 | 0.46 | 0.41 | 0.17 |
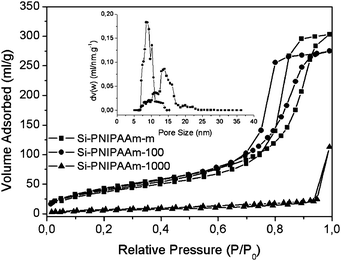 | ||
| Fig. 5 Nitrogen sorption isotherm of thermo-responsive columns with different stationary phases. | ||
The grafting density of polymer was much lower in the case of Si-1000. One characteristic of Si-1000 is that these beads contain macropores (about 100 nm), which leads to the lower specific surface area (cf.Table 3). This lower specific surface area explains the low grafting density of the polymer chains on the surface of such silica beads. The TGA results in Fig. 6 again shows that the Si-PNIPAAm-1000 has the lowest grafting density. The higher grafting density of polymers on the surface of Si-100 can also be supported from the TGA results. The SEM micrographs of silica beads as well as silica monolith before and after the grafting step are shown in Fig. 7. No differences can be observed on the surface morphology of Si-100 and the monolithic one before and after grafting the polymer chains which shows that the grafting of polymer chains on the silica surface has been done in an homogeneous manner. However, in the case of Si-1000, several small agglomerates can be observed around the silica beads. This can indeed be the non-grafted polymer chains, due to the small specific surface area of the beads which are also responsible for the high back pressure of the Si-PNIPAAm-1000 column. The low specific surface area in the case of the Si-PNIPAAm-1000 composite can be seen in the nitrogen sorption results in Fig. 5.
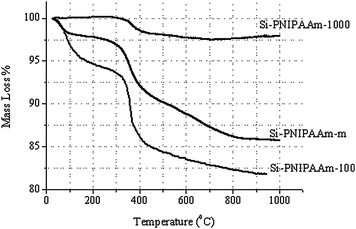 | ||
| Fig. 6 TGA graphs of thermo-responsive silica monolith, Si-100 and Si-1000. | ||
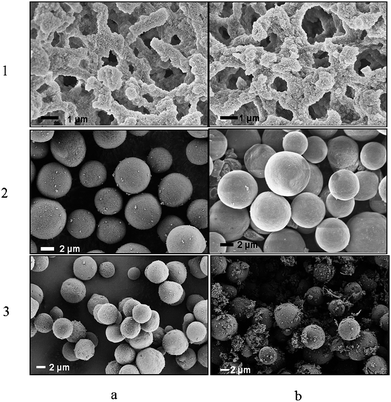 | ||
| Fig. 7 SEM micrographs of (1) monolithic silica, (2) Si-100, (3) Si-1000 (a) before grafting and (b) after grafting of PNIPAAm chains. | ||
Chromatographic characterization
After the grafting of thermo-responsive PNIPAAm to the silica beads and monolith, the resultant thermo-responsive columns were washed with different solvents and their performances were evaluated using water as an aqueous mobile phase under isocratic conditions and the same aqueous mixture of five steroids as hydrophobic analytes. The elution profiles of the three stationary phases are shown in Fig. 8. Although all three different columns had the same composition, the performance of Si-PNIPAAm-m was much better than the other two columns in terms of separation of steroids. While all steroids could be well separated in Si-PNIPAAm-m; hydrocortisone, prednisolone and hydrocortisone acetate could not be well separated in Si-PNIPAAm-100. This can not be due to the lower hydrophobicity of the Si-PNIPAAm-100 column, since the grafting density of the polymer on its surface is higher (cf.Table 3). One possible explanation can be due to the difference in the packing density of two columns. The packing density of the monolithic silica column was calculated to be about 0.3 g ml−1 and that of silica particle packed column was 0.58 g ml−1. Thus, the free volume available for the interaction between analytes and polymer chains in the case of Si-PNIPAAm-100 is much less compared to the monolithic column. Subsequently there would be less interaction between the polymer chains and analytes.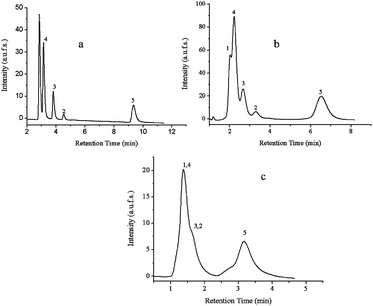 | ||
| Fig. 8 Elution profile of an aqueous mixture of five steroids at 55 °C on the HPLC columns packed with different thermo-responsive stationary phases. (A) Si-PNIPAAM-m. (b) Si-PNIPAAm-100. (c) Si-PNIPAAm-1000. (1) Hydrocortisone. (2) Hydrocortisone acetate. (3) Dexamethasone. (4) Prednisolone. (5) Testestorone. Flow rate: 1 ml min−1, mobile phase: water. | ||
No separation can be observed in the case of Si-PNIPAAm-1000 at 55 °C. This can be mainly due to the low grafting density of polymer chains on the silica surface, which is due to the low specific surface area. The lack of mesopores is responsible for the low specific surface area and thus the low hydrophobicity of the column which is not enough to achieve good separation of the analytes.
Table 5 shows the selectivities, retention factors, plate numbers and resolution for these three different stationary phases. As expected from the elution chromatograms the plate numbers in both cases of columns with silica beads are much lower than the thermo-responsive monolithic one. This indeed shows that the efficiency of the resultant monolithic column is much higher than the other two columns packed with silica beads. Moreover, the retention factors are also lower than in the case of the monolithic column. This is indeed due to the lower free volume available for the interaction between the analytes and polymer chains, which leads to less interaction between the analytes and polymer chains and as a result lower retention factors. The higher values for the resolution of eluted peaks in the case of monolithic silica column (cf.Table 5) is again an indication for the higher performance of this column.
| log P | Selectivity α | Retention factor k | Plate number N (1/m) | Resolution Rd | |||||||||
|---|---|---|---|---|---|---|---|---|---|---|---|---|---|
| 1a | 2b | 3c | 1a | 2b | 3c | 1a | 2b | 3c | 1a | 2b | 3c | ||
| a Si-PNIPAAm-m. b Si-PNIPAAm-100. c Si-PNIPAAm-1000. d The resolution is calculated for two adjacent peaks; i.e. the resolution between prednisolone and hydrocortisone is calculated and written in the second row belonging to prednisolone and so on. | |||||||||||||
| Hydrocortisone | 1.61 | — | — | — | 0.8 | 0.4 | 0.2 | 38500 | 730 | 760 | |||
| Prednisolone | 1.62 | 1.25 | 1.5 | 1 | 1.0 | 0.6 | 0.2 | 40400 | 4100 | 760 | 5.0 | 2.0 | 0 |
| Dexamethasone | 1.83 | 1.4 | 1.66 | 1.5 | 1.4 | 1.0 | 0.3 | 47800 | 4800 | — | 9.1 | 3.5 | — |
| Hydrocortisone- acetate | 2.30 | 1.35 | 1.5 | 1 | 1.9 | 1.5 | 0.3 | 58200 | 6800 | — | 10.4 | 4.1 | — |
| Testosterone | 3.32 | 2.6 | 2.7 | 5.3 | 4.9 | 4.1 | 1.6 | 60350 | 6800 | 4200 | 31.23 | 10.5 | 8.10 |
Conclusions
Thermo-responsive silica composites have been synthesized by grafting PNIPAAm in situ directly into the pre-packed aminated silica particles or monolithic silica columns. A slight pore filling was observed when PNIPAAm with high molecular weight (number average molecular weight of 13![[thin space (1/6-em)]](https://www.rsc.org/images/entities/char_2009.gif) 800 g mol−1) was grafted to the surface. Decreasing the molecular weight to 8500 g mol−1 improved the performance of the column. However, further decreasing of the molecular weight to 4500 g mol−1 decreased the performance of the column. This was due to the lower hydrophobicity of PNIPAAm chains at low molecular weights.
800 g mol−1) was grafted to the surface. Decreasing the molecular weight to 8500 g mol−1 improved the performance of the column. However, further decreasing of the molecular weight to 4500 g mol−1 decreased the performance of the column. This was due to the lower hydrophobicity of PNIPAAm chains at low molecular weights.
Studying the effect of type of stationary phases on the performance of the thermo-responsive column revealed that in situ grafting the polymer chains into the pre-packed monolithic columns leads to a suitable thermo-responsive column for separation of hydrophobic analytes. However, in situ grafting of polymer chains into the pre-packed silica beads column led to the thermo-responsive columns with lower performance in terms of separation of hydrophobic analytes, which was due to the higher packing density of silica beads. This resulted less free volume available for the interaction between analytes and the polymer chains. In addition, it was found out that the presence of only macropores is not enough for an efficient separation but a hierarchical distribution of meso and macro pores is the ideal combination.
References
- H. Kanazawa, Anal. Bioanal. Chem., 2004, 378, 46 CrossRef CAS.
- M. Heskins and J.-E. Guillet, J. Macromol. Sci., Part A: Pure Appl. Chem., 1968, 2, 1441 Search PubMed.
- K. Hosoya, E. Sawada, K. Kimata, T. Araki, N. Tanaka and J. M. J. Frechet, Macromolecules, 1994, 27, 3973 CrossRef CAS.
- H. Kanazawa, T. Sunamoto, y. Matsushima, A. Kikuchi and T. Okano, Anal. Chem., 2000, 72, 5961 CrossRef CAS.
- H. Kanazawa, Y. Kashiwase, K. Yamamoto, Y. Matsuchima, A. Kikuchi, Y. Sakurai and T. Okano, Anal. Chem., 1997, 69, 823 CrossRef CAS.
- H. Kanazawa, K. Yamamoto, Y. Matsuchima, N. Takai, A. Kikuchi, Y. Sakurai and T. Okano, Anal. Chem., 1996, 68, 100 CrossRef CAS.
- T. Yakushiji, K. Sakai, A. Kikuchi, T. Aoyagi, Y. Sakurai and T. Okano, Anal. Chem., 1999, 71, 1125 CrossRef CAS.
- E. Ayano, C. Sakamoto, H. Kanazawa, A. Kikuchi and T. Okano, Anal. Sci., 2006, 22, 539 CrossRef CAS.
- F. Roohi, M. Antoniettie and M. M. Titirici, J. Chromatogr., A, 2008, 1203, 160 CrossRef CAS.
- F. Svec and J. M. J. Frechet, Ind. Eng. Chem. Res., 1999, 38, 34 CrossRef CAS.
- F. Roohi and M. M. Titirici, New J. Chem., 2008, 32, 1409 RSC.
- C. Sakamato, Y. Okada, H. Kanazawa, E. Ayano, T. Nishimura, M. Ando, A. Kikuchi and T. Okano, J. Chromatogr., A, 2004, 1030, 247 CrossRef CAS.
- J. T. Lai, D. Filla and R. Shea, Macromolecules, 2002, 35, 6754 CrossRef CAS.
- E. Ayano, K. Nambu, C. Sakamoto, H. Kanazawa, A. Kikuchi and T. Okano, J. Chromatogr., A, 2006, 1119, 58 CrossRef CAS.
- K. Nagase, J. Kobayashi, A. Kikuchi, Y. Akiyama, H. Kanazawa and T. Okano, Langmuir, 2007, 23, 9409 CrossRef CAS.
- K. N. Plunkett, X. Zhu, J. S. Moore and D. E. Leckband, Langmuir, 2006, 22, 4259 CrossRef CAS.
- X. Zhu, C. Yan, F. M. Winnik and D. Leckband, Langmuir, 2007, 23, 162 CrossRef CAS.
- H. Kanazawa, E. Ayano, C. Sakamoto, R. Yoda, A. Kikuchi and T. Okano, J. Chromatogr., A, 2006, 1106, 152 CrossRef CAS.
| This journal is © The Royal Society of Chemistry 2009 |


