Comparative analysis of essential components between the herbal pair Radix Saposhnikoviae–Rhizoma seu Radix Notopterygii and its single herbs by GC-MS combined with a chemometric resolution method
Lian-Fang
Yu
,
Xiao-Ru
Li
*,
Shao-Yin
Liu
,
Guang-Wei
Xu
and
Yi-Zeng
Liang
Research Center of Modernization of Chinese Herbal Medicine, College of Chemistry and Chemical Engineering, Central South University, Changsha, 410083, P. R. China. E-mail: xrli@mail.csu.edu.cn
First published on 15th September 2009
Abstract
Comparative analysis of essential components in the herbal pair Radix Saposhnikoviae–Rhizoma seu Radix Notopterygii and its single herbs is performed using two-dimensional gas chromatography-mass spectrometry data coupled with a chemometric method, named alternative moving window factor analysis. Identification of the compounds is also assisted by comparison of temperature-programmed retention indices (PTRIs) on the OV-1 column with authentic samples. The experimental results show that the main volatile chemical components in the herbal pair are mainly from Rhizoma seu Radix Notopterygii, and the number of essential chemical components in the herbal pair is almost equal to the sum of the number in the two single herbs but with a different quantity.
1. Introduction
There is a growing interest in traditional Chinese medicine (TCM) in recent years because of the advantages of pharmacological activity, low toxicity and rarity of complications. The compatibility theory is the core problem of TCM. So it is of great importance to conduct research on the relationship between the chemical components of prescription and those in single herbs and the changes in the process of decoction. Only after chemical reactions and physical changes during the decoction are clarified, can the compatibility mechanism of TCM be elucidated. The herbal pair fangfeng (Radix Saposhnikoviae, RS)–qianghuo (Rhizoma seu Radix Notopterygii, RSRN) is a diaphoretic prescription pungent in flavour and warm in property.1 Fangfeng (RS) has the effects of relieving exterior syndromes by dispelling pathogenic wind, removing dampness to relieve pain, and expelling endogenous wind to relieve spasms.2 Qianghuo (RSRN) relieves exterior syndromes by dispelling pathogenic cold air, removing numbness to relieve pain, and expelling endogenous wind to remove dampness.3 These two herbal medicines are often used together for affection by exopathogenic wind-cold shown as aversion to cold, fever, headache, anhidrosis, limbs and joints pain to expel exogenous pathogenic factors and relieve exterior syndromes. The volatile oil of the herbal pair is the effective ingredient, but its chemical components have not been reported yet. Analysis of the chemical components of the volatile oils can provide a scientific basis for the study of the active constituents, pharmacology, toxicology, and it's of great significance for the further development and utilization of its medicinal value.Generally speaking, the analysis of volatile oil is usually conducted with GC-MS, which contributes greatly to the characterization and identification of volatile chemical components in complex systems. However, the GC-MS data from volatile oil involves a great number of overlapped and even embedded peaks. These overlapped and embedded peaks may bring about many difficulties when carrying out quantitative and qualitative analysis correctly. On account of these overlapped and embedded peaks, the comparative analysis among different samples may be a hard task and is even sometimes impossible. Chemometric methods, a very useful assistant tool, use comprehensive chromatographic and spectral information to make it possible to resolve one complex system clearly and accurately. So far, the methods, such as subwindow factor analysis (SFA),4–6 evolving factor analysis (EFA),7,8 windows factor analysis (WFA),9–11 heuristic evolving latent projections (HELP),12–14 evolving window orthogonal projection (EWOP),15and multi-component spectra correlative chromatography (MSCC)16 have been developed to provide more information for chemical analysis. However, the methods mentioned above can neither resolve the embedded peaks nor simultaneously carry out resolution and comparative analysis between two complex systems. In order to solve this problem, a chemometric method, named alternative moving window factor analysis (AMWFA),17 was applied to analyze the samples in this study. This method could use the cross-information hidden in two systems to determine the number of common components in different samples and then to identify their corresponding spectra of common components automatically.
In this study, the volatile oils of RS, RSRN, and HP RS–RSRN were firstly separated and detected with GC-MS. Then, AMWFA was employed to do the comparative analysis of volatile oils among RS, RSRN and HP RS–RSRN and to resolve the overlapped or embedded peaks. The qualitative identification of these chemical components was carried out by mass spectra combined with PTRIs. The quantitative analysis was performed with the overall volume integration method. By comparison analysis, the differences and the likenesses of volatile components between the herbal pair and its single herbs can be found, and further knowledge about the mechanism of changes of the chemical components in the herbal pair can be obtained.
2. Theory
AMWFA is the extension and combination of multi-component spectral correlative chromatography (MSCC) and subwindow factor analysis (SFA), which is a convenient tool for the comparison analysis of hyphenated chromatographic data. MSCC is proposed based on orthogonal projection and correlative chromatography. In order to eliminate the influence of heteroscedastic noise derived from hyphenated instruments, the cosine value between target component spectrum and its projected residue is applied as a criterion to test the correlative component chromatographic clusters of different chemical fingerprints. The key step in SFA is first to correctly pick up two subwindows containing only one common component and then to conduct common rank analysis, and in this way we can extract its corresponding pure spectrum from the eigenvector, whose eigenvalue is equal or close to 1 by solving the eigenvalue problem of the equation. The only new point of AMWFA compared to SFA just lies in its efficient utilization of the useful information from two fingerprints of some common features.Suppose matrix X and Y are two comparative sections in two complicated fingerprints, respectively. AMWFA calculation procedure mainly consists of the following two steps:
(1) Common rank analysis: First, investigate the relationship of components between X and Y by MSCC and inverse projection multi-component spectral correlative chromatography (IP-MSCC). Second, determine the common components by AMWFA. The two matrices, say X and Y, are decomposed by singular value decomposition (SVD), and after that the two orthogonal bases of loadings, say E = {e1, e2,…,em} of X and F = {f1, f2,…,fn} of Y, can be obtained, where m and n are the number of components in X and Y, respectively. When one of the common components in both X and Y exists, its spectrum, say sk (k = 1, 2,…,c), can be written in the following equation:
 | (1) |
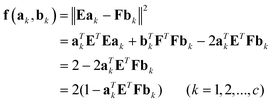 | (2) |
Thus, the minimum of the above objective function can be achieved by solving the following eigenvalue problem, that is:
| aTkETFbk = dk | (3) |
Notice that, ETE = I, FTF = I and sk = Eak = Fbk, then we have:
| ak = ETsk = ETFbk = ETFFTsk = ETFFTEak | (4) |
| bk = FTsk = FTEak = FTEETsk = FTEETFbk | (5) |
According to Eqs. (4) and (5), as long as the analyte, say sk, is really a common component of X and Y, ak and bk must be the eigenvectors of matrices ETFFTE and FTEETF with unit eigenvalues. If there are c common components in X and Y, there will be c eigenvalues, say dk (k = 1, 2,…,c), equal or close to 1. If there is no common component between X and Y, the value of dk will be significantly less than 1. In a word, the number with eigenvalue dk = 1 (k = 1, 2,…, c) is equal to the number of common components c.
(2) Resolving the pure spectra of common components: a. During the scanning procedure, one could easily get the number of common ranks between the two analyzed submatrices by common rank analysis. By collecting all these numbers acquired and then plotting them versus the retention times, the figure of common rank map with the information of common components can be obtained. b. When only one of the common components exists in both matrices compared, its spectrum, say s, can be easily extracted by using linear combination of their loading matrices E and F, that is, s = ∑aiei = ∑bjfj = Ea = Fb. During the scanning procedure through moving window to the target matrix X, one could easily get the spectrum corresponding to the biggest eigenvalue of the two analyzed submatrices by the proposed method. By collecting all these spectra acquired and then calculating the correlation coefficients between the front and spectra following it one by one and then plotting these correlation coefficients versus the retention times, the figure of spectral auto-correlative curve can be obtained. This plot records the change of the identified spectra along the scanned chromatographic regions. In this figure, the region with similarity close to 1 can determine a pure spectrum of target component together with the information from the common rank map.
3. Experimental
3.1. Materials and alkane standard solution
Single herbal medicines RS and RSRN were purchased from the Medical Materials Corporation (Nanyang,Henan, China), and they were both identified by the Institute of Materia Medica, Hunan Academy of Traditional Chinese Medicine and Materia Medica (Changsha, Hunan, China). n-Alkane standard solutions of C8–C20 (mixture no. 04070) and C21–C40 (mixture no. 04071) were purchased from Fluka Chemika (Buchs, Switzerland).3.2. Extraction of volatile oil
Extraction of volatile oil of the herbal pair: 100 g of dried powder of each single herbal medicine, RS and RSRN, were weighed exactly and mixed and then processed according to the standard method described in Chinese Pharmacopoeia (2005 version).18The extraction of volatile oil of the single herbal medicine was carried out by the same method as mentioned above.
3.3. Instruments and experimental conditions
The GC-MS instrument was QP2010 with a fused silica capillary column OV-1 (30 m × 0.25 mm I.D.). In analysis, the column temperature was set at 40 °C initially, which was then increased to 130 °C at a rate of 2 °C/min (maintained for 5 min) and finally to 230 °C at a rate of 10 °C/min (maintained for 15 min). The inlet temperature was kept at 250 °C and interface temperature at 250 °C. The carrier gas was helium with a constant flow-rate of 1.0 ml/min. For the experimental conditions of the mass spectrometer, electron impact (EI+) mass spectra were recorded at 70 eV. The splitting ratio was 10:1. The scan was at 0.2 scan/s from m/z 40 to 600 amu. The ionization source temperature was set at 200 °C.3.4. Retention indices
Van den Dool and Kratz19 proposed a quasi-linear equation for PTRIs as follows:where RI is the temperature-programmed retention index of the interest, tn, tn+1, tx are the retention time in minutes of the two standard n-alkanes containing n and n + 1 carbons and the interest, respectively. This equation was used to calculate retention indices in the research work.
3.5. Data analysis
All data analysis was performed on a compaq v3911(Intel) personal computer, and all programs of chemometric resolution methods were coded in MATLAB 6.5 for windows.The library searches and spectral matching of the resolved pure components were conducted on the National Institute of Standard and Technology(NIST) 107 MS database containing 107886 compounds. The exact qualitative results were obtained with the help of PTRIs.4. Results and discussion
4.1. Resolution of overlapped peaks by AMWFA20–24
Fig.1 shows the total ion chromatograms (TICs) of the volatile oils of herbal medicines RS (a), RSRN (b) and the herbal pair RS–RSRN (c). All the TICs are very complex analytical systems. Although many chromatographic peaks are baseline separated, there still exist some overlapped peaks. Because of these, the simple search with the MS database will definitely fail because the mass spectrum of mixtures measured can never get a good matching index with that of a pure component in the NIST MS database. To illustrate how to extract the pure mass spectra efficiently, the peak clusters marked X and Y are picked out as examples and then processed by AMWFA (Fig. 2).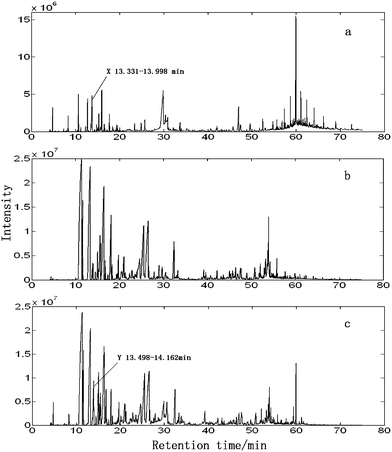 | ||
| Fig. 1 TIC curves of volatile oils of RS (a), RSRN (b) and HP RS–RSRN (c). | ||
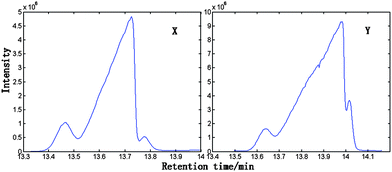 | ||
| Fig. 2 The magnified TIC curve for peak cluster X within 13.331–13.998 min in RS and peak cluster Y within 13.498–14.162 min in the HP RS–RSRN. | ||
First, MSCC (X as base matrix, Y as target matrix) and inverse projection MSCC (IP-MSCC, Y as base matrix, X as target matrix) are used to see whether the two peak clusters contain common components. The results of MSCC and IP-MSCC are shown in Fig. 3, which indicates that the mass spectra features of the compounds in peak cluster X are highly correlated with that in peak cluster Y and then the two peak clusters contain common components. In order to further determine the number of common components in the two peak clusters, we conduct common rank analysis according to AMWFA. The obtainment of the common rank analysis shows that these two peak clusters have three components in common because of the first three values are close to zero (Fig. 4), and the values above the forth component become bigger and increase gradually. The resolution process of pure mass spectra for components followed to conduct after the number of common components in the two systems, i.e. peak cluster X and peak cluster Y, has been obtained.
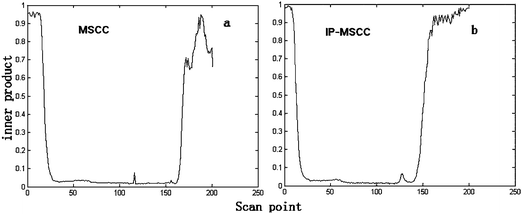 | ||
| Fig. 3 Results of MSCC (a) and IP-MSCC (b) analysis. | ||
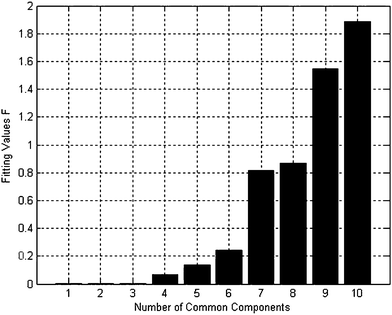 | ||
| Fig. 4 Results of common rank analysis. | ||
We take the whole X as the base matrix, and then the moving window searching was conducted on the whole Y with a fixed window size 3, then we can obtain the common rank map as shown in Fig. 5 (a). During the process of moving window scanning, the mass spectra and the similarity between the two close mass spectra were obtained by calculation with formula. The spectral auto-correlative curve was also acquired by plotting of similarity vs. retention time, as shown in Fig. 5 (b). According to AMWFA, on the region in which the number of common components is equal to one, the corresponding pure mass spectrum could be acquired from the eigenvector. In Fig. 5 (a), we can see clearly that there are three regions (13∼38, 88∼111, 132∼139), in which the number of common components is close to 1, in the common rank map, and three flat regions (indicated by R1, R2 and R3 in Fig. 5 (b)) with similarity being close to 1 appearing in the corresponding spectral auto-correlative curve. If the number of common components is equal to 1, a pure spectrum can be acquired from the corresponding region with correlation coefficient close to 1 in the spectral auto-correlative curve. In Fig. 5 (b), three flat parts indicated by R1, R2 and R3 show the regions, in which the three identified mass spectra were picked out. By a matching search from the NIST107 standard mass spectral database, the resolution result by AMWFA shows that the three common components in peak clusters X and Y are 2-pentyl-furan (R1), octanal (R2), and β-myrcene (R3) respectively, with the match similarity of 0.9947, 0.9483 and 0.9521. The pure chromatograms of peak clusters X and Y are shown in Fig. 6 which indicates that both peak clusters X and Y are overlapping ones of three components. Fig. 7, 8 and 9 show their resolved mass spectra.
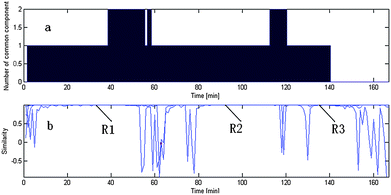 | ||
| Fig. 5 Results of resolution of common components. (a) Common rank map from AMWFA; (b) spectral auto-correlative curves from AMWFA. | ||
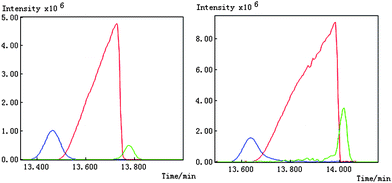 | ||
| Fig. 6 Resolved chromatograms for peak cluster X and Y. | ||
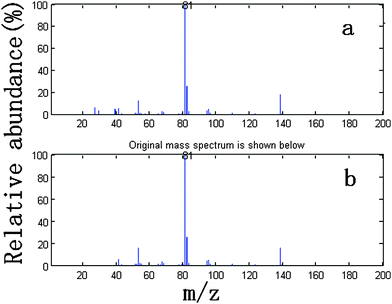 | ||
| Fig. 7 Standard mass spectrum (a) and resolved mass spectrum (b) of 2-pentyl-furan. | ||
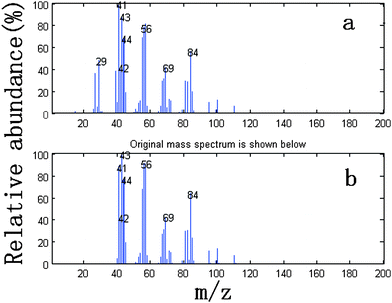 | ||
| Fig. 8 Standard mass spectrum (a) and resolved mass spectrum (b) of octanal. | ||
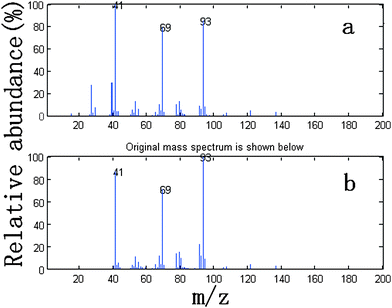 | ||
| Fig. 9 Standard mass spectrum (a) and resolved mass spectrum (b) of β-myrcene. | ||
Other peaks in the studied samples are determined qualitatively in the same way as described above. The tentative qualitative results of constituents of essential oils from RS, RSRN and the HP RS–RSRN are shown in Table 1.
| No | Component/molecular formula | RS (rc) | RSRN (rc) | RS–RSRN (rc) | Average RI |
|---|---|---|---|---|---|
| a rc: relative content (%); RI: retention indices; —: not found. | |||||
| 1 | Heptanal/C7H14O | 1.17 | — | 0.41 | 865.394 |
| 2 | α-Pinene/C10H16 | 3.42 | 20.93 | 22 | 925.164 |
| 3 | Camphene/C10H16 | 0.32 | 3.28 | 3.38 | 931.962 |
| 4 | 1-Heptanol/C7H16O | 0.55 | — | — | 945.671 |
| 5 | (1S)-6,6-Dimethyl-2-methylene-bicyclo[3.1.1]heptane/C10H16 | 3.5 | 15.41 | 12.16 | 960.698 |
| 6 | 2-Pentyl-furan/C9H14O | 0.44 | 0.07 | 0.08 | 969.726 |
| 7 | Octanal/C8H16O | 4.98 | 0.27 | 1.89 | 974.162 |
| 8 | β-myrcene/C10H16 | 0.28 | 0.33 | 0.09 | 976.416 |
| 9 | α-phellandrene/C10H16 | 0.17 | 0.26 | 0.28 | 984.466 |
| 10 | 3-Carene/C10H16 | 0.61 | 1.08 | 2.9 | 993.900 |
| 11 | (+)-4-Carene/C10H16 | 0.34 | 0.18 | 0.54 | 998.366 |
| 12 | 1-Methyl-4-(1-methylethyl)-benzene/C10H14 | 1.65 | 3.11 | 1.47 | 1002.438 |
| 13 | D-Limonene/C10H16 | 5.53 | 9.57 | 7.71 | 1014.584 |
| 14 | Pinene/C10H16 | 0.73 | 0.51 | 1.52 | 1021.222 |
| 15 | (Z)-3,7-Dimethyl-1,3,6-octatriene/C10H16 | 0.15 | 0.23 | 0.15 | 1030.099 |
| 16 | 1-Methyl-4-(1-methylethyl)-1,4-cyclohexadiene/C10H16 | 1.79 | 4.83 | 1.73 | 1039.936 |
| 17 | trans-α,α,5-Trimethyl-5-ethenyltetrahydro-2-furanmethanol/C10H18O2 | 0.56 | 0.04 | 0.06 | 1047.253 |
| 18 | 2-Nonanone/C9H18O | 0.6 | 0.13 | 0.16 | 1063.125 |
| 19 | (+)-2-Carene/C10H16 | 0.65 | 0.89 | 0.87 | 1067.167 |
| 20 | Nonanal/C9H18O | 0.31 | — | 0.25 | 1073.609 |
| 21 | 1,3,3-Trimethyl-bicyclo[2.2.1]heptan-2-ol/C10H18O | — | 1.46 | 1.6 | 1087.973 |
| 22 | 2-Nonenal/C9H16O | 0.86 | — | — | 1123.784 |
| 23 | Borneol/C10H18O | 0.14 | 1.55 | 1.79 | 1133.615 |
| 24 | 4-Methyl-1-(1-methylethyl)-3-cyclohexen-1-ol/C10H18O | 0.99 | 5.74 | 5.98 | 1151.774 |
| 25 | 1-Nonen-3-ol/C9H18O | 1.67 | — | — | 1158.126 |
| 26 | α,α,4-Trimethyl-3-cyclohexene-1-methanol/C10H18O | — | 8.05 | 8.18 | 1170.166 |
| 27 | Benzylidenemalonaldehyde/C10H8O2 | 14.85 | 0.77 | 1.75 | 1219.493 |
| 28 | (E)-2-Tridecenal/C13H24O | 0.97 | 0.56 | — | 1228.645 |
| 29 | Octanoic acid/C8H16O2 | 1.34 | — | — | 1235.776 |
| 30 | Bornyl acetate/C12H20O2 | 0.29 | 2.35 | 2.36 | 1257.154 |
| 31 | (E,E)-2,4-Decadienal/C10H16O | 1.52 | — | 0.35 | 1279.142 |
| 32 | Eudesma-4(14),11-diene/C15H24 | — | 0.41 | — | 1453.956 |
| 33 | 1-(1,5-Dimethyl-4-hexenyl)-4-methyl-benzene/C15H22 | 0.14 | 0.02 | 0.06 | 1466.829 |
| 34 | (S)-1-Methyl-4-(5-methyl-1-methylene-4-hexenyl)-cyclohexene/C15H24 | 4.86 | — | 0.35 | 1485.251 |
| 35 | cis-Undec-4-enal/C11H20O | 1.29 | — | — | 1492.261 |
| 36 | (1S-cis)-1,2,3,5,6,8a-Hexahydro-4,7-dimethyl-1-(1-methylethyl)-naphthalene/C15H24 | 0.25 | 0.17 | 0.03 | 1516.440 |
| 37 | Cyclohexanemethanol/C15H26O | — | 0.42 | 0.07 | 1519.239 |
| 38 | 3-Isopropyl-6,7-dimethyltricyclo[4.4.0.0(2,8)]decane-9,10-diol/C15H26O2 | 1.53 | — | — | 1530.752 |
| 39 | Spathulenol/C15H24O | — | 0.82 | 0.95 | 1552.303 |
| 40 | 1,2,3,4,5,6,7,8-Octahydro-α,α,3,8-tetramethyl-5-azulenemethanol/C15H26O | — | 0.5 | 0.54 | 1575.761 |
| 41 | cis-Lanceol/C15H24O | 0.99 | — | — | 1582.697 |
| 42 | Dehydroxy-isocalamendiol/C15H24O | 0.1 | 0.19 | 0.11 | 1592.936 |
| 43 | γ-Eudesmol/C15H26O | — | 0.52 | 0.76 | 1597.899 |
| 44 | Heneicosane/C21H44 | 0.99 | 0.02 | — | 1792.396 |
| 45 | 1-Heptadecanol acetate/C19H38O2 | 0.14 | 0.01 | 0.02 | 1850.557 |
| 46 | Falcarinol (Z)-(−)-1,9-heptadecadiene-4,6-diyne-3-ol/C17H24O | 10.78 | — | 1.78 | 1996.983 |
4.2. Quantitative analysis of volatile components
According to the resolved chromatogram and mass spectra, the quantitative analysis of each component can be directly calculated by the overall volume integration method.25–27 In total, 79, 70 and 74 volatile components in a volatile oil of RS, RSRN and the HP RS–RSRN were respectively determined qualitatively and quantitatively, accounting for 85.81%, 87.35% and 86.76% total contents of volatile oil of RS, RSRN, and the HP RS–RSRN respectively. Their relative content and retention indices are given in Table 1, where the components are listed in order of elution on a OV-1 column.4.3. Comparison of volatile components between HP RS–RSRN and single herbs RS and RSRN28–30
Some chemical components disappeared in the essential oil of the HP RS–RSRN, such as 1-nonen-3-ol, octanoic acid in RS, and eudesma-4(14),11-diene, and 2-methoxy-4-methy-1-(1-methylethyl)-benzene in RSRN. And there were some new chemical components appearing in the essential oil of the HP RS–RSRN but with low quantity, such as n-decanoic acid, and 2-methyl-1-hexadecanol. This is based on some chemical reactions taking place during the process of decocting two single herbs, which usually include oxidation, reduction, condensation, and especially hydrolysis. In addition to chemical reactions, much attention should be paid to physical effects like solubilization effect and co-dissolving effect in decoction of two single herbs, which is very popular in traditional Chinese medicinal prescriptions.31–33 For example, benzylidenemalonaldehyde, the main volatile component of RS, only accounts for 1.75% in the HP RS–RSRN. It may be due to the fact that it's a kind of very active organic molecule. It can be oxidized to an acid and can also be reduced to an alcohol. Besides, it can carry out a condensation reaction, and the reaction products are not volatile.Comparison of the essential oil compositions showed that there are 44 common essential chemical components between the HP RS–RSRN and single herb RS, 53 common essential chemical components between the HP RS–RSRN and single herb RSRN, and 33 common essential chemical components among the three system, i.e. the HP RS–RSRN and two single herbs RS and RSRN. In terms of the number and the relative content of the chemical components, the volatile chemical components in HP RS-RSRN are mainly from single herb RSRN, and the number of volatile chemical components in HP RS–RSRN is almost equal to the sum of the number of the two single herbs but with a different quantity.
5. Conclusion
In this paper, by using a chemometric method and PTRIs, the essential oils of HP RS–RSRN and two single herbs RS and RSRN were analyzed and then compared regarding their qualitative and relatively quantitative characteristics. The information about the chemical constituents of essential oils is useful and necessary to the further pharmacological study of HP RS–RSRN, which will certainly help us to utilize HP RS–RSRN better. The results obtained showed that AMWFA could be a convenient and fast tool for doing comparative analysis in complicated systems. In addition, the chemometric method with the combination of PTRIs could greatly enhance the accuracy of quantitative and qualitative analysis results. The strength of the chemometric techniques assisted by PTRIs in obtaining more information from the GC-MS data is demonstrated in this investigation.Acknowledgements
This work is financially supported by the National Nature Foundation Committee of PR China (Grant Nos. 20235020 and 20475066) and the Cultivation Fund of Key Scientific and Technical Innovation Project, Ministry of Education of China (No. 704036).References
- J. F. Qu, S. H. Zhang and R. Xie, in The Chinese Materia Medica, Publishing House of ShangHai University of Traditional Chinese Medicine, ShangHai, China, 2000, pp. 65–69 Search PubMed.
- T. L. Tan and Q. L. Liu, in Common-used Herbal Pairs and Contraindictions of Traditional Chinese Medicine, Shanxi Publishing House of Science and Technology, Shanxi, China, 2004, pp. 52–54 Search PubMed.
- D. H. Tian, in Practical Dictionary of Traditional Chinese Herbs, Beijing People's Medical Publishing House, Beijing, China, 2000, pp. 1254–1256, 984–985 Search PubMed.
- R. Manne, H. L. Shen and Y. Z. Liang, Chemom. Intell. Lab. Syst., 1999, 45, 171–176 CrossRef CAS.
- F. Gong, Y. Z. Liang and F. T. Chau, J. Sep. Sci., 2003, 26, 112–122 CrossRef CAS.
- L. F. Huang and K. J. Zhong, Anal. Chim. Acta, 2007, 588, 216–223 CrossRef CAS.
- M. M. Maeder, Anal. Chem., 1987, 59, 527–530 CrossRef CAS.
- M. M. Maeder and A. Zilian, Chemom. Intell. Lab. Syst., 1988, 3, 205–213 CrossRef CAS.
- E. R. Malinowsky, J. Chemom., 1992, 6, 29–40 CAS.
- E. R. Malinowsky, J. Chemom., 1996, 10, 273–279 CrossRef CAS.
- X. G. Shao and M. Q. Li, Chin.J. Chromatogr., 2001, 19, 184–187 Search PubMed.
- O. M. Kvalheim and Y. Z. Liang, Anal. Chem., 1992, 64, 936–946 CrossRef CAS.
- Y. Z. Liang, O. M. Kvalheim and H. R. Keller, Anal. Chem., 1992, 64, 946–953 CrossRef.
- F. Lu and S. Li, Anal. Chim. Acta, 2007, 589, 200–207 CrossRef CAS.
- C. J. Xu and Y. Z. Liang, Anal. Chim. Acta, 2001, 428, 235–244 CrossRef CAS.
- Y. Hu, Y. Z. Liang and B. Y. Li, J. Agric. Food Chem., 2004, 52, 7771–7776 CAS.
- Z. D. Zeng, Y. Z. Liang and Y. L. Wang, J. Chromatogr., A, 2006, 1107, 273–285 CrossRef CAS.
- Pharmacopoeia Committee of the People's Republic of China, in State Pharmacopoeia Committee of the People's Republic of China, Beijing Chemical Industry Press, Beijing, China, 2005, pp. Appendix 57–58 Search PubMed.
- H. V. D. Dool and P. D. Kratz, J. Chromatogr., A, 1963, 11, 463–471 CrossRef CAS.
- Y. M. Wang, L. Z. Yi and Y. Z. Liang, J. Sep. Sci., 2008, 46, 66–74 CAS.
- C. X. Zhao, Y. X. Zeng and M. Z. Wan, J. Sep. Sci., 2009, 32, 660–670 CrossRef CAS.
- X. R. Li, B. Zhang, T. Zhou and Q. Zou, J. Cent. South Univ. Technol., 2008, 39, 923–927 Search PubMed.
- X. R. Li, Z. G. Lan and Y. Z. Liang, J. Cent. South Univ. Technol., 2007, 14, 57–61 Search PubMed.
- S. Liang, Y. W. Li and C. X. Zhao, J. Instrum. Anal., 2008, 27, 84–87 Search PubMed.
- F. Gong and Y. G. Peng, Acta Pharm. Sin., 1999, 3, 214–217 Search PubMed.
- F. Gong and Y. G. Peng, Chem. J. Chin. Univ., 1999, 2, 199–203.
- H. L. Shen and Y. Z. Liang, Sci. Chin., Ser. B: Chem., 1998, 1, 21–29 Search PubMed.
- X. R. Li, Y. Z. Liang and T. Zhou, J. Sep. Sci., 2009, 32, 258–266 CrossRef CAS.
- L. Z. Yi, Y. Z. Liang, Z. D. Zeng and P. Wang, Chem. J. Chin. Univ., 2006, 27, 1626–1630 CAS.
- X. R. Li, T. Zhou and Y. Z. Liang, Acta. Pharm. Sin., 2007, 42, 1082–1086 Search PubMed.
- X. Huang and P. Ren, Chin. Tradit. Herb. Drugs, 2001, 32, 411–413 Search PubMed.
- P. X. Cao and G. Y. Liang, Chin. Tradit. Herb. Drugs, 2001, 32, 981–983 Search PubMed.
- R. Rong and J. R. Yuan, Chin. Tradit. Herb. Drugs, 2001, 32, 114–115 Search PubMed.
| This journal is © The Royal Society of Chemistry 2009 |

