Quantitative analysis in alkaline aluminate solutions by Raman spectroscopy
W. W.
Rudolph
a and
G. T.
Hefter
*b
aMedizinische Fakultät der TU Dresden, Institut für Virologie im MTZ, Fiedlerstr. 42, D-01307, Dresden, Germany
bChemistry Department, Murdoch University, Murdoch, WA 6150, Australia. E-mail: g.hefter@murdoch.edu.au
First published on 24th September 2009
Abstract
A detailed investigation has been made of the analysis of concentrated alkaline aluminate solutions (synthetic Bayer liquors) by Fourier transform (FT) Raman spectroscopy. Satisfactory determinations of Al(OH)4−, SO42− and CO32− were achieved at industrially-relevant concentrations. Possible extensions to a number of other inorganic and organic anions of interest to the alumina refining industry were demonstrated. No significant interferences were observed except for a small but readily correctable contribution of a minor SO42− mode at ∼615 cm−1 to the Al(OH)4− envelope centred at ∼620 cm−1. Hydroxide (OH−) could not be determined with the present FT instrument, due to the low detector sensitivity at high wavenumbers, but might be possible with other spectrometers. Successful extension of the analyses to industrial Bayer process solutions is briefly discussed.
1. Introduction
The Bayer process is used world-wide to extract alumina from bauxitic ores, producing in excess of 50 million tonnes of purified alumina per year.1 In essence, the Bayer process involves the use of hot concentrated caustic soda solution, NaOH(aq), to dissolve the gibbsite, Al(OH)3, and/or boehmite, AlOOH, present in the ore. The concentrated alkaline aluminate solutions so formed, consist mostly of NaAl(OH)4(aq) and excess NaOH(aq).2 Purified gibbsite is then precipitated from such solutions by cooling and seeding. Simplistically then, the Bayer process can be represented by the equilibrium| NaOH(aq) + Al(OH)3(s) ⇌ NaAl(OH)4(aq) |
While Bayer plants differ in detail with regard to their operations, all involve the continuous recycling of these alkaline aluminate solutions, which are generally referred to as ‘Bayer liquors’.1,2 This recycling inevitably results in a build up of various inorganic and organic3 impurities in the plant liquors. While some of these impurities create no major difficulties in plant operations, others can be critical and their levels must be continuously monitored and, where necessary, ameliorated using appropriate procedures. The nature of such impurities varies considerably among Bayer plants but typical examples include sulfate, oxalate, and fluoride. Some of these species are routinely determined in plant Bayer liquors (PBLs) by a variety of methods such as ion chromatography, capillary electrophoresis, ICPAES, and so on. In addition to impurities, analytical monitoring for process control and optimisation purposes of the key components of PBLs: Al(OH)4−, OH− and CO32−, is intensive throughout most stages of the Bayer cycle. The analytical procedures used to determine these species vary from plant to plant, with titrimetric methods4,5 still popular. Nearly all Bayer plant analyses, for both major and minor species, are performed off-line. While this is satisfactory for most operations it introduces limitations with respect to process control and optimisation. There is therefore a need to develop simple procedures for determining a variety of species in alkaline aluminate solutions with the potential for on-line application.
Raman spectroscopy has not been widely used for analyses in industrial contexts.6–9 There are many reasons for this. In particular, analysis of ‘real’ materials by Raman spectroscopy is often dogged by sample fluorescence (mostly arising from minor organic impurities) that swamps the relatively weak Raman signal; spectral accumulation periods are relatively long and Raman detection limits are generally quite high. Good quality Raman spectrometers (cf.UV-visible equipment) are reasonably expensive and, at least for typical laboratory instruments, not very robust. Nevertheless, Raman spectroscopy has some advantages compared with other analytical methods and ongoing technological improvements7 have created an opportunity to re-examine its possibilities for the analysis of alkaline aluminate solutions.
Probably the most important development in Raman spectroscopy in the present context is the introduction of near-infrared laser excitation sources of good intensity. Such sources produce much less fluorescence than the earlier shorter wavelength (λ) lasers albeit with some loss of Raman intensity (I), since I ∝ λ−4. In addition, the usual advantages of Raman spectroscopy7 offer good prospects for analyses of relevance to the Bayer process. These include: relatively uncluttered spectra, reasonably flat baselines, spectral specificity, weak Raman scattering by water, low wavenumber limits, and the (relatively) good scattering intensities of certain species10 of specific interest in Bayer plants.
Accordingly, this paper presents a detailed study of the potential utility of Raman spectroscopy for the determination of a number of important Bayer-process species:1,2Al(OH)4−, OH−, CO32− and SO42−, in alkaline aluminate solutions. Possible extension to some other species is also discussed. For demonstration purposes, the present measurements have been made in solutions prepared from reagent grade chemicals but at concentrations relevant to typical Bayer-plant conditions, hereafter referred to as synthetic Bayer liquors (SBLs). However, it will be shown that such measurements can be extended readily to real plant Bayer liquors.
2. Experimental
2.1 Materials and solutions
All solutions were prepared with high-purity water (Millipore Milli-Q system). Analytical grade Na2SO4, Na2CO3, Na2C2O4 (all 99.5%, BDH, UK) were used as received. Stock solutions of NaOH (∼8 mol/L, hereafter: M) were prepared from analytical grade pellets (98% w/w, Ajax Chemicals, Australia). The carbonate content of the NaOH stock solutions was minimized by addition of solid CaO and subsequent filtration (0.45 µm) as described elsewhere.11 After preparation, the solution was stored at room temperature in an airtight pyrex-glass container equipped with a CO2 trap. Note that the rate of reaction between pyrex glass and highly alkaline solutions is negligible at room temperature.11 Concentrations of NaOH solutions were determined (to ±0.2%) by glass electrodepotentiometric titrations against hydrochloric acid (Concentrated Volumetric Standard, BDH, UK). Titration data were evaluated by Gran plots and the ESTA suite of computer programs12 and indicated a carbonate concentration of less than 0.05% of the total alkalinity (i.e., <4 mM in 8 M NaOH). These measurements were cross-checked by Raman spectroscopy (see below).Alkaline aluminate solutions of accurately known concentrations were prepared by dissolving degreased aluminium wire (‘99.99%’ grade, BDH, UK) in ∼8 M NaOH as discussed in detail previously.13 The densities of the solutions so prepared were measured with an Anton Paar DMA 02D high-precision vibrating tube density meter at (25 ± 0.02) °C using air and distilled water as the density standards. More dilute solutions were prepared by weight from the stock solutions.
2.2 Instrumentation
Raman spectra were mostly recorded at Murdoch University on a Nicolet Magna 850 Series II FT-IR spectrometer equipped with a Magna Raman module using a Nd:YAG laser operating at 1064 nm and an InGaAs detector with a 180° scattering geometry. A laser power of ∼750 mW, a resolution of 4 cm−1, and 512 or 1024 scans were used throughout unless otherwise specified. Spectra were recorded using 5 mm diameter fluorescence-free NMR tubes at 25 ± 1 °C, unless otherwise specified. The sample tube was aligned using cyclohexane. Spectral intensities varied by ≲ ±2% while band positions were precise to ±0.02 cm−1 (Connes advantage6,7). High temperature Raman measurements were performed using a custom-made attachment (Ventacon, UK Hot Cell Series H) powered and controlled to ±1 °C with a Ventacon Universal Power supply D2. During measurements at higher temperatures care was taken to minimise contact time between the glass tubes and the alkaline solutions; ICPAES analysis showed no appreciable increase in the Si-content of the samples over typical measurement times.Some spectra were also recorded at the Technical University, Freiberg, Germany, in the macro chamber of a Jobin-Yvon T 64000 Raman spectrometer, using the green (514.5 nm) Ar+ laser line at 1000 mW power and a 90° scattering geometry in a temperature-controlled room at (22 ± 0.5) °C. After passing the spectrometer in the subtractive mode, with gratings of 1800 grooves per mm, the scattered light was detected with a cooled charge-coupled detector. The spectral resolution in the subtractive mode was typically 3.5 cm−1. Spectra were measured in the so-called IVV scattering geometry, obtained with fixed polarisation of the laser beam passing the analyser and a half-wave plate. Band positions in the subtractive mode were reproducible to ca. ±0.5 cm−1 and in the additive mode to ±0.2 cm−1.
All spectra were baseline-corrected and integrated band intensities were determined using Galactic Grams 32.5 (FT spectra recorded at Murdoch) or LABSPEC 2 (spectra recorded at Freiberg) software. Four parameters were adjusted for each mode: bandwidth (full width at half maximum height, fwhh), peak height, peak position (νmax) and the Gauss/Lorentz factor, RGL. Integrated intensities of the individual bands were derived from these data using integration limits of νmax ± 50 cm−1, except for aluminate which was integrated over the range 450–760 cm−1 for reasons discussed below (Section 3.2).
3. Results and discussion
3.1 Spectral overview
A typical raw broadband Fourier transform Raman (FTR) spectrum of a concentrated SBL is shown in Fig. 1. The spectrum is remarkably uncluttered and shows relatively little evidence of fluorescence (no special precautions were taken to minimise trace organics). As is well known,14–16 in alkaline aluminate solutions at high [Al(III)]T (where the square brackets denote concentration and the subscript T indicates total), the main centrosymmetric stretching mode of Al(OH)4−, centred at ∼620 cm−1, shows some associated relatively low intensity bands at ∼535 and ∼698 cm−1. The origin of these bands, whose intensities (and to some extent locations) are concentration-dependent, are still debated16 but are broadly thought to reflect changes in the chemical speciation of Al(III). The peak at ∼1654 cm−1 is the water deformation mode. The broad H2O/OH− peak centred at ∼3300 cm−1 is not properly resolved in the spectrum shown in Fig. 1 due to instrumental limitations (Section 3.6). Interestingly, despite the low intensities associated with the present FTR instrument it was still possible to identify a trace (∼8 mM) of adventitious CO32− at 1066 cm−1.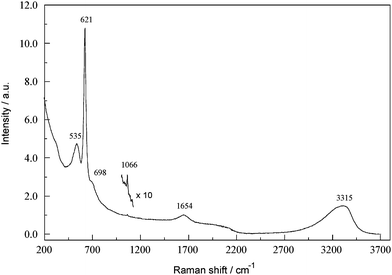 | ||
| Fig. 1 FT-Raman overview spectrum of a concentrated SBL (4.063 M NaAl(OH)4, 3.637 M free OH−). For band assignments see text; note the trace carbonate contamination detected at 1066 cm−1. | ||
3.2 Quantitative determination of [Al(III)]T in SBLs
The value of [Al(III)]T is a critical process variable at almost any location in a Bayer plant.2 A quick and straightforward measurement of this quantity is therefore of considerable interest, even if it might be less accurate than existing procedures.Fig. 2(a) shows a series of FTRspectra with increasing [Al(III)]T (≈ [Al(OH)4−]), at a fixed [OH−]/[Al(III)]T ratio. These spectra are quantitatively comparable with those published in the literature.14–16 As has been shown previously,16 the integrated intensity (area, A) of the band envelope from 450 to 760 cm−1, hereafter designated for convenience simply as A620, is proportional to [Al(III)]T. Note that this proportionality operates even though there is some formation of other Al(III)-containing species. This is because the major Raman modes for such species also occur within the 450–760 cm−1 envelope.14–16 The calibration curve obtained over the range 0.6 ≲ [Al(III)]T/M ≲ 4.7, which is typical of real PBLs, is a reasonable straight line (Fig. 2(b)) with a correlation coefficient of R2 = 0.997.
![(a) FT-Raman spectra at 200 ≤ Δν/cm−1 ≤ 1000 of NaAl(OH)4 solutions with 0.6 ≤ [Al(III)]T/M ≤ 4.7 (upper panel) showing the three modes associated with Al(III) species14–16 at 535, 620 and 698 cm−1; and at 1000 ≤ Δν/cm−1 ≤ 2000 (lower panel) showing the deformation band of H2O at ca. 1642 cm−1. (b) Corresponding calibration curve for aluminate.](/image/article/2009/AY/b9ay00064j/b9ay00064j-f2.gif) | ||
| Fig. 2 (a) FT-Raman spectra at 200 ≤ Δν/cm−1 ≤ 1000 of NaAl(OH)4 solutions with 0.6 ≤ [Al(III)]T/M ≤ 4.7 (upper panel) showing the three modes associated with Al(III) species14–16 at 535, 620 and 698 cm−1; and at 1000 ≤ Δν/cm−1 ≤ 2000 (lower panel) showing the deformation band of H2O at ca. 1642 cm−1. (b) Corresponding calibration curve for aluminate. | ||
Fig. 2(a), lower panel, shows the deformation mode for water, here centred at ∼1642 cm−1, for the same solutions. The near independence of the band area for this mode on [Al(III)]T opens the possibility of using it as an approximate internal standard. The calibration curve (not shown), normalised to the area of the1642 cm−1 band, i.e., A620/A1642vs. [Al(III)]T, was also a good straight line with similar parameters to those shown in Fig. 2(b) but is more robust. For example, it improves the reliability of measurements of [Al(III)]T made over lengthy periods, without the need for continual calibration. Best accuracy is still of course achieved by conventional calibration. The precision of the present determinations of [Al(III)]T is about ±4% relative.
3.3 Quantitative determination of SO42− in SBLs
Sulfate is a major impurity in some Bayer plants and a minor one in most. It can have a number of economically significant effects on operations and therefore is monitored routinely in many plants.The FTRspectra obtained when a representative SBL was spiked with Na2SO4(aq) are shown in Fig. 3(a). Consistent with the known spectrum of SO42−(aq)17 weak bands are observed at 451 and 1110 cm−1 in addition to the dominant symmetric stretch at 981 cm−1. On the other hand, the weak bending mode at 615 cm−1 is subsumed by the Al(OH)4− mode centred at 620 cm−1. The calibration curve for SO42−(aq), using the integrated area of the 981 cm−1 band, shows good linearity (R2 = 0.999) over the industrially-relevant concentration range 0.01 ≲ [SO42−]/M ≲ 0.5 (Fig. 3(b), upper panel). As would be expected, the addition of SO42−(aq) affects the observed integrated intensity of the Al(OH)4− envelope (Fig. 3(b), lower panel). Measurements (not shown) of Na2SO4 dissolved in NaOH(aq) indicate that the ratio of the two sulfate band intensities, A615/A981, is independent of [SO42−] so it is possible to correct for the effect of [SO42−] on A620 by utilising A981 (Fig. 3(b), lower panel).
![(a) FT-Ramanspectra of a moderately concentrated SBL (0.947 M NaAl(OH)4, 0.609 M free OH−) spiked with 0.01 ≤ [Na2SO4]/M ≤ 0.5. (b) Corresponding calibration curve for sulfate (upper panel) and the effect of sulfate on the aluminate mode (lower panel, see text).](/image/article/2009/AY/b9ay00064j/b9ay00064j-f3.gif) | ||
| Fig. 3 (a) FT-Ramanspectra of a moderately concentrated SBL (0.947 M NaAl(OH)4, 0.609 M free OH−) spiked with 0.01 ≤ [Na2SO4]/M ≤ 0.5. (b) Corresponding calibration curve for sulfate (upper panel) and the effect of sulfate on the aluminate mode (lower panel, see text). | ||
Similar sets of spectra (not shown) were obtained using both the Nicolet and Jobin-Yvon spectrometers for sulfate in a wide variety of SBLs. The results were essentially identical to those shown in Fig. 3: calibration curves showed excellent linearity and the effect on A620 was quantitatively reproducible and correctable. Thus Raman spectroscopy appears to be an excellent method for the quantitative determination of SO42− in alkaline aluminate solutions, with good sensitivity ([SO42−] ≳ 4 mM with the Nicolet FTR instrument, lower for the Jobin-Yvon spectrometer), a wide dynamic range, linear calibration curves, and an easily-correctable interference with Al(OH)4−.
3.4 Quantitative determination of CO32− in SBLs
Carbonate is a critical impurity in all Bayer plants.2 It is mostly formed as the ultimate degradation product of organic matter (humic substances) present in bauxite ores by the hot, strongly alkaline aluminate solutions and, to a lesser extent, by absorption of atmospheric CO2. Carbonate levels are monitored throughout most plants and controlled by an expensive ‘re-causticisation’ process using lime:18,19| CO32−(aq) + CaO(s) + H2O → CaCO3(s) + 2OH−(aq) |
The FTRspectra obtained for quantitative additions of Na2CO3 to a representative SBL are shown in Fig. 4(a). The minor CO32−(aq) bands10,20 at 1376 and 1420 cm−1 are hardly detected but the strong symmetric stretch at 1066 cm−1 shows up clearly. The resultant calibration curve, covering the concentration range 0.01 ≲ [CO32−]/M ≲ 0.5, is shown in Fig. 4(b), upper panel. It has excellent linearity (R2 = 0.9997) and there is no discernible effect on A620 (Fig. 4(b), lower panel). Again similar measurements (not shown) in a wide range of SBLs produced essentially identical results to those shown in Fig. 4.
![(a) FT-Ramanspectra of a moderately concentrated SBL (0.947 M NaAl(OH)4, 0.609 M free OH−) spiked with 0.01 ≤ [Na2CO3]/M ≤ 0.5. (b) Corresponding calibration curve for carbonate (upper panel); uncorrected band area of the aluminate envelope (lower panel, see text).](/image/article/2009/AY/b9ay00064j/b9ay00064j-f4.gif) | ||
| Fig. 4 (a) FT-Ramanspectra of a moderately concentrated SBL (0.947 M NaAl(OH)4, 0.609 M free OH−) spiked with 0.01 ≤ [Na2CO3]/M ≤ 0.5. (b) Corresponding calibration curve for carbonate (upper panel); uncorrected band area of the aluminate envelope (lower panel, see text). | ||
3.5 Quantitative determination of C2O42− in SBLs
Oxalate, C2O42−, occurs in PBLs as a result of the decomposition of the organic matter present in typical ores.21 The solubility of Na2C2O4 is rather low (0.26 M in water at 25 °C)22 but is considerably depressed, via the common ion effect, by the high [Na+] typical of PBLs (e.g., to <0.01 M in 5 M NaOH(aq)).22Oxalate causes numerous problems in Bayer plants not least because it is a ‘seed poison’ that inhibits gibbsiteprecipitation.1,21Fig. 5 shows the effects of added Na2C2O4 on the FTRspectrum of a dilute SBL. The aquated oxalate ion23 has its main peak at 903 cm−1, with weaker modes at 438, 1308, 1456 and 1488 cm−1. Even though C2O42−(aq) is a relatively poor Raman scatterer, the calibration curve (not shown) derived from these data, based on the band at ∼903 cm−1 and covering the concentration range 0.02 ≲ [C2O42−]/M ≲ 0.1, showed good linearity (R2 = 0.999). However, in more concentrated SBLs (i.e., with higher [Na+]) the measurement of dissolved oxalate may become problematic due to the decreased solubility of Na2C2O4. Detection of C2O42− in PBLs is also likely to be difficult because the background noise will be higher (Section 3.11). On the other hand, satisfactory spectra (not shown) could be obtained at [C2O42−(aq)] < 0.01 M in a concentrated SBL using the more sensitive Jobin-Yvon spectrometer.
![FT-Raman
spectra of a dilute SBL (0.463 M NaAl(OH)4, 0.280 M free OH−) spiked with 0.01 ≤ [Na2C2O4]/M ≤ 0.1.](/image/article/2009/AY/b9ay00064j/b9ay00064j-f5.gif) | ||
| Fig. 5 FT-Raman spectra of a dilute SBL (0.463 M NaAl(OH)4, 0.280 M free OH−) spiked with 0.01 ≤ [Na2C2O4]/M ≤ 0.1. | ||
3.6 Possible determination of OH− in SBLs
Hydroxide is one of the most important variables in the Bayer process and its concentration is monitored closely throughout typical Bayer plants.2 The manufacturer's stated upper frequency (energy) range of the present FTRspectrometer is 3700 cm−1. However, because of the greatly reduced detector sensitivity at high wavenumbers, the stretching mode of OH−(aq) at ∼3614 cm−1 was not distinguishable from the broad H2O envelope at ca. 3000 to 3600 cm−1 (Fig. 1). In contrast, the 3614 cm−1 band was well defined in spectra recorded with the Jobin-Yvon instrument (Fig. 6). This suggests that it may be possible to determine OH−(aq) either using different Raman instrumentation or near infra-red (NIR) spectroscopy, in each case coupled with appropriate chemometric techniques for quantification.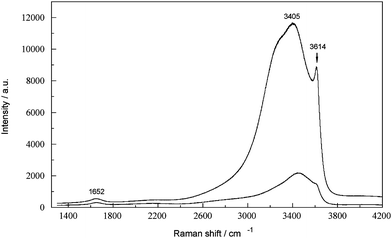 | ||
| Fig. 6 Raman spectrum (Jobin-Yvon spectrometer) showing the polarized (upper trace) and depolarized (lower trace) components for a 5.47 M NaOH solution. | ||
3.7 Possible determination of other anions in SBLs
A number of other anionic species of potential interest in industrial BLs were briefly investigated.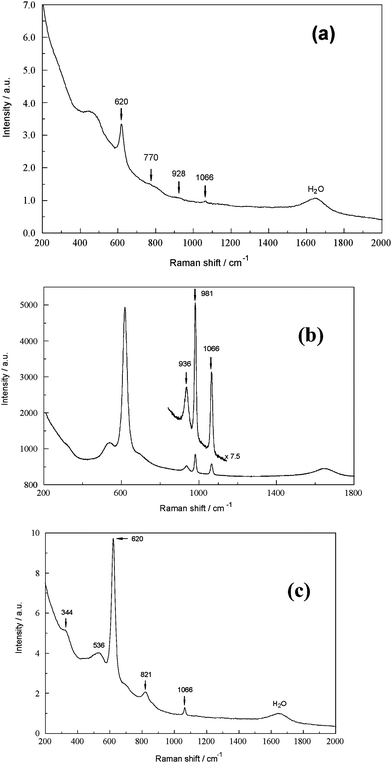 | ||
| Fig. 7 (a) FT-Ramanspectrum of a SBL (0.423 M NaAl(OH)4, 4.650 M free OH−) with 0.0705 M ‘Na4SiO4’ (modes at 770 and 928 cm−1) and 0.01 M carbonate. (b) Raman spectrum (Jobin-Yvon spectrometer) of a SBL (2.653 M NaAl(OH)4, 2.462 M free OH−) with 0.0561 M Na3PO4 (mode at 936 cm−1), 0.0705 M Na2SO4 and 0.01 M Na2CO3. (c) FT-Ramanspectrum of a SBL (2.819 M NaAl(OH)4, 4.832 M free OH−) with 0.120 M Na3VO4 (modes at 344 and 821 cm−1) and 0.02 M carbonate. | ||
3.8 Interferences
Apart from the correctable interference noted earlier of the SO42−(aq) band at 615 cm−1 on the aluminate envelope centred on 620 cm−1 (Fig. 3(b)) no significant interferences were observed among any of the species of interest here. Nevertheless, it was considered worthwhile to make some additional measurements on various mixed solutions. For example, the FTRspectra (not shown) of a dilute SBL containing 0.150 M of SO42− and varying amounts of carbonate (0.019 ≲ [CO32−]/M ≲ 0.330) indicated that the major bands for both species (at 981 and 1066 cm−1 respectively) had no effect upon each other even at the highest [CO32−]. Similar results (not shown) were obtained at other [SO42−]/[CO32−] ratios, for other SBL concentrations, and for more complex mixtures with other ions of interest.3.9 Effects of temperature
The effects of temperature on the present spectra are of interest in the context of possible on-line measurements (the temperatures of PBLs typically vary from room temperature up to ∼180 °C). The FTRspectrum of a concentrated SBL containing 0.154 M SO42−(aq) shows (Fig. 8) that the aluminate envelope centred on 620 cm−1 and the sulfate band at 981 cm−1 are unaffected over the temperature range 25 ≤ t/°C ≤ 100. Specifically, both the band positions and their integrated intensities were constant within their typical experimental reproducibilities (Section 2.2). The lack of sensitivity of the aluminatespectra towards temperature is consistent with previous observations.14,16 Similar null results (not shown) were obtained for other ions and SBL concentrations.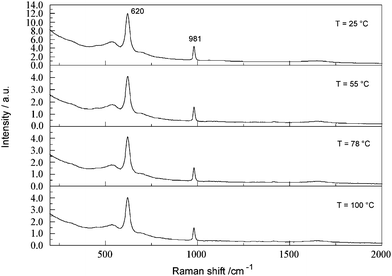 | ||
| Fig. 8 Temperature dependence, over the range 25 ≤ t/°C ≤ 100, of the FT-Ramanspectrum of a concentrated SBL (4.063 M NaAl(OH)4, 3.637 M free OH−) containing 0.154 M Na2SO4. | ||
3.10 Effects of instrumental parameters
No particular attention was paid in the present study to optimizing instrumental parameters. In practical determinations in an industrial context, experience and the specific characteristics of the spectrometer and the samples will determine optimal settings.8,9 Trade-offs will inevitably need to be made, eg, between speed of measurement and sensitivity. Even so, it is of interest to know that the Raman analysis of alkaline aluminate solutions is reasonably robust with respect to major instrumental parameters (see also Section 3.9).Fig. 9 shows the effect of the number of scans (ie, scan time) on the FTRspectrum of a dilute SBL containing oxalate, which is a rather weak Raman scatterer (Section 3.5). Even after just 4 s scanning both major peaks (Al(OH)4− at 620 cm−1 and H2O/NaOH at ca. 3300 cm−1) are clearly defined even though the signal to noise ratio (S/N) is low. As expected, S/N increases with increasing scan number (Felgett advantage6,7); even so, the weaker oxalate peaks, which are barely visible at the sensitivity of the diagram, require at least 60 s scan time for clear definition.23 The spectra in Fig. 9 suggest that short scan times (tens of seconds) should be sufficient for the determination of major components in BLs whereas trace components may require tens of minutes of scanning, depending on their scattering strengths and concentration. Scan time can also be reduced by lowering the spectrometer resolution, with respect to frequency since scan rate is proportional to resolution. The analytical information provided by spectra recorded with a resolution of up to 4 cm−1 (spectra not shown) was identical within experimental error.
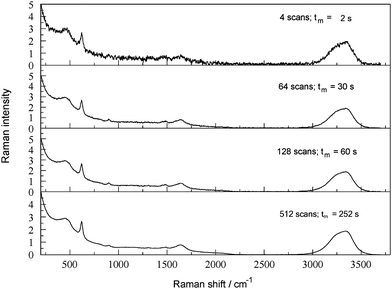 | ||
| Fig. 9 FT-Raman spectrum of a dilute SBL (0.436 M NaAl(OH)4, 0.280 M free OH−) containing 0.102 M Na2C2O4, as a function of number of scans and approximate measurement time (tm). | ||
3.11 Analysis of industrial plant Bayer liquors
The composition of real PBLs varies widely, both within a given plant and between plants, ranging from, for example, cool dilute ‘spent’ liquors to hot supersaturated highly concentrated ‘green’ liquors.1,2 The analysis of each type of solution and each component has its own particular difficulties. The extension of the present measurements on relatively clean synthetic BLs to real plant BLs must overcome numerous practical problems that are not addressed here. Potentially one of the most difficult of these problems is the presence of significant amounts of dissolved organic compounds derived from humic and other organic materials in the ore. Such species typically fluoresce strongly but, as explained in the Introduction, this problem is largely side-stepped by using a near-IR (1064 nm) laser excitation source.Fig. 10 shows the raw FTRspectrum of a ‘trim-discharge’ liquor from the Worsley alumina plant in south-western Australia. As might be expected from the organic content of this sample, which was strongly coloured, the baseline is higher than those observed in SBLs (cf. Fig. 1). Nevertheless, the spectrum remained uncluttered and the major modes for Al(OH)4−(aq) and SO42−(aq) at ∼620 cm−1 and 981 cm−1 respectively were readily identifiable; a small amount of CO32−(aq), barely discernible at the sensitivity of the diagram, was also detected. Quantification, by calibration curve for Al(OH)4− and standard additions for SO42− and CO32−, indicated concentrations of 4.4 M, 0.089 M and 0.012 M respectively, consistent with plant analyses using standard procedures. Also shown in Fig. 10 (lower curve) is the raw spectrum of the same sample after filtration (0.45 µm). While the background intensity was slightly reduced due to a decrease in Mie scattering the analyses were unaffected, i.e., the band positions and integrated band intensities were the same within the usual experimental uncertainties. Similar results (not shown) have been obtained on other plant liquors of widely varying composition.
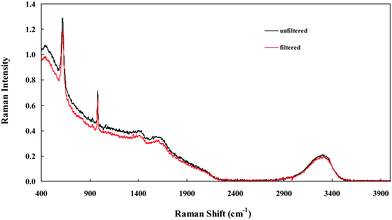 | ||
| Fig. 10 Raw FT-Ramanspectrum of a trim-discharge plant Bayer liquor: upper curve, unfiltered; lower curve, filtered (0.45 µm). | ||
In summary, the data outlined above indicate that Raman spectroscopy offers good prospects for the determination, at industrially-relevant concentrations, of a number of key species of interest in real Bayer process solutions.
Acknowledgements
This work was funded by Worsley Alumina P/L, Collie, Australia. The authors thank Dr Steve Rosenberg, Dr Alex Aboagye and Mr Darrel Wilson for their on-going support, Dr Gert Irmer for access to the Jobin-Yvon spectrometer at the Technical University of Freiberg, Germany, and Dr Chandrika Akilan for performing the plant liquor analyses.References
- I. J. Polmear, Light Alloys; Metallurgy of the Light Metals, 3rd edition, Butterworth-Heinemann, Oxford, 1995 Search PubMed.
- P. C. Varley, The Technology of Aluminium and its Alloys, Newnes-Butterworth, London, 1970 Search PubMed.
- S. Kumar and P. O. Kirkvine, Light Metals, 1991, 1229 Search PubMed.
- H. L. Watts and D. W. Utley, Anal. Chem., 1956, 28, 1731 CrossRef CAS.
- W. L. Connop, Proc. 4th Int. Alumina Qual. Workshop, Darwin, Australia, 2–7 June 1996, pp 321–330 Search PubMed.
- M. J. Pelletier, ed., Analytical Applications of Raman Spectroscopy, Blackwell, London, 1999 Search PubMed.
- R. L. McCreery, Raman Spectroscopy for Chemical Analysis, Wiley, New York, 2000 Search PubMed.
- I. R. Lewis and H. G. M. Edwards, Handbook of Raman Spectroscopy: From the Research Laboratory to the Process Line, Marcel Dekker, New York, 2001 Search PubMed.
- N. L. Jestel, ‘Process Raman spectroscopy’, in K. A. Bakeev, ed., Process Analytical Technology, Blackwell, 2005, pp 133–169 Search PubMed.
- K. Nakamoto, Infrared and Raman Spectra of Inorganic and Cooordination Compounds, 5th edition, Wiley, New York, 1997 Search PubMed.
- P. Sipos, P. M. May and G. T. Hefter, Analyst, 2000, 125, 955 RSC.
- P. M. May, K. Murray and D. R. Williams, Talanta, 1985, 32, 483 CrossRef CAS.
- P. Sipos, G. T. Hefter and P. M. May, Aust. J. Chem., 1998, 51, 445 CrossRef CAS.
- R. J. Moolenar, J. C. Evans and L. D. McKeever, J. Phys. Chem., 1970, 74, 3629 CrossRef CAS.
- C. T. Johnston, S. A. Agnew, J. R. Schoonover, J. W. Kenney, R. Page, J. Osborne and R. Corbin, Environ. Sci. Technol., 2002, 36, 2451 CrossRef CAS.
- P. Sipos, P. M. May and G. T. Hefter, Dalton Trans., 2006, 368 RSC.
- W. W. Rudolph, G. Irmer and G. T. Hefter, Phys. Chem. Chem. Phys., 2003, 5, 5253 RSC.
- F. Habashi, Light Metals, 1983, 39 Search PubMed.
- S. P. Rosenberg, D. J. Wilson and C. A. Heath, Light Metals, 2001, 19 Search PubMed.
- W. W. Rudolph, D. Fischer and G. Irmer, Appl. Spectrosc., 2006, 60, 130 CrossRef CAS.
- G. J. Farquharson, S. Gotsis and J. D. Kildea, Light Metals, 1995, 95 Search PubMed.
- A. Tromans, Ph. D. Thesis, Murdoch University, Australia, 2005.
- W. W. Rudolph, G. Irmer and G. T. Hefter, unpublished.
- D. Fortnum and J. O. Edwards, J. Inorg. Nucl. Chem., 1956, 2, 264 CrossRef CAS.
- W. W. Rudolph and G. Irmer, Appl. Spectrosc., 2007, 61, 1312.
| This journal is © The Royal Society of Chemistry 2009 |
