Isotachophoretic free-flow electrophoretic focusing and SERS detection of myoglobin inside a miniaturized device
Marco
Becker
,
Christian
Budich
,
Volker
Deckert
and
Dirk
Janasek
*
ISAS - Institute for Analytical Sciences, Bunsen-Kirchhoff-Strasse 11, 44139, Dortmund, Germany. E-mail: dirk.janasek@isas.de; Fax: +49 231-1392-120; Tel: +49 231-1392-202
First published on 10th November 2008
Abstract
A new approach for label-free optical sample detection viasurface enhanced Raman spectroscopy (SERS) inside a free-flow electrophoresis (FFE) chip is presented in this work.
Proteins play an important role in a wide range of intra- and intercellular processes. Therefore separation and detection of different proteins is fundamental for the understanding of biological systems. There are different techniques used for protein separation, for example gel-electrophoresis1 and liquid chromatography (LC).2 These techniques need a lot of sample preparation and during the preparation, the structure and functionality of the protein is changed. The results of further analysis then may not represent the native conformation of the protein. In order to detect proteins in a native state inside a microfludic chip Raman spectroscopy can be used.3 In this article the combination of free-flow electrophoresis and surface enhanced Raman spectroscopy inside a microfluidc device is introduced for the first time.
The free-flow electrophoresis (FFE) technique is well suited for sample preparation on a large scale since separation is performed continuously. It provides a continuous sample introduction into the separation chamber and, in contrast to capillary electrophoresis (CE), the electric field is applied perpendicular to the hydrodynamic flow. The two emerging forces (hydrodynamic flow and electric field) create two orthogonally acting velocity vectors which are equal to the flow velocity and proportional to the electrophoretic mobility, respectively. The resulting sum vector is at a defined angle to the flow direction. For two analytes with different size and charge and therefore different electrophoretic mobilities, the angles are different and thus the analytes are separated continuously in a two-dimensional manner at the outlet of the separation chamber. Hence, the time domain of separation is transferred to a local domain,4 which means that FFE can be used for large scale sample preparation and product purification in up-stream and down-stream processes. The hydrodynamic and the electrophoretic force are in a steady-state when the applied pressure and voltage are constant and so the analyte will always be focussed to the same outlet channel. FFE is mostly carried out in conventional bench top devices with volumes in the range of tens of milliliters,5 but it is also possible for miniaturized versions of FFE as shown in this and previous works.
Different modes of FFE like zone-electrophoresis,6–8isoelectric focusing7,9 and isotachophoresis4 have been published. In this article the isotachophoretic (ITP) focusing is used. The analyte is placed between two electrolytes, leading electrolyte (LE) and terminating electrolyte (TE). Both are opted to form an electrophoretic mobility gradient through the separation chamber. After applying an electric field, a gradient in electric field strength is generated, and thus the analyte ions move and finally stack in the order of their electrophoretic mobilities. According to Kohlrausch's law10 the analyte concentration will adapt to the concentration of the leading electrolyte.
For detection of the concentrated and separated proteins surface enhanced Raman spectroscopy (SERS) was used. Raman spectroscopy allows a direct detection of the analytes inside the chip without the need of any additional labeling. During Raman spectroscopy, the frequency shift of the emitted molecule radiation due to inelastic scattering is detected. Raman signals create a unique spectroscopic fingerprint for each analyte and allow a classification of the molecules. Due to the fact of the very small Raman profile of the proteins at low laser intensity and low analyte concentration, a method is needed to enhance detectable signals. Therefore surface enhancement with silver colloids was used to intensify the signal strength via localized surface plasmon resonances.11–15SERS measurements hardly enable analyte concentration determination due to the fact that SERS is a qualitative, rather than a quantitative method.
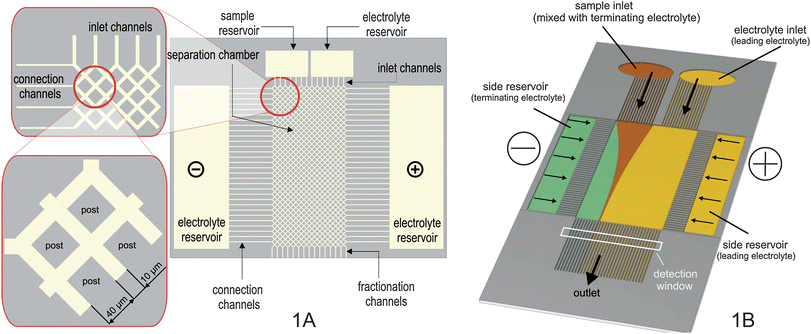
The chip was fabricated in glass by photolithography and wet-etching.7,16 The separation compartment (12.2 mm long, 4.4 mm wide) contained 31.104 diamond-shaped posts of 40 µm edge length. The distance between the centre points of two adjacent posts was 50 µm resulting in the formation of 10 µm wide channels between the posts (see Fig. 1A). The posts avoid the collapse of the chamber during the glass bonding and they extend the separation path length by a factor of √2 because of their shape. Sample solution and collateral buffer were introduced into the separation chamber via 64 inlet channels in such a way that the sample solution (diluted in terminating electrolyte) was bordered by terminating and leading electrolyte, respectively, meeting the ITP demands (Fig. 1B). The solution left the chip through 64 outlet channels. The depth of the structures was wet-etched to 16 µm.
 | ||
| Fig. 1 A: chip design; B: setup overview. | ||
The silver colloids have been prepared as described by Lee and Meisel.17 In order to optimize the Raman signal, the size of the silver colloid was optimized by adding ascorbic acid to the colloid for a better agglomeration. In order to generate the highest signal without blocking the channels, a mixing ratio of 17 : 1 (colloid : ascorbic acid) was found to be optimal for this chip design with respect to signal enhancement and avoiding clogging. The size of the resulting colloids was 5 to 8 µm. 410 µM myoglobin (final concentration) was used as a sample. The protein solution was mixed with the silver colloids and was incubated for one hour prior to use. A 10 mM Cl− solution (adjusted to pH 9.3 using ethanol amine) has been used as leading electrolyte (LE) and a 6 mM β-alanine solution (adjusted to pH 10.2 using Ba(OH)2) was employed as terminating electrolyte (TE). Leading and terminating electrolytes, respectively, were mixed with the agglomerated silver particles. After incubation, the myoglobin–silver particle mixture was diluted in the terminating electrolyte. For the ITP experiment a voltage of 210 V was applied to the electrodes resulting in an electric field of 158 V/cm inside the FFE chamber. The flow rate was adjusted to 5 µl per minute.
The experiments were done on an inverted Raman microscope (HR LabRam, Horiba Jobin Yvon, France). The excitation and signal detection was performed with a 20× objective (Olympus, Japan). For illumination of the sample, a krypton ion laser (568 nm, 1.2 mW at the sample, Coherent, Santa Clara, USA) was focused consecutively to the distinct outlet channels of the microfluidic FFE chip. The laser power and integration time of the Raman measurements were optimized prior to the actual experiment providing high signal-to-noise ratio while avoiding burning of the sample.
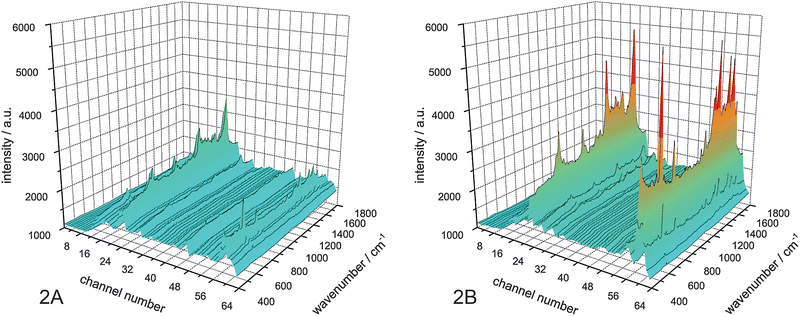
For the proof of the electrophoretic focusing it is necessary to define the channels where the analyte is leaving the chip. In a first experiment no voltage was applied to the chip. This denotes the electrophoretic focusing is only caused by the hydrodynamic forces emerging from the side channels. The Raman spectra for all 64 outlet channels show a hydrodynamic focusing of myoglobin at the channels 16 to 31 (Fig. 2A).
 | ||
| Fig. 2 Raman spectra at the outlet channels. A: no voltage; B: voltage (210 V) applied. | ||
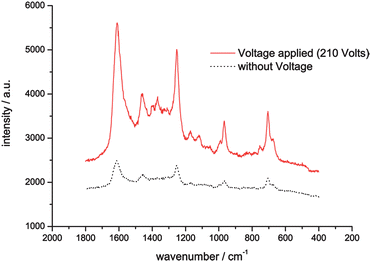
When applying a voltage of 210 V at the electrodes, the myoglobin molecules are focused by the electric field due to their electrophoretic mobility. Raman spectra taken at each outlet channel show sharp focusing of the label free myoglobin at the channels 23 and 24 (Fig. 2B). The intensity of the Raman signals is due to the accumulation of molecules in only two channels, fivefold higher than in the experiment without applied voltage (Fig. 3).
 | ||
| Fig. 3 Raman signal intensity with and without focusing voltage applied. | ||
Additional to the observed spectra in channels 23 and 24, intensified spectra could also be measured at channels 61 and 62. This was an unexpected result because isotachophoretic focusing of one analyte can only give one distinct region of focusing. In comparison to the spectra at channel 23 and 24, the spectra at channels 61 and 62 are slightly different. These spectra do not show myoglobin.
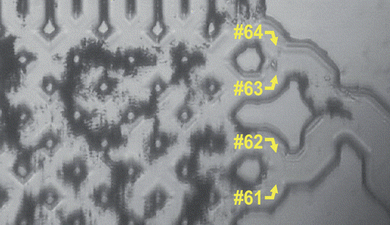
Using optical microscopy an agglomeration of silver colloids was observed in the separation bed (Fig. 4). These colloid cluster only result from the sticking of the colloids and not from the ITP focusing. Raman measurements on these colloid clusters showed the same spectra as the measurements at channels 61 and 62. Because of the unique spectroscopic fingerprint of a Raman signal we can be sure that there is no myoglobin at these channels.
 | ||
| Fig. 4 Colloid cluster at outlet channels 61 and 62. | ||
The obtained results show a distinct focusing of the myoglobin from 16 down to only 2 channels when voltage is applied. Thus, a fivefold higher signal intensity of the analyte Raman spectrum is observable. Besides this, an optimal mixing ratio of ascorbic acid and silver colloids for SERS measurements inside microchannels was determined and the SERS setup was optimized to achieve the best detection results. In order to reuse the chip, we flushed the chip with nitric acid after the measurements to get rid of the silver colloids inside the chip.
The next step will be the improvement of the chip design to avoid blockage of the channels by formation of colloid clusters. One solution can be the use of laser18 or vacuum deposited silver island films. The main advantage is the locally fixed position of the silver nano particles. Experiments with a low concentration of analytes are also necessary to discover the limit of detection. After demonstrating the feasibility of the introduced method, further experiments will include the distinction of more analytes at the same time to show the potential of this label free method. Free-flow electrophoretic focusing in combination with surface-enhanced Raman spectroscopy provides a powerful tool for on-line separation and detection of label free analytes for basic research, biotechnology and the pharmaceutical industry.
Acknowledgements
The financial support by the Ministerium für Innovation, Wissenschaft, Forschung und Technologie des Landes Nordrhein-Westfalen, by the Bundesministerium für Bildung und Forschung as well as the BMBF scheme ‘Nanobiotechnologie’, contract no. 0312032C, is gratefully acknowledged.Notes and references
- C. Dauly, D. H. Perlman, C. E. Costello and M. E. McComb, J. Proteome Res., 2006, 5, 1688–1700 CrossRef CAS.
- Y. Zelechonok, V. Orlovsky and D. Sitnikov, Molecular & Cellular Proteomics, 2005, 4, S347–S347 Search PubMed.
- P. A. Walker, M. D. Morris, M. A. Burns and B. N. Johnson, Anal. Chem., 1998, 70, 3766–3769 CrossRef CAS.
- D. Janasek, M. Schilling, J. Franzke and A. Manz, Anal. Chem., 2006, 78, 3815–3819 CrossRef CAS.
- H. Canut, J. Bauer and G. Weber, J. Chromatogr., B, 1999, 722, 121–139 CrossRef CAS.
- B. R. Fonslow and M. T. Bowser, Anal. Chem., 2005, 77, 5706–5710 CrossRef CAS.
- D. Kohlheyer, G. A. J. Besselink, S. Schlautmann and R. B. M. Schasfoort, Lab Chip, 2006, 6, 374–380 RSC.
- C. X. Zhang and A. Manz, Anal. Chem., 2003, 75, 5759–5766 CrossRef CAS.
- Y. Xu, C. X. Zhang, D. Janasek and A. Manz, Lab Chip, 2003, 3, 224–227 RSC.
- F. Kohlrausch, Ann. Phys. Chem., 1897, 62, 209–239 Search PubMed.
- M. G. Albrecht and J. A. Creighton, J. Am. Chem. Soc., 1977, 99, 5215–5217 CrossRef CAS.
- M. Fleischmann, P. J. Hendra and A. McQuillan, Chem. Phys. Lett., 1974, 26, 163–166 CrossRef CAS.
- D. L. Jeanmaire and R. P. Van Duyne, J. Electroanal. Chem., 1977, 84, 1–20 CrossRef CAS.
- K. R. Ackermann, T. Henkel and J. Popp, ChemPhysChem, 2007, 8, 2665–2670 CrossRef CAS.
- H. Xu, E. J. Bjerneld, M. Käll and L. Börjesson, Phys. Rev. Lett., 1999, 83, 4357–4360 CrossRef CAS.
- R. Mazurczyk, G. El Khoury, V. Dugas, B. Hannes, E. Laurenceau, M. Cabrera, S. Krawczyk, E. Souteyrand, J. P. Cloarec and Y. Chevolot, Sens. Actuators, B, 2008, 128, 552–559 CrossRef.
- P. C. Lee and D. Meisel, J. Phys. Chem., 1982, 86, 3391–3395 CrossRef CAS.
- E. Vogel, W. Kiefer, V. Deckert and D. Zeisel, J. Raman Spectrosc., 1998, 29, 693–702 CrossRef CAS.
| This journal is © The Royal Society of Chemistry 2009 |
