Detection of DNA damage: effect of thymidine glycol residues on the thermodynamic, substrate and interfacial acoustic properties of oligonucleotide duplexes
F.
Yang
a,
E.
Romanova
a,
E.
Kubareva
a,
N.
Dolinnaya
a,
V.
Gajdoš
b,
O.
Burenina
a,
E.
Fedotova
a,
J. S.
Ellis
c,
T.
Oretskaya
a,
T.
Hianik
b and
M.
Thompson
*cd
aChemistry Department and A.N. Belozersky Institute of Physico-Chemical Biology, M. V. Lomonosov Moscow State University, Leninskije Gory, Moscow, 119 991, Russia
bDepartment of Nuclear Physics and Biophysics, Faculty of Mathematics, Physics and Informatics, Comenius University, Mlynská dolina F1, 842 48 Bratislava, Slovak Republic
cInstitute of Biomaterials and Biomedical Engineering, University of Toronto, 164 College Street, Toronto, Ontario M5S 3G9, Canada
dDepartment of Chemistry, University of Toronto, 80 St. George Street, Toronto, Ontario M5S 3H6, Canada. E-mail: mikethom@chem.utoronto.ca
First published on 14th October 2008
Abstract
Thymidine glycol residues in DNA are biologically active oxidative molecular damage sites caused by ionizing radiation and other factors. One or two thymidine glycol residues were incorporated in 19- to 31-mer DNA fragments during automatic oligonucleotide synthesis. These oligonucleotide models were used to estimate the effect of oxidized thymidines on the thermodynamic, substrate and interfacial acoustic properties of DNA. UV-monitoring melting data revealed that modified residues in place of thymidines destabilize the DNA double helix by 8–22 °C, depending on the number of lesions, the length of oligonucleotide duplexes and their GC-content. The diminished hybridizing capacity of modified oligonucleotides is presumably due to the loss of aromaticity and elevated hydrophilicity of thymine glycol in comparison to the thymine base. According to circular dichroism (CD) data, the modified DNA duplexes retain B-form geometry, and the thymidine glycol residue introduces only local perturbations limited to the lesion site. The rate of DNA hydrolysis by restriction endonucleases R.MvaI, R.Bst2UI, R.MspR9I and R.Bme1390I is significantly decreased as the thymidine glycol is located in the central position of the double-stranded recognition sequences 5′-CC↓WGG-3′ (W = A, T) or 5′-CC↓NGG-3′ (N = A, T, G, C) adjacent to the cleavage site. On the other hand, the catalytic properties of enzymes R.Psp6I and R.BstSCI recognizing the similar sequence are not changed dramatically, since their cleavage site is separated from the point of modification by several base-pairs. Data obtained by gel-electrophoretic analysis of radioactive DNA substrates were confirmed by direct spectrophotometric assay developed by the authors. The effect of thymidine glycol was also observed on DNA hybridization at the surface of a thickness-shear mode acoustic wave device. A 1.9-fold decrease in the rate of duplex formation was noted for oligonucleotides carrying one or two thymidine glycol residues in relation to the unmodified analog.
Introduction
Genotoxicity is associated with DNA damage caused by various compounds and processes including oxidative stress, the action of environmental pollutants such as nitrates or organophosphate pesticides, and ionizing radiation.1 Thymidine glycol (5,6-dihydro-5,6-dihydroxy-2′-deoxythymidine) is the main product of oxidative damage. This residue appears due to reaction of thymidine with hydroxyl radicals that are generated by ionizing radiation,2,3 or as a consequence of aerobic metabolism4 (Scheme 1). Four stereoisomers of thymidine glycol exist, of which 5R,6S appears because of the oxidation of thymidine.5 It is apparent that approximately 104–106 DNA damage events can take place in a cell per day,6 with the appearance of thymidine glycol in nucleic acid resulting in significant biological effects. Although this type of damage induces mutations of low frequency, it does effectively block DNA replication.7,8 This effect is mitigated by enzymes that repair such damage. In particular, thymine glycol bases are cleaved by endonuclease III9,10 and endonuclease VIII.11 | ||
| Scheme 1 Transformation of thymidine to thymidine glycol under the action of ionizing irradiation. Only one cis (5R,6S) isomer from four possible epimers was used in this study. | ||
In general, nucleic acid damage caused by oxidative stress and radiation has been studied extensively in connection with its purported substantial contribution to the aging and mutagenesis processes.12 The presence of oxidative products can be determined by various methods, including liquid chromatography, mass spectrometry, electrochemical detection and capillary electrophoresis.13 With regard to electrochemical techniques, DNA is immobilized on various solid substrates with the oxidized bases being detected through study of redox reactions.14–16 Particular attention has been focused on the detection of thymidine glycols due to the fact that these lesions arise in DNA as a result of ionizing irradiation, especially during radiotherapy. Substantial progress in thymidine glycol detection has been achieved using immuno-fluorescence assay combined with capillary electrophoresis.13 This technique allows the detection of thymidine glycols at the level of 10−21 mol.
As is evident from Scheme 1, the appearance of thymidine glycol should change the structural, thermodynamic and biological properties of the DNA double helix. Because of the presence of two hydroxyls in the glycol moiety, the base cycle is more hydrophilic compared with undamaged bases. Thermodynamic studies of oligonucleotides containing two isomers of thymidine glycol have revealed that due to the loss of aromaticity this residue cannot form a base-pair with any nucleotide and participate in stacking interactions.17 The study of hybridizing properties of DNA containing thymidine glycols has been restricted to solution measurements. However, surface-sensitive physical methods could provide additional important information on DNA properties.18 Such studies require large-scale synthesis of oligonucleotides containing thymidine glycol residues at defined positions that can be immobilized on a surface. This approach has been shown recently to be useful in studies of the thermodynamic and acoustic properties of oligonucleotides containing abasic sites,19 and short oligonucleotides with thymidine glycol insertions.17
In this paper we report the effect of single or double substitution of thymidine for thymidine glycol residues on UV-monitored melting behavior of oligonucleotide duplexes and their structural alterations, on the recognition of damaged bases by restriction endonucleases and snake venom phosphodiesterase. The influence of the thymidine glycols incorporated in oligonucleotides on their hybridization capacity at a surface and interfacial acoustic properties is discussed as well.
Experimental
Oligodeoxyribonucleotides
A conventional automatic oligonucleotide synthesis technique was used in order to incorporate the thymidine glycol moiety at a certain position of an oligonucleotide strand. Synthetic thymidine glycol phosphoramidite was purchased from Glen Research (USA). Thymidine glycol derivatives have been shown to be labile during treatment with aqueous ammonia solution, especially at elevated temperature. For this reason, the oligonucleotide deprotection procedure required a short cycle of ammonia treatment and low temperatures. Phosphoramidites – from the UltraMild group of products (Glen Research) – Pac-dA, Ac-dC and iPr-Pac-dG were used during synthesis to provide complete deprotection under the conditions suitable for modified residues. The oligodeoxyribonucleotides (ODNs) containing single and double thymidine glycol residues were synthesized by the phosphoramidite method on an automatic DNA synthesizer (Applied Biosystems 394, USA). Oligonucleotide synthesis proceeded routinely (the coupling time was prolonged to 5 min). Mild cleavage and deprotection using ammonium hydroxide at room temperature for 2 h gave the required oligonucleotide products containing thymidine glycol still protected with the tert-butyldimethylsilyl (TBDMS) group. The reaction mixture was purified by reverse phase HPLC using the hydrophobic properties of TBDMS and 4,4′-dimethoxytrityl [(MeO)2Tr] group. To remove TBDMS groups, triethylamine trihydrofluoride was utilized at 40 °C, overnight. Mixtures were desalted through a G25 column. The deprotected oligonucleotides were analyzed by HPLC (ion-pair mode). The compositions of the oligonucleotides are shown in Table 1. Structures were confirmed by Matrix-Assisted Laser Desorption/Ionization, Time Of Flight Mass Spectrometry (MALDI-TOF MS).| No. | DNA duplexes (5′–3′/3′–5′) | T m (± 1)/°C | h 260 (± 1) (%) | C D/μM |
|---|---|---|---|---|
| I |

|
75 | 14 | 4.40 |
| II |

|
67 | 12 | 3.08 |
| III |

|
72 | 13 | 2.55 |
| IV |

|
60 | 16 | 2.22 |
| V |

|
62 | 15 | 2.13 |
| VI |

|
49 | 18 | 2.05 |
In the thickness-shear mode (TSM) experiments, we used the 19-mer ODNs, containing one or two thymidine glycol (Tgl) residues:
The complementary ODN was modified by biotin at its 5′-end:
As a control we used the unmodified ODN as follows:
We also used an oligonucleotide with the sequence similar to ODN1 but containing an adenosine residue instead of Tgl:
This ODN was used to study the influence of another type of hydrogen-bonding disturbance on the DNA duplex stability. The hybridization of ODN5 with ODN3 should result in double-stranded (ds) DNA containing the non-canonical A·A base-pair.
ODNs(3–5) were purchased from Thermo Electron Corporation (Germany). The oligonucleotide concentration was determined spectrophotometrically with a UV-VIS Hitachi 150-20 or a Shimadzu UV1700 spectrophotometer.
Preparation of radiolabeled oligonucleotides
Oligonucleotides were radiolabeled at the 5′-end using T4-polynucleotide kinase and [γ-32P]ATP in 10 μl of 50 mM Tris-HCl buffer (pH 7.6), 10 mM MgCl2, 5 mM dithiothreitol (DTT), 0.1 mM spermidine and 0.1 mM EDTA, for 30 min at 37 °C. The reaction was stopped by the addition of 250 mM EDTA in water (2 μl) and by heating at 65 °C for 10 min. Next, 3 M NaOAc was added to a sample in a 1 : 10 ratio (v/v) and enzyme was extracted by a mixture of phenol–CHCl3–i-AmOH (25 : 24 : 1) (Invitrogen, Canada). The radioactivity of the ethanol-precipitated oligonucleotides was determined by Cherenkov counting using a radioactive detector Tracor Analytic Delta 300 (ThermoQuest/CE Instruments, USA). The error of determination did not surpass 2%.Gel electrophoresis under denaturing conditions
32P-labeled oligonucleotides were dissolved in denaturing loading dye (0.025% bromophenol blue and xylene cyanol in 80% formamide), heated at 80–90 °C for 2 min and loaded onto 20 × 20 × 0.7 cm polyacrylamide gel (PAAG) containing 19% acrylamide, 1% N,N′-methylenebisacrylamide and 7 M urea. 50 mM Tris-HCl (pH 8.3), 50 mM H3BO3, 1 mM EDTA (TBE) was used as an electrode buffer. DNA species were visualized by autoradiography and quantitated using a Molecular Dynamics PhosphorImager SI (Molecular Dynamics, USA), by means of Image Quantum software, version 5.0. The desired oligonucleotide bands were excised from the gel and DNA was eluted by 2 M lithium perchlorate at room temperature for 14 h. DNA was precipitated by the addition of acetone, and the mixture was centrifuged at 14![[thin space (1/6-em)]](https://www.rsc.org/images/entities/char_2009.gif) 000
000![[thin space (1/6-em)]](https://www.rsc.org/images/entities/char_2009.gif) g for 10 min. The supernatant was removed and the residual DNA was washed with acetone and air-dried. Suitable volumes of water were added for further experimentations.
g for 10 min. The supernatant was removed and the residual DNA was washed with acetone and air-dried. Suitable volumes of water were added for further experimentations.
UV-monitored thermal denaturation of DNA duplexes
The thermal denaturation profiles were measured with a Hitachi 150-20 spectrophotometer equipped with a thermoelectrically controlled cell holder in 1 cm path length quartz cuvettes (Hellma, Germany). For melting experiments, the absorbance of samples at 260 nm was measured between 20 and 80 °C; the temperature was increased at a rate of 0.5 °C min−1. The samples containing 2.05–4.4 μM DNA duplexes (Table 1) in 10 mM Tris-HCl (pH 7.6), 10 mM MgCl2 (buffer A) were prepared by combining in a 1 : 1 molar ratio of complementary strands including modified ones. The samples were then heated up to 80–90 °C and slowly cooled to the room temperature.The melting temperature (Tm) of the duplex structure was taken as the temperature corresponding to the maximum on the differential melting curves (dA/dTvs.T). The hypochromic effect of DNA duplex formation (h260) is equal to [(A80 − A20)/A80] × 100%, where A80 and A20 are the absorbance values at 80 and 20 °C, respectively.
Circular dichroism (CD) spectral measurements
CD measurements were performed on a modified computer-driven Dichrograph Jobin Yvon Mark V equipped with a thermostatted cell holder. The cell compartment was continuously purged with dry N2. DNA duplex solutions for CD measurements were prepared in a manner similar to that used for UV-melting experiments. The CD spectra were recorded from 310 to 230 nm at 22 °C and corrected by subtraction of the background scan with buffer A and smoothed by a least-squares polynomial fit up to the third order. Results are the average of three spectra and are presented as Δε, the difference in molar extinction coefficient of left and right circularly polarized light, per mole of base residues.Kinetics of oligonucleotide hydrolysis by snake venom phosphodiesterase
0.08 A260 oligonucleotide containing the 32P-label (80![[thin space (1/6-em)]](https://www.rsc.org/images/entities/char_2009.gif) 000 cpm) at the 5′-end was dissolved in 72 μl of 200 mM Tris-HCl (pH 8.4 at 25 °C), 40 mM MgCl2. Then, 8 μl (3.2 × 10⁻² units in the case of 20-mer DNAs and 0.32 units in the case of 31-mer DNAs) of snake venom phosphodiesterase (Sigma, USA) was added. The reaction mixtures were incubated at 37 °C. Aliquots (10 μl) were quenched by heating (95 °C, 10 min) followed freezing at −20 °C. The products of enzymatic hydrolysis were analyzed by electrophoresis in a 20% denaturing PAAG (see above). The cleavage (%) was evaluated as a ratio of radioactivity of digestion products to the sum of radioactivity of digestion products and uncleaved DNA multiplied by 100%. The initial rates of enzymatic hydrolysis (ν0) were determined graphically from the slope of the starting linear part of the kinetic curves.
000 cpm) at the 5′-end was dissolved in 72 μl of 200 mM Tris-HCl (pH 8.4 at 25 °C), 40 mM MgCl2. Then, 8 μl (3.2 × 10⁻² units in the case of 20-mer DNAs and 0.32 units in the case of 31-mer DNAs) of snake venom phosphodiesterase (Sigma, USA) was added. The reaction mixtures were incubated at 37 °C. Aliquots (10 μl) were quenched by heating (95 °C, 10 min) followed freezing at −20 °C. The products of enzymatic hydrolysis were analyzed by electrophoresis in a 20% denaturing PAAG (see above). The cleavage (%) was evaluated as a ratio of radioactivity of digestion products to the sum of radioactivity of digestion products and uncleaved DNA multiplied by 100%. The initial rates of enzymatic hydrolysis (ν0) were determined graphically from the slope of the starting linear part of the kinetic curves.
DNA hydrolysis by restriction endonucleases
The restriction endonucleases R.MspR9I, R.Bme1390I, R.BstSCI, R.SsoII, R.Psp6I, R.EcoRII, R.MvaI, R.Bst2UI were used in our study. These enzymes recognize the ds sequence 5′-CCWGG-3′ (W = A, T) or 5′-CCNGG-3′ (N = A, T, G, C) and cleave it at different sites under characteristic optimal temperatures (Table 2). As an example, the cleavage of oligonucleotide duplex I (Table 1) by R.MspR9I is shown in Scheme 2.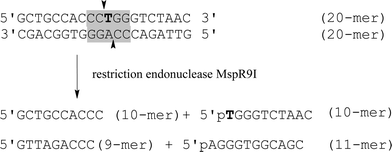 | ||
| Scheme 2 Cleavage of the 20-mer DNA duplex by the restriction endonuclease MspR9I. The enzyme recognition site is indicated by gray and cleavage sites are shown by arrows. The T residue that can be changed for thymidine glycol is in bold. | ||
| Restriction endonuclease | Recognition site (5′–3′/3′–5′) | Incubation temp./°C | Relative rate of hydrolysis | |||
|---|---|---|---|---|---|---|
| Duplex I | Duplex II | |||||
| T-strand | A-strand | Tgl-strand | A-strand | |||
| MspR9I |

|
37 | 100 | 100 | 1 | 3 |
| Bme1390I |

|
37 | 100 | 100 | 1 | 5 |
| MvaI |

|
37 | 100 | 100 | 4 | 12 |
| Bst2UI |

|
60 | 100 | 100 | 9 | 60 |
| BstSCI |

|
55 | 100 | 100 | 70 | 100 |
| SsoII |

|
37 | 100 | 100 | 370 | 130 |
| Psp6I |

|
55 | 100 | 100 | 110 | 85 |
| EcoRII |

|
37 | 100 | 100 | 0 | 0 |
DNA duplexes I and II (350 nM concentration) containing the 32P-label at one of the strands were incubated with enzyme in 80 μl of the corresponding buffer. The incubation conditions were as follows: R.MspR9I (SibEnzyme, Russia, 4 units): 50 mM Tris-HCl (pH 7.6 at 25 °C), 10 mM MgCl2, 100 mM NaCl, 1 mM DTT, 37 °C; R.BstSCI (SibEnzyme, Russia, 6 units): 33 mM Tris-acetate (pH 7.9 at 25 °C), 10 mM magnesium acetate, 66 mM potassium acetate, 1 mM DTT, 55 °C; R.Psp6I (SibEnzyme, Russia, 8 units): 10 mM Tris-HCl (pH 7.6 at 25 °C), 10 mM MgCl2, 1 mM DTT, 55 °C; R.Bst2UI (SibEnzyme, Russia, 80 units): 10 mM Tris-HCl (pH 7.6 at 25 °C), 10 mM MgCl2, 50 mM NaCl, 1 mM DTT, 0.1 mg ml−1 bovine serum albumin (BSA), 60 °C; R.Bme1390I and R.EcoRII (Fermentas, Lithuania, 30 units): 50 mM Tris-HCl (pH 7.5 at 37 °C), 10 mM MgCl2, 100 mM NaCl, 0.1 mg ml−1 BSA, 37 °C; R.MvaI (Fermentas, Lithuania, 8 units): 10 mM Tris-HCl (pH 8.5 at 37 °C), 10 mM MgCl2, 100 mM KCl, 0.1 mg ml−1 BSA, 37 °C; R.SsoII (gift of Dr A. S. Solonin, Russia, 66 nM per monomer): 50 mM Tris-HCl (pH 7.6 at 25°C), 1 mM MgCl2, 50 mM NaCl, 5 mM DTT, 37 °C.
The aliquots were taken from the reaction mixture after certain time intervals (from 1.5 to 20 min). The reaction was stopped by heating of the sample at 95 °C for 5 min. The hydrolysis products were analyzed by electrophoresis in 20% PAAG containing 7 M urea (see above). The cleavage (%) was evaluated for both strands or separately for each strand of 32P-labeled duplexes as a ratio of the radioactivity of digestion products to the sum of the radioactivity of hydrolysis products and uncleaved DNA multiplied by 100. The initial rate of hydrolysis (v0) was determined graphically from the slope of starting linear part of kinetic curve. The calculation was performed for eight values of reaction time. The relative hydrolysis rate was presented as a ratio of ν0 for the modified strand of the DNA duplex to the v0 for the corresponding strand of the unmodified parent duplex multiplied by 100. The measurements were performed at least three times and the mean value was used in further calculations. The standard error of measurements did not surpass 20%.
UV-monitored DNA duplex cleavage by restriction endonucleases
The kinetics of DNA duplex cleavage catalyzed by endonucleases was derived from the rate of UV absorbance change at 260 nm [ΔA260 = A260(with enzyme) − A260(without enzyme)]. UV absorbance was recorded immediately after enzyme addition to the DNA samples that were incubated at 37 °C (R.MspR9I) or 55 °C (R.Psp6I). The optical measurements were performed using a Hitachi 150-20 spectrophotometer equipped with a thermoelectrically controlled cell holder in 1 cm path length quartz cuvettes (Hellma, Germany).Layer deposition of DNA onto acoustic wave devices
For preparation of the ODN layers on the sensor surfaces, we used AT-cut thickness-shear mode (TSM) devices of a fundamental frequency 8 MHz (CH Instruments Inc., USA). Biotinylated ODNs were immobilized to one side of a sensor with a gold electrode in place. The device was first carefully cleaned by sonication under the following conditions: 5 min in acetone, then 5 min in absolute ethanol followed by 5 min sonication in methanol. The crystal was then washed in deionized water and dried in a stream of nitrogen. After cleaning, the sensor was placed into a flow-though cell. The gold electrode of the sensor was flushed with buffer solution (0.5 M NaCl, 10 mM Tris-HCl, 1 mM EDTA, pH 7.6) continuously for 30 min and treated by neutravidin as follows. Neutravidin (Pierce, USA) dissolved in a buffer to a concentration of 0.2 mg ml−1 was allowed to flow into the cell at a flow rate 50 μl/min. After approximately 10 min, the signal reached a steady-state value. Then buffer was allowed to flow at the same rate for 10 min. Subsequently, biotinylated ODN at a concentration 0.5 μM dissolved in buffer was pumped over the device surface until a steady-state signal was obtained. Finally, buffer was flowed for a further 10 min and then ODN with or without thymidine glycol residue dissolved in buffer to a concentration 0.5 μM was swept over the device for the same time period.TSM detection of ODN hybridization
The measured electrical impedance of the sensor is related to the complex acoustic impedance. As a result, the series resonance frequency fs and motional resistance Rm are determined. The values of these parameters reflect the conditions at the interface with respect to mass and interfacial properties.20 In order to study DNA hybridization by means of the TSM method, an 8 MHz AT-cut piezoelectric crystal was incorporated into a flow-through system constructed at the University of Toronto. The cell was previously described in detail.18 A network analyzer (8712ES Network/Spectrum analyzer, Agilent Technology, USA) was used to measure the impedance properties of the sensor. The analyzer measured the complex scattering parameter S11 (reflection magnitude and phase). From S11 the admittance spectra were determined as follows: | (1) |
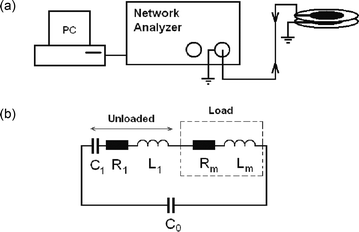 | ||
| Fig. 1 (a) TSM experimental setup,23 and (b) Butterworth van Dyke (BVD) model for the electrical circuit of the quartz crystal transducer.22 | ||
Results and discussion
Thermal stability of DNA duplexes containing thymidine glycol residues
Before UV-melting experiments, the tolerance of modified oligonucleotides to elevated temperatures was studied. For this purpose, water solutions of ODNs were incubated for 2 h at various temperatures: 25, 37, 55, 60 and 75 °C. Quantitative ion-pair HPLC analysis was performed to show that only approximately 10% of oligonucleotides containing oxidative damage are prone to thermal decomposition at 75 °C.Two sets of oligonucleotide duplexes (Table 1) differing in the length [20 base-pairs (bp) in I and II, and 31 bp in III–VI], in the GC-content (65% for 20 bp duplexes and 32% for 31 bp ones) and in the number of thymidine glycol residues (1 or 2) were characterized by their melting behavior in buffer A. UV-melting data presented in Table 1 and Fig. 2 show that the loss of aromaticity in the thymidine glycol residues results in a significant decrease of the DNA duplex stability. The decrease in the Tm value as compared with the undamaged DNA duplex depends on the number of lesions and their location in the double helix, and varies from 8–12 °C for mono-modified duplexes II, IV and V to 23 °C for the double-modified duplex VI (Table 1). These results agree with those reported by Iwai,17 who showed that the introduction of thymidine glycol (5R- or 5S-isomer) into the central part of an 11 bp duplex caused its destabilization by 19 °C. All samples demonstrate a single reversible helix–coil transition. However, the melting transition becomes broader as the thymidine glycol residue replace thymidine in the duplex structure.
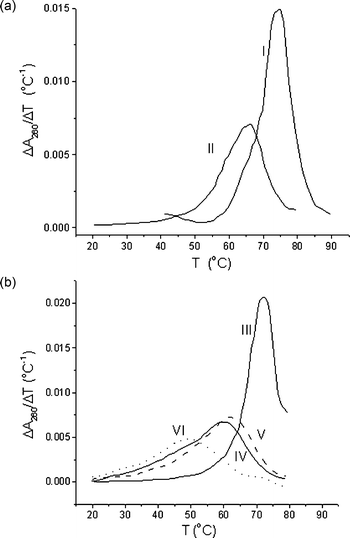 | ||
| Fig. 2 UV melting profiles of DNA duplexes I–VI (Table 1) presented in a differential form. | ||
The oligonucleotide mixtures after the melting procedure were analyzed by ion-pair HPLC in order to assess the integrity of DNA strands. It was shown that even double modification in duplex VI does not induce oligonucleotide decomposition at elevated temperature (data not shown). Thus, the increase in optical density of the DNA duplex solution at 260 nm is associated exclusively with double-helix melting.
Effect of thymidine glycol residues on DNA duplex structure
Both sets of duplex oligonucleotides that contain thymidine glycols in place of T residues (Table 1) were studied by CD to estimate the conformational alterations in the double helix induced by oxidative damage. At the temperature conventionally used in CD experiments (22 °C), all species including modified ones are in duplex form. CD spectra of all double-helical oligonucleotides have a conservative shape with the positive Cotton effect at 260 nm, which is characteristic of the B-type conformation. Nevertheless, the shape of CD curves for 20 and 31 bp duplex sets are clearly different, the distinguishing features being intrinsic in G·C-rich and A·T-rich DNA, respectively (Fig. 3).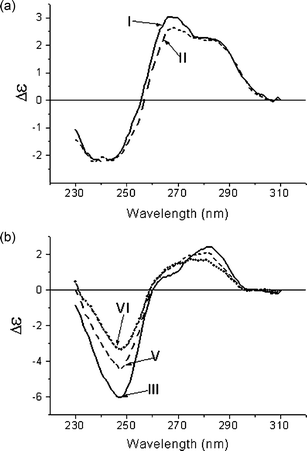 | ||
| Fig. 3 CD spectra of unmodified DNA duplexes (I and III) and DNA duplexes containing one (II, V) or two (VI) thymidine glycol residues in place of T in buffer A at 22 °C. The number of the curve corresponds to the number of the duplex in Table 1. (a) GC-rich, (b) AT-rich DNA duplexes, respectively. | ||
Incorporation of thymidine glycols does not change the spectral shape, but leads to reduced intensity of the positive peak centered at 270 nm for the G·C-rich 20 bp duplex [Fig. 3(a)] or both positive and negative peaks for the A·T-rich 31 bp duplexes [Fig. 3(b)]. The extent of the alterations in the CD intensity depends on the number of thymidine glycol residues in the double-helical DNA. CD spectroscopy data confirm that the modified double helix adopts the B-type conformation, and oxidative damages do not significantly perturb the DNA structure. Base unstacking induced by thymidine glycol residues due to the loss of aromaticity is localized near the modified site.
Effect of thymidine glycol on the snake venom phosphodiesterase- and restriction endonuclease-catalyzed DNA hydrolysis
It is well-known that snake venom phosphodiesterase (SVP) exhibits an exonuclease activity and hydrolyzes the phosphodiester linkages from the 3′-end of the ODN. Here we compare the substrate properties of unmodified 20- and 31-mer oligonucleotides and their analogs containing one thymidine glycol instead of a thymidine residue. A detailed kinetic analysis of SVP-induced DNA hydrolysis showed that the introduction of a damaged base into the oligonucleotide strand slightly decrease (1.2–1.8-fold) the initial rate of enzymatic process if compared with perfect parent DNA duplex.In order to determine whether or not a thymidine glycol incorporated in the duplex structure affects the recognition and cleavage of DNA by restriction endonucleases, we used the following combination of enzymes and DNA substrates. The set of enzymes included R.MspR9I, R.Bme1390I, R.BstSCI, R.SsoII, R.Psp6I, R.EcoRII, R.MvaI, and R.Bst2UI. All of these recognize a ds sequence 5′-CCWGG-3′ (W = A, T) or 5′-CCNGG-3′ (N = A, T, G, C) and differ in the extent of degeneracy at the central position of the recognition site, in the cleavage site and the characteristic optimal temperature (Table 2). Duplexes I and II (Table 1) were designed to contain sequences 5′-CCTGG-3′ and 5′-CCTglGG-3′ respectively, the thymidine glycol residue being located in the central position of the endonuclease recognition site. As shown above, the duplexes I and II are stable at the temperatures below 55 °C, i.e. at optimal temperatures for enzyme functioning; the only exception is R.Bst2UI with a working optimum of 60 °C. In this study, we compared the kinetic parameters of DNA hydrolysis induced by all of the restriction endonucleases under consideration. DNA duplexes which carried a radioactive label either in a strand containing T/Tgl (T- or Tgl-strand) or in a complementary strand with the central A base (A-strand), or in both strands, were incubated with enzymes over a certain period of time (from 1.5 to 20 min). The probes were analyzed by electrophoresis in denaturing PAAG, and the initial rates of DNA hydrolysis (ν0) were determined graphically from the slope of the starting linear part of the kinetic curves (Fig. 4).
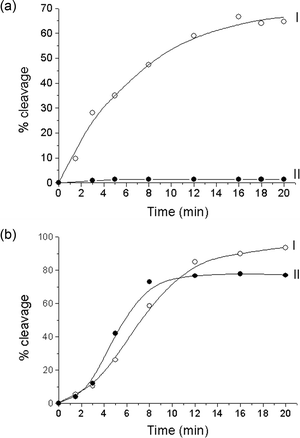 | ||
| Fig. 4 Enzymatic cleavage of DNA duplexes I (○) and II (●) by R.MspR9I (a) and R.Psp6I (b) endonuclease. The 32P-label is in both strands of the DNA duplexes. | ||
A significant decrease in the relative rate of hydrolysis was observed for both strands of modified duplex II as the thymidine glycol in the central position of endonuclease recognition sequence was adjacent to the cleavage site of an enzyme (R.MvaI, R.Bst2UI, R.MspR9I and R.Bme1390I) [Table 2, Fig. 4(a)].
It should be noted that under the conditions of complete hydrolysis of the non-modified duplex I by R.Bst2UI, R.MspR9I and R.Bme1390I, the cleavage degree of duplex II reached 70%. However, hydrolysis of the Tgl strand does not exceed 20% (Fig. 5), thus pointing to the accumulation of a nicked DNA duplex. As the endonuclease cleavage site is separated by several nucleotides from the thymidine glycol position, the relative rate of DNA hydrolysis remains similar to that for the unmodified duplex I (R.BstSCl, R.Psp6I), or even exceeds it (R.SsoII) [Fig. 4(b), Table 2]. Complete inhibition of DNA cleavage was observed for R.EcoRII endonuclease which possesses an unusual mechanism of action and is very sensitive to any modification in the recognition site24,25 (Table 2).
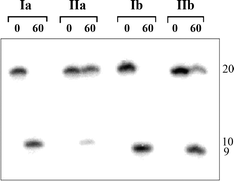 | ||
| Fig. 5 Autoradiogram of the gel-electrophoretic analysis of the reaction mixture after R.Bst2UI (20 units) cleavage of duplexes I and II (350 nM). The 32P-label is in T- or Tgl-strand (a) or in A-strand (b). The reaction time (min) is shown at the top. The length of the oligonucleotides is shown at the right. | ||
Previously, we developed a much more simple and rapid one-step spectrophotometric method for continuous monitoring of oligonucleotide duplex cleavage by restriction endonucleases.26 It does not require the time-consuming gel electrophoresis procedure and radiolabeled ODNs. This approach is based on the finding that the UV absorbance of the reaction mixture increases as a result of duplex fragmentation and dissociation to single-stranded oligonucleotides. The hyperchromic effect depends on the length of the DNA duplex and on the sample temperature. However, in some cases it is difficult to apply a direct spectrophotometric method for the monitoring of DNA enzymatic cleavage, due to the presence of UV-absorbing albumin or inactive enzyme impurities in the restriction endonuclease species. For our study we selected two enzymes (R.MspR9I and R.Psp6I) which are different in optimal temperature and in cleavage site (Table 2).
Kinetic curves of duplexes I and II cleavage by R.MspR9I and R.Psp6I obtained by direct spectrophotometric measurements are presented in Fig. 6. Unmodified duplex I with no enzyme present was used as a negative control. After the addition of R.MspR9I to the reactive mixture, the rise in UV absorbance at 260 nm accompanying the DNA digestion reaction is observed only for duplex I. Duplex II with a thymidine glycol residue located at a cleavage site shows minor UV absorbance changes, which coincide with that of the control [Fig. 6(a)]. This confirms the inhibitory action of thymidine glycol on R.MspR9I activity. In contrast, after the addition of R.Psp6I, the absorbance increases both for DNA duplexes I and II, although the initial rate of oligonucleotide cleavage was lower for modified duplex II. Taken together, these results are in good agreement with data presented above in Table 2 and Fig. 4. The difference in the functioning of restriction endonucleases Psp6I and MspR9I that recognize the similar nucleotide sequence but cleave DNA at distinct sites allows for the use of this enzyme tandem for probing thymidine glycol residues in short DNA fragments by UV spectroscopy.
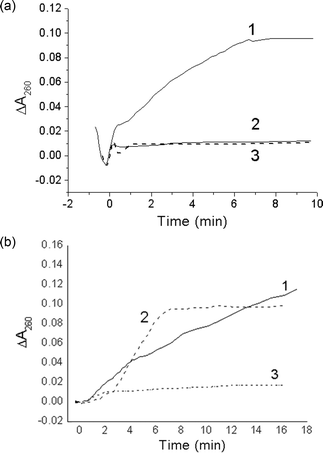 | ||
| Fig. 6 Kinetic curves of absorbance change for the duplexes I (1) and II (2) in the presence of R.MspR9I (a) or R.Psp6I (b) and for the duplex I in the absence of enzyme (3). | ||
Acoustic wave detection of DNA hybridization
In order to obtain further information concerning the hybridization ability of modified ODNs at a surface, we employed the TSM technique in an on-line liquid-phase flow format.18 In this approach, a standing acoustic shear wave is generated piezoelectrically in a quartz wafer with gold electrodes on both faces. The shear wave is reflected at the wafer surface, but a portion of the acoustic energy is transmitted into the liquid at this interface. Adsorption of material to the sensor surface is measured by changes in two parameters: the series resonance frequency (fs) and the motional resistance (Rm). Frequency is a measure of energy storage in the system, and the resistance is a measure of energy dissipation. To a first approximation, changes in fs (Δfs) are governed by adsorption of liquid-phase analytes to the gold surface, and changes in Rm relate to the dissipation of energy within the film or at the interface. It is now widely recognized that for biochemical layers on the sensor surface, other factors come into play, including viscoelastic properties of the film,21,23 acoustic coupling phenomena at the interface,18 and acousto-electric effects.In this work, the attachment of a single-stranded nucleic acid to the sensing surface was effected using the very strong biotin–avidin interaction. In this method, neutravidin is adsorbed onto the surface and biotinylated oligonucleotide is immobilized on the neutravidin surface. This combined structure forms the sensing modality. The target nucleic acid is then introduced, such that adsorption of these molecules to the immobilized structure results in chemical changes that are detected acoustically. Fig. 7(a) shows the changes in Δfs and Rm, following addition of neutravidin (N). A sharp decrease of the resonance frequency and slow increase of the Rm value are observed. Subsequent addition of buffer resulted in a decrease of frequency and in an increase of Rm. This effect is often observed in cases where there are changes in ionic strength and electrolyte composition, although it is not certain that such changes occurred in this case. After approx. 25 min the values of both fs and Rm stabilized. Changes in fs due to addition of neutravidin were Δfs = −195 ± 23 Hz, while Rm increased by 5.5 ± 3.5 Ω, compared to the values before the addition of neutravidin.
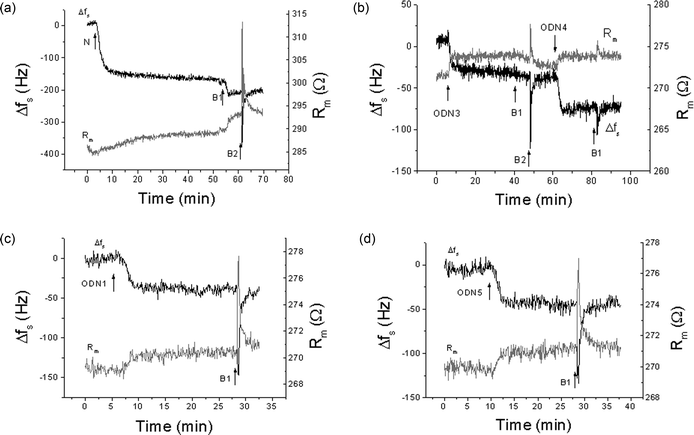 | ||
| Fig. 7 Changes of series resonant frequency, Δfs, and motional resistance, Rm, following the addition of (a) neutravidin (N), (b) ODN3 and following hybridization of complementary ODN4 with ODN3, (c) hybridization of ODN3 with ODN1 containing one thymidine glycol residue; (d) hybridization of ODN3 with ODN5 giving oligonucleotide duplex with non-canonical A·A base-pair. B1, B2 – flow of buffer with rates of 50 and 200 μl min−1, respectively. | ||
The decrease of series resonance frequency following the addition of neutravidin is a well-known phenomenon,27 and is connected with attachment to a gold surface through hydrophobic interactions. In the purely adsorptive limit, the frequency shift is linearly related to the mass per unit area deposition of a film, as given by the Sauerbrey formula,28
 | (2) |
Following the adsorption of neutravidin, fs and Rm were allowed to stabilize. The biotinylated 19-mer ODN3 at 0.5 μM in buffer was then exposed to the sensor surface via the flow cell. Owing to the high affinity of biotin to neutravidin, a strong binding of biotinylated ODN3 to the neutravidin molecules takes place. This results in a decrease of frequency and a sharp increase of Rm [Fig. 7(b)]. Flow of the buffer resulted in a further decrease of the frequency and also decreases of Rm. This type of behavior is common, and is likely due to further reorganization and ordering of the ODN on the surface when exposed to the buffer. The steady-state values of the changes of resonance frequency and motional resistance were −37.3 ± 6.8 Hz and 1.1 ± 0.6 Ω, respectively. This value of Rm was only slightly higher than those for the crystal covered by the neutravidin layer prior to the addition of the biotinylated ODN3, although it did undergo a considerable initial change before settling to the steady-state value. This may be a further indication of the substantial structural changes in the ODN3 layer, which agrees well with previously published results.19
To obtain an estimate for the concentration of bound ODN3 on the neutravidin-modified surface, we observe that Δfs and ΔRm for ODN3 adsorption are approximately one-fifth of that of the neutravidin adsorption. We also note that the molecular weight of ODN3 is about one-tenth of that of neutravidin. It is then reasonable to infer that two ODN3 molecules bind to each immobilized neutravidin molecule. Neutravidin has four biotin binding sites, although two of these are blocked due to adsorption on the gold surface, so the 2 : 1 binding ratio is a reasonable assumption here, which would indicate a surface concentration for ODN3 of 2–4 pmol cm−2. It is important to note that the small size and relative linearity of the ODN3 molecules allows it to form a relatively close-packed layer on the neutravidin surface. Larger, kinked molecules would not bind in this close-packed fashion, due to steric repulsions.
Injection of complementary ODN4 resulted in a further decrease of the resonant frequency and an increase of motional resistance: −36.5 ± 1.5 Hz and 1.15 ± 0.08 Ω, respectively [Fig. 7(b)]. These changes are similar to those obtained when biotinylated ODN3 was introduced to the crystal surface. This suggests that the ODN4 is likely binding to the complementary ODN3 strand in close to a 1 : 1 ratio, since the molecular weights of the two strands are similar. Fig. 7(c) shows the kinetics of Δfs and Rm changes that occur following interaction of ODN1, containing a single thymidine glycol residue, with the sensor surface coated with biotinylated ODN3. This interaction resulted in a similar decrease in resonant frequency and an increase in motional resistance, although Δfs was slightly smaller and ΔRm slightly larger than for hybridization of the undamaged complementary strand ODN3. The actual values were Δfs = −33 ± 2 Hz and Rm = 1.4 ± 0.2 Ω, which are not significantly different from the undamaged strands. Hybridization of ODN5 with ODN3, which leads to a non-canonical A·A base-pair [Fig. 7(d)], resulted in changes in Δfs and Rm of −40 ± 4 Hz and Rm = 1.6 ± 0.6 Ω, higher than the complementary strands. These shifts are actually higher than the complementary binding results. One possible interpretation is that more ODN5 is binding to the ODN3. It is more likely that the non-complementary A·A base-pair leads to a kinked conformation, which could increase the interfacial viscosity or alter the interfacial coupling in some way.20 However, the changes of resonant frequency and motional resistance obtained for both the ODN1–ODN3 and ODN5–ODN3 systems [Fig. 7(c,d)] did not differ statistically from those obtained for hybridization of fully complementary ODN4 and ODN3 strands.
On the other hand, the kinetics of hybridization between immobilized ODN3 and ODN1 containing one thymidine glycol residue were slower than the other two systems. The slower kinetics were also found for hybridization of ODN3 with ODN2, which contained two thymidine glycol residues. To characterize the rate of hybridization, we introduce the value Rh = dfs/dt. This value represents the slope of the changes of series resonant frequency due to the hybridization process at the crystal surface. Table 3 summarizes the values of Rh as well as Δfs and Rm obtained for the various systems studied. The hybridization rate of the ODN3 with ODN1 containing the thymidine glycol residue is lower by a factor of approximately 1.9 as compared to that for fully complementary ODN3 and ODN4. Similar results were also observed for the system containing two thymidine glycol residues (ODN3–ODN2) (Table 3). In contrast, the hybridization rate of fully complementary oligonucleotides is similar to that for ODN3–ODN5 hybridization, which involves A·A formation. We suspect that these results could reflect the difference in binding affinity of the thymidine glycol to adenine base, compared to the stable thymidine–adenine interaction (see Scheme 1). However, further experimental studies or molecular dynamics simulations would be required to elucidate the physical mechanisms of these phenomena.
| Abbreviation | DNA duplexes (5′–3′/3′–5′) | Δfs ± s.d./Hz | ΔRm ± s.d./Ω | R h ± s.d./Hz s−1 |
|---|---|---|---|---|
| a The differences between these results are statistically significant according to the Student's t-test with p < 0.05. | ||||
| ODN3–ODN4 |

|
−36.5 ± 1.5 | 1.2 ± 0.1 | −0.27 ± 0.02a |
| ODN3–ODN1 |

|
−33.0 ± 2.0 | 1.4 ± 0.2 | −0.14 ± 0.09a |
| ODN3–ODN2 |

|
−38.9 ± 3.6 | 1.2 ± 0.1 | −0.15 ± 0.03a |
| ODN3–ODN5 |

|
−40.0 ± 3.5 | 1.6 ± 0.6 | −0.28 ± 0.02 |
Our results indicate that the thymidine glycol residue incorporated in ODN does not significantly affect the changes of the series resonant frequency and motional resistance, although there are discernible differences in signal between the various systems. The results are in agreement with earlier reported data on the properties of oligonucleotides containing abasic sites, demonstrating that this tool is well-suited to nucleic acid biosensing. Significant effects on the resonant frequency and motional resistance have been observed for ODN with three abasic sites, the presence of which induces a strong destabilization of the DNA duplex structure.19
In summary, the acoustic biosensing results suggest that one or two thymidine glycol residues in a single-stranded DNA suppress its hybridization at surfaces. We can speculate that the appearance of the hydrophilic thymidine glycol causes the conformational rearrangements of modified ODN2 in an electrolyte, thus restricting the rate of the hybridization at the device–liquid interface. It is encouraging that both the UV-melting data and the acoustic results can be used to detect the presence and extent of DNA duplex damage, and that such damage can be equally detected in solution and at surfaces. While further study is required to optimize these techniques, they both show great promise for the future of DNA damage monitoring, both in experimental and clinical diagnostic capacities.
Conclusions
The various mechanisms that contribute to DNA damage have attracted considerable attention in recent years, particularly those caused by environmental factors. We have examined the role played by chemically-altered residues on the structure of the affected nucleic acid. A key factor in this respect is the appearance of the modified base, thymidine glycol, in the nucleic acid sequence. To study the properties of chemically-damaged DNA, we have presented a thermodynamic approach in solution and at the solid–liquid interface using acoustic wave detection. From our results, we have seen that the presence of an oxidized thymidine residue dramatically changes the thermodynamic properties and local structure of the double helix, in most cases leading to a decrease in the rate of digestion of the nucleic acid by restriction endonucleases and exonuclease snake venom phosphodiesterase.An interesting observation with respect to the kinetics was observed from acoustic wave measurements associated with the hybridization of ODN containing one or two thymidine glycol residues with a single-strand oligonucleotide immobilized on the device surface. The rate of hybridization for ODN containing thymidine glycol residues was approximately two times slower than for the comparative experiment conducted with fully complementary strands. The diminished hybridization capacity of modified ODNs is very likely caused by appearance of two hydroxyl groups and the loss of aromaticity in thymidine glycol residues. Acoustic physics has proven to be extremely useful in detecting conformational effects in biochemical species,29 and the result described here represents another example of the usefulness of this technique.
Acknowledgements
The authors are grateful for support provided by the NATO SfP Program (Project No. SfP-978003), the Slovak Grant Agency (Project No. 1/4016/07), and Russian Foundation of Basic Research (grants 06-04-49196, 06-04-49204). M. T. acknowledges the contribution of the Natural Sciences and Engineering Research Council of Canada. Thanks are also due to Dr A. S. Solonin, Skryabin Institute of Biochemistry and Physiology of Microorganisms, Russian Academy of Sciences, for the kind gift of SsoII restriction endonuclease.References
- B. Alberts, D. Bray, A. Johnson, J. Lewis, M. Raff, K. Roberts and P. Walter, Essential Cell Biology, Garland Publishing. Inc, New York, 1998 Search PubMed.
- K. Frenkel, M. S. Goldstein and G. W. Teebor, Biochemistry, 1981, 20, 7566 CrossRef CAS.
- G. Teebor, A. Cummings, K. Frenkel, A. Shaw, L. Voituriez and J. Cadet, Free Radical Res. Commun., 1987, 2, 303 CAS.
- R. Adelman, R. L. Saul and B. N. Ames, Proc. Natl. Acad. Sci. U. S. A., 1988, 85, 2706 CrossRef CAS.
- J. Y. Kao, I. Goljer, T. A. Phan and P. H. Bolton, J. Biol. Chem., 1993, 268, 17787 CAS.
- O. D. Scharer, Angew. Chem., Int. Ed., 2003, 42, 2946 CrossRef.
- H. Ide, Y. W. Kow and S. S. Wallace, Nucleic Acids Res., 1985, 13, 8035 CrossRef CAS.
- J. M. Clark and G. P. Beardsley, Nucleic Acids Res., 1986, 14, 737 CrossRef CAS.
- Y. W. Kow and S. S. Wallace, Biochemistry, 1987, 26, 8200 CrossRef CAS.
- V. Bailly and W. G. Verly, Biochem. J., 1987, 242, 565 CAS.
- H. Miller, A. S. Fermandes, E. Zaika, M. M. McTigue, M. C. Torres, M. Wente, C. R. Iden and A. P. Grollman, Nucleic Acids Res., 2004, 32, 338 CrossRef CAS.
- M. K. Shingenaga and B. N. Ames, Free Radical Biol. Med., 1991, 10, 211 CrossRef CAS.
- X. C. Le, J. Z. Xing, J. Lee, S. A. Leadon and M. Weinfeld, Science, 1998, 280, 1066 CrossRef CAS.
- J. F. Rusing, in Electrochemistry of Nucleic Acids and Proteins, ed. E. Paleček, F. Scheller and J. Wang, Elsevier, Amsterdam, 2005, vol. 1, pp. 433–450 Search PubMed.
- M. Fojta, in Electrochemistry of Nucleic Acids and Proteins, ed. E. Paleček, F. Scheller and J. Wang, Elsevier, Amsterdam, 2005, vol. 1, pp. 386–431 Search PubMed.
- A. M. O. Brett, J. A. P. Piedade and S. H. P. Serrano, Electroanalysis, 2000, 12, 969 CrossRef.
- S. Iwai, Chem.–Eur. J., 2001, 7, 4343 CrossRef CAS.
- B. A. Cavic, G. L. Hayward and M. Thompson, Analyst, 1999, 124, 1405 RSC.
- T. Hianik, X. Wang, S. Andreev, N. Dolinnaya, T. Oretskaya and M. Thompson, Analyst, 2006, 131, 1161 RSC.
- J. S. Ellis and M. Thompson, Phys. Chem. Chem. Phys., 2004, 6, 4928 RSC.
- S. J. Martin, V. E. Grandstaff and G. C. Frye, Anal. Chem., 1991, 62, 2272 CrossRef.
- A. F. Holloway, A. Nabok, M. Thompson, A. K. Ray, D. Crowther and J. Siddiqi, Sensors, 2003, 3, 187 CAS.
- D. S. Balantine, R. M. White, S. J. Martin, A. J. Ricco, E. T. Zellers, G. C. Frye and H. Wohlthen, in Acoustic Wave Sensors, ed. R. Stern and M. Levy, Academic Press, San Diego, 1997, pp. 331–395 Search PubMed.
- M. Reuter, M. Mücke and D. H. Krüger, Nucleic Acids Mol. Biol., 2004, 14, 261 Search PubMed.
- E. S. Gromova, E. A. Kubareva, M. N. Vinogradova, T. S. Oretskaya and Z. A. Shabarova, J. Mol. Recognit., 1991, 4, 133 CrossRef CAS.
- O. V. Petrauskene, E. A. Kubareva and E. S. Gromova, Mol. Biol. (Moscow), 1991, 25, 1424 Search PubMed.
- M. Tassew and M. Thompson, Anal. Chem., 2002, 74, 5313 CrossRef CAS.
- G. Sauerbrey, Z. Phys., 1959, 155, 206 Search PubMed.
- X. Wang, J. S. Ellis, E.-L. Lyle, P. Sundaram and M. Thompson, Mol. BioSyst., 2006, 2, 184 RSC.
| This journal is © The Royal Society of Chemistry 2009 |


