Paired emitter–detector diode detection with dual wavelength monitoring for enhanced sensitivity to transition metals in ion chromatography with post-column reaction
Martina O'
Toole
a,
Leon
Barron
b,
Roderick
Shepherd
c,
Brett
Paull
b,
Pavel
Nesterenko
b and
Dermot
Diamond
*a
aAdaptive Sensors Group, National Centre for Sensor Research, School of Chemical Sciences, Dublin City University, Dublin 9, Ireland. E-mail: dermot.diamond@dcu.ie; Fax: +353 1 7007995; Tel: +353 1 7005404
bSeparation Science Cluster, National Centre for Sensor Research, School of Chemical Sciences, Dublin City University, Dublin 9, Ireland
cIntelligent Polymer Research Institute, University of Wollongong, Wollongong, NSW 2522, Australia
First published on 5th November 2008
Abstract
The combination of post-column derivatisation and visible detection are regularly employed in ion chromatography (IC) to detect poorly absorbing species. Although this mode is often highly sensitive, one disadvantage is the increase in repeating baseline artifacts associated with out-of-sync pumping systems. The work presented here will demonstrate the use of a second generation design paired emitter–detector diode (PEDD-II) detection mode offering enhanced sensitivity to transition metals in IC by markedly reducing this problem and also by improving signal noise. First generation designs demonstrated the use of a single integrated PEDD detector cell as a simple, small (15 × 5 mm), highly sensitive, low cost photometric detector for the detection of metals in IC. The basic principle of this detection mode lies in the employment of two linear light emitting diodes (LEDs), one operating in normal mode as a light source and the other in reverse bias serving as a light detector. The second generation PEDD-II design showed increased sensitivity for Mn(II)- and Co(II)-2-(pyridylazo)resorcinol (PAR) complexes as a result of two simultaneously acquiring detection cells – one analytical PEDD cell and one reference PEDD cell. Therefore, the PEDD-II employs two wavelengths whereby one monitors the analyte reaction product and the second monitors a wavelength close to the isosbestic point. The optimum LED wavelength to be used for the analytical cell was investigated to maximise peak response. The fabrication process for both the analytical and reference PEDD cells was validated by determining the reproducibility of detectors within a batch. The reproducibility and sensitivity of the PEDD-II detector was then investigated using signals obtained from both intra- and inter-day chromatograms.
1. Introduction
A common method employed in liquid chromatography (LC) to improve sensitivity and selectivity is the use of post-column derivatisation.1,2 Although widely used in certain liquid chromatography applications, post-column reactions (PCR) do possess some disadvantages such as the increased cost and complexity due to the requirement of an additional pump. An additional disadvantage is the increase in baseline noise. This can be accounted for due to (A) mixing noise arising from imperfect mixing of the eluent and the PCR reagent,3 (B) cell noise due to the background eluent flowing through the detector, which (in the absence of analyte) produces a finite detector signal and (C) any variations in the mixing profiles of the PCR reagent and eluent which will cause baseline noise in the detector.4 These factors adversely affect the limit of detection (LOD) as it is typically calculated as three times the standard deviation of the baseline noise.5To improve limit of detection values two approaches can be adopted. The first is to increase the absorbance detected by the analyte of interest, which will result in an increase in the peak height achieved. The second approach is to reduce the baseline noise.
The first approach can be achieved by optimising the wavelength at which the analyte is monitored. UV-vis spectral array detectors are the most commonly employed detection method in laboratory-based separation systems; however, they are typically not the detection method of choice in microfluidic separation systems. The small dimensions of microchip separation channels pose a severe problem for sensitive and reliable absorbance measurements. The optical pathlength represented by the channel depth is generally shorter than 30 µm.6 Light emitting diodes (LEDs) have become increasingly popular as light sources in separation systems7–10 due to their advantageous characteristics such as low power consumption, low cost, increasing spectral range coverage (247–1550 nm11,12), size, intensity and efficiency.13–15 Previously we demonstrated the use of a paired emitter–detector diode (PEDD) system as a highly sensitive photometric detector in liquid chromatography.7 The PEDD employs two LEDs, whereby one serves as the light source and the second LED in reverse bias mode is employed as the light detector. Instead of measuring the photocurrent directly, a simple timer circuit is used to measure the time taken for the photocurrent generated by the emitter LED to discharge the detector LED from 5 V (logic 1) to 1.7 V (logic 0) to give digital output directly without using an A/D converter or operation amplifier. This method achieves excellent sensitivity in comparison to (A) a variable wavelength detector typically employed in liquid chromatography7 and (B) the more commonly employed method of coupling an LED to a photodiode.16 When employing an LED as the light source in a photometric detector it is imperative that an LED of narrow bandwidth with an emission λmax close to the analyte absorbance λmax is selected to obtain maximum absorbance.
The reduction of baseline noise can be achieved by employing a number of approaches, for example, using pulseless flow for post-column reagent delivery (i.e. a pressurized reagent reservoir). The method undertaken within the work presented here to reduce baseline noise employed a dual wavelength monitoring procedure. This procedure has been successfully employed more commonly in flow injection analysis (FIA) applications. A difference in refractive index (RI) between the sample and the carrier is common, which can lead to an artifact in the absorbance signal often referred to as the Schlieren effect.17 An additional problem with detection in FIA occurs when samples have any degree of turbidity. Hooley and Dessy proposed the use of an LED combined with a beam splitter and two photodiodes for the correction of drift from the light source.18 Alternatively, the use of two LEDs first introduced by Worsfold et al. in 198719 allows for the correction of colour change, RI or turbidity.17,20–23
In 2000, Jones applied the method of dual wavelength monitoring to improve sensitivity in ion chromatography employing post-column reactions.24 He achieved a 17-fold improvement in the signal-to-noise ratios calculated for the detection of seven transition metals. This was achieved by monitoring at two wavelengths simultaneously using a spectral array detector. The first wavelength selected was the λmax of the analyte, while the second was selected at a wavelength close to the isosbestic point. Employing simple post-run processing to manipulate the data the pump noise was subtracted from the analyte baseline, allowing an improved LOD.
The work presented here will demonstrate improved LOD of transition metals in ion chromatography than previously achieved,7 by optimising the wavelength of the emitter LED and by employing the PEDD-II detector to reduce baseline noise introduced by post-column reactions.
2. Experimental
2.1 Chemicals and reagents
All chemicals were of reagent grade. The post-column reagent employed for the detection of the transition metal ions consisted of a mixture of 0.4 mM 4-(2-pyridylazo)resorcinol monosodium salt hydrate (PAR) (Sigma Aldrich, Dublin, Ireland) and 0.5 M ammonia (35%, BDH, Poole, England), which was adjusted to pH 10.5. Manganese chloride tetrahydrate and cobalt nitrate hexahydrate (Sigma Aldrich, Dublin, Ireland) were used and stock solutions were prepared to a concentration of 1000 mg L−1. Standards were prepared daily from the 1000 mg L−1 stock solutions. The mobile phase, stock solutions and standard solutions were prepared using water from a Millipore Milli-Q water purification system. All samples were vacuum filtered through a 0.45 µm filter (Nylaflo®, VWR International, Meath, Ireland) and degassed by sonication. The mobile phase used was 3 mM nitric acid (70%, East Anglia Chemicals, Suffolk, England).2.2 Equipment
The system was set up as previously described,7 employing a Hewlett Packard series 1050 HPLC system (Agilent Technologies., Dublin) to deliver the eluent at a flow rate of 0.7 mL min−1. The chromatograms obtained from the UV-vis spectrophotometric detector were analysed using Agilent Chemstation for LC and LC/MS systems software. Samples were injected using an automated injector with a sample loop of 100 µL. All separations were carried out on a Nucleosil 100-7 column covalently functionalised with IDA groups of 4 × 14 mm in size (particle size 7 µm).25 A Gilson (MiniPuls 3) peristaltic pump (Anachem, UK), set at a flow rate setting of 0.38 mL min−1, was used for the introduction of the post-column reagent (PCR), which was mixed at room temperature with the eluent using a 0.5 m PEEK (polyether ether ketone) reaction coil (0.25 mm i.d., VICI® AG International, Switzerland).2.3 Fabrication and operation of the PEDD and PEDD-II flow cell detectors
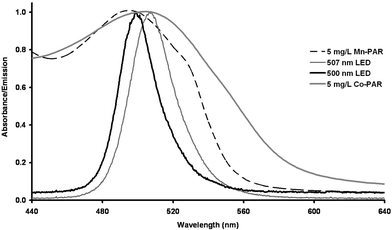 | ||
| Fig. 1 Emission spectra (λmax 500 nm (bold line) and λmax 507 nm (thin solid line)) of the emitter LEDs used in the integrated PEDD flow analysis device and the absorption spectra (λmax 500 nm) of 5 mg L−1Mn-PAR (dashed line) and (λmax 510 nm) 5 mg L−1Co-PAR (bold grey line). | ||
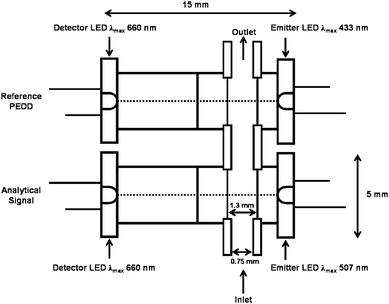 | ||
| Fig. 2 Schematic of the integrated dual wavelength PEDD-II flow analysis device used for colorimetric detection. | ||
Both the PEDD and PEDD-II flow cells were operated as described in previous work.26 A 9 V battery was used as the power source to drive the circuitry from which a voltage regulator was used to control the voltage supply to the LEDs. The light detector LED in input mode was charged up to 5 V for 100 µs and then switched to output mode. Photons from the emitter LED generate a photocurrent in the reverse biased detector LED. The detector LED does not measure the photocurrent generated directly but instead the time taken for this photocurrent to discharge the detector LED charge from the initial value of 5 V (logic 1) to a preset value of 1.7 V (logic 0) is measured with a simple threshold detection and timer circuit.26,29 This method achieves excellent sensitivity with the added benefit of eliminating the need for an A/D converter or operational amplifier. The data were captured using HyperTerminal software (Microsoft Inc., USA), saved as a text file and then analysed using Excel.
The chromatograms obtained from the variable wavelength spectrophotometric detector were analysed using Agilent Chemstation software.
3. Results and discussion
3.1 Optimisation of the PEDD monitoring at the analyte wavelength
The optimum wavelengths to monitor transition metal-PAR complexes have been variously reported in the literature, typically citing the λmax in the range of ca. 495–520 nm.24,25,30,31 Previously the detection of transition metal complexes were obtained using a PEDD with a λmax of 500 nm.7 Under the optimised experimental conditions previously determined the absorbance spectra of 5 mg L−1Mn(II)- and Co(II)-PAR complexes were acquired using the µQuant™ platewell reader (Bio-Tek Instruments, Inc., USA). The λmax values of 500 and 510 nm were obtained for 5 mg L−1Mn(II)- and Co(II)-PAR complexes respectively (Fig. 1). To determine if improved analyte response with respect to that previously reported could be obtained, a PEDD with a reported λmax of 507 nm was investigated. A 0.25 mg L−1 mixture of Mn(II) and Co(II) was prepared and injected (n = 10). The mean peak height data (change in discharge time, µs) calculated for Mn(II)- and Co(II)-PAR complexes from both PEDDs (λmax 500 and 507 nm) are shown in Table 1.| 507 nm peak height/µs | 500 nm peak height/µs | |||
|---|---|---|---|---|
| 0.25 mg L−1 | Mn-PAR | Co-PAR | Mn-PAR | Co-PAR |
| Average (n = 10) | 898 | 375 | 405 | 114 |
| Std dev (n = 10) | 31 | 14 | 5 | 3 |
| RSD% | 4 | 4 | 1 | 3 |
As shown in Table 1 the average peak height obtained employing the (λmax 507 nm) PEDD for 0.25 mg L−1Mn(II)- and Co(II)-PAR complexes were, respectively, 2.2 and 3.3 times greater than that measured with the (λmax 500 nm) PEDD. To prove experimentally that the PEDD with a λmax of 507 nm was the optimum wavelength for the detection of Mn(II)- and Co(II)-PAR complexes due to the efficient overlap of the emission and absorption spectra and not due merely to an improvement in the fabrication of the PEDD, four PEDDs of each wavelength were prepared. A mixture of 0.25 mg L−1Mn and Co was injected onto the column (n = 10) and were monitored with (A) four individual (λmax 500 nm) PEDDs, (B) four individual (λmax 507 nm) PEDDs and (C) a variable wavelength detector (VWD) (500 nm). The 0.25 mg L−1Mn and Co mixture was injected ten times for each PEDD. The results shown in Table 2 were obtained by calculating the average peak heights (change in discharge time, µs) from the ten injections for each (λmax 500 nm) PEDD. An overall average for the four (λmax 500 nm) PEDDs was then calculated. This was repeated for the four (λmax 507 nm) PEDDs investigated. The average peak heights (change in discharge time, µs) measured using the (λmax 507 nm) PEDDs (Fig. 3) for 0.25 mg L−1Mn(II)- and Co(II)-PAR complexes are approximately twice those of the average peak heights measured using the (λmax 500 nm) PEDDs.
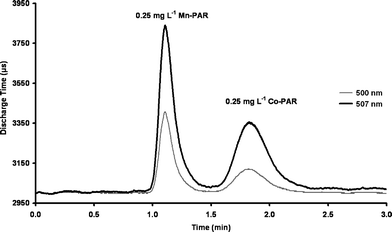 | ||
| Fig. 3 Comparison of average traces for the detection of 0.25 mg L−1Mn-PAR and Co-PAR using (A) 4 × (λmax 507 nm) PEDDs (bold line) and (B) 4 × (λmax 500 nm) PEDDs (grey line). Each trace is an average of ten injections. | ||
The average peak heights measured for 0.25 mg L−1Mn(II)- and Co(II)-PAR complexes using the VWD (λmax 500 nm) as outlined in Table 2 had a RSD of 3.7 and 6.1% respectively. The reproducibility of the peak heights achieved for the metal complexes using the four individual (λmax 500 nm) PEDDs and the four individual (λmax 507 nm) PEDDs calculated a highest RSD of 4.8%.
The same VWD at the same wavelength was employed throughout the experiments. The results shown in Table 2 demonstrate that the PEDD can be fabricated reproducibly, providing a reliable response over a long period of time (three months). This is of utmost importance if the PEDD is to be a viable detector in field deployable systems and sensor networks.
3.2 Intra-/inter-day reproducibility of the PEDD flow cell
Reproducibility is an important characteristic for a field deployable device. To demonstrate the intra- and inter-day reproducibility within an individual PEDD flow cell a mixture of 0.25 mg L−1Mn(II) and Co(II) was injected on the column. The separation was monitored using a PEDD (λmax 507 nm) and a VWD (500 nm) for comparison. The same PEDD was used for all experiments to determine the reproducibility within an individual PEDD.| n = 10 | PEDD (λmax 500 nm) | VWD (500 nm) | ||
|---|---|---|---|---|
| 0.25 mg L−1 | Mn-PAR | Co-PAR | Mn-PAR | Co-PAR |
| Inter-day reproducibility | ||||
| Peak height/µs | 786 ± 13 | 337 ± 3 | 1303 ± 20 | 441 ± 9 |
| RSD% | 2 | 1 | 2 | 2 |
| Baseline noise (σ)/µs | 2 | 2 | 6 | 6 |
| S/N | 401 | 172 | 217 | 73 |
| Intra-day reproducibility | ||||
| Peak height/µs | 868 ± 13 | 378 ± 11 | 1256 ± 46 | 425 ± 9 |
| RSD% | 2 | 3 | 4 | 2 |
| Baseline noise (σ)/µs | 2 | 2 | 6 | 6 |
| S/N | 434 | 189 | 209 | 71 |
The peak height (change in discharge time, µs) measured using the (λmax 507 nm) PEDD demonstrated relative standard deviations of 1.5 and 2.8% for 0.25 mg L−1Mn(II)- and Co(II)-PAR complexes (n = 3) respectively. The PEDD flow cell achieved intra-/inter-day reproducibility comparable to values obtained from a variable wavelength detector highlighting its suitability as a potential detector in a miniaturised field deployable chromatography system.
3.3 PEDD-II (dual wavelength monitoring)
As shown in Fig. 4A for the detection of 7.5 µg L−1Mn(II)- and Co(II)-PAR complexes the reference PEDD (λmax 433 nm) monitors the baseline noise only and does not detect the transition metal-PAR complexes. Fig. 4B shows the average (n = 3) plot measured (post-data analysis) for the detection of 7.5 µg L−1Mn(II)- and Co(II)-PAR complexes using the dual wavelength PEDD-II (λmax 507–433 nm). The average peak height data (change in discharge time, µs) calculated for both the Mn(II)- and Co(II)-PAR complexes were 9.8 µs ± 0.2 µs and 6.1 µs ± 1.0 µs. The average standard deviation (3σ) of the baseline calculated was 2.6 µs (n = 3). Signal-to-noise ratios of 11.5 and 7.2 were achieved for Mn(II)- and Co(II)-PAR complexes respectively. This showed an increase of 55% in the signal-to-noise ratio calculated for the detection of Mn-PAR and a 72% increase for the detection of Co-PAR in comparison with the data calculated using the single PEDD (λmax 507 nm) as outlined in Table 4.
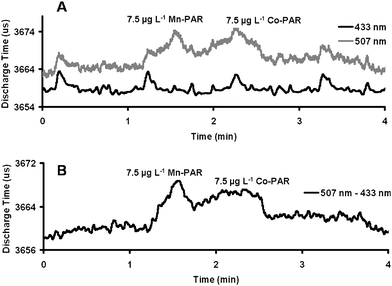 | ||
| Fig. 4 Comparison data acquired from (A) the PEDD-II (analyte PEDD (λmax 507 nm, grey line) and reference PEDD (λmax 433 nm, bold line)) and (B) post-data analysis for the detection of 7.5 µg L−1Mn(II)- and Co(II)-PAR complexes. | ||
Employing the dual wavelength monitoring procedure obtained an overall 42% reduction in the standard deviation of the baseline. As shown in Table 4 the VWD could not detect 7.5 µg L−1Co-PAR. In addition to this the signal calculated for 7.5 µg L−1Mn-PAR employing the VWD could reliably be detected. The peak height was calculated as 6.8 µs ± 0.5 µs; however, the average baseline standard deviation (3σ) was determined to be 6.2 µs ± 0.2 µs. The signal-to-noise ratio calculated using the PEDD-II for the detection of 7.5 µg L−1Mn-PAR in comparison to the VWD demonstrated an approximate 250% increase.
The limits of detection (LOD) calculated for the detection of Mn(II)- and Co(II)-PAR complexes using the (λmax 500 nm) PEDD, (λmax 507 nm) PEDD and the dual PEDD (λmax 507–433 nm) are summarised in Table 5. The LODs obtained employing the dual wavelength PEDD-II as shown in Fig. 5 were ca. 5 and 2 times lower than the LODs calculated for both Mn(II)- and Co(II)-PAR complexes using the single wavelength (λmax 500 nm) PEDD as previously reported.7
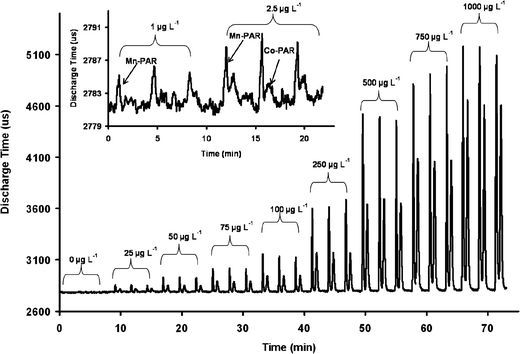 | ||
| Fig. 5 Replicate injections of transition metals Mn(II) and Co(II) detected employing the PEDD-II (λmax 507–433 nm) at (A) varying concentrations (25–1000 µg L−1) and (B) LODs of 1 and 2.5 µg L−1 for Mn(II)- and Co(II)-PAR complexes respectively. | ||
4. Conclusions
The results obtained using the integrated single and dual wavelength PEDD-II flow cell have demonstrated improved sensitivity, selectivity and signal-to-noise ratios than previously reported for the detection of transition metals Mn(II) and Co(II) coupled with the post-column reagent PAR. This was achieved through two approaches. Firstly by optimising the wavelength in which to monitor the transition metal-PAR complexes and secondly by employing the PEDD-II which employs a dual wavelength monitoring procedure. Intra- and inter-day reproducibility within an individual single wavelength (λmax 507 nm) PEDD were comparable to the relative standard deviations calculated using the VWD for the detection of 0.25 mg L−1Mn(II)- and Co(II)-PAR complexes.Often when attempting to miniaturise components of analytical instruments, such as the detector there is a loss in sensitivity. The single wavelength (λmax 507 nm) PEDD flow cell, however, can detect lower concentration levels of Mn(II)- and Co(II)-PAR complexes than that of an expensive, commercially available bench top instrument. The employment of a dual wavelength monitoring PEDD-II (λmax 507–433 nm) for the detection of transition metal-PAR complexes enhanced sensitivity further obtaining LODs of 1.0 and 2.5 µg L−1 for the detection of Mn(II)- and Co(II)-PAR complexes respectively. Employing the dual wavelength monitoring procedure obtained an overall 42% reduction in the standard deviation of the baseline. The results presented within in this work show huge potential for the use of a dual wavelength PEDD-II for the purpose of improving the limit of detection by reducing baseline noise in post-column reaction systems.
This optical detector has the potential for very broad analytical applications, given that it offers high sensitivity and precision with excellent signal-to-noise characteristics. The PEDD flow cell offers significant advantages as a potential absorbance detector in a miniaturised field deployable low pressure ion chromatography system. The optical detector cannot replace a standard UV-vis spectrophotometer; however, it offers many advantages such as its low cost, versatility, simplicity, ease of use, low power consuming, small size and can be easily integrated into a field deployable liquid chromatography system.
Acknowledgements
The Authors wish to thank Science Foundation Ireland SFI for grant support under the Adaptive Information Cluster Award (SFI 03/IN3/1361).References
- U. A. T. Brinkman, Chromatographia, 1987, 24, 190–200 CAS
.
- P. K. Dasgupta, J. Chromatogr. Sci., 1989, 27, 422–448 CAS
.
- R. M. Cassidy, S. Elchuk and P. K. Dasgupta, Anal. Chem., 1987, 59, 85–90 CrossRef CAS
.
-
P. R. Haddad, P. E. Jackson and Ion Chromatography – Principles and Applications, Elsevier, Amsterdam, 1990 Search PubMed
.
-
H. Small, Ion Chromatography, Plenum Press, New York and London, 1989 Search PubMed
.
- S. Götz and U. Karst, Anal. Bioanal. Chem., 2007, 387, 183–192 CAS
.
- M. O'Toole, K. T. Lau, B. Schazmann, R. Shepherd, P. N. Nesterenko, B. Paull and D. Diamond, Analyst, 2006, 131, 938–943 RSC
.
- L. Barron, P. N. Nesterenko, D. Diamond, M. O'Toole, K. T. Lau and B. Paull, Anal. Chim. Acta, 2006, 577, 32–37 CrossRef CAS
.
- M. King, B. Paull, P. R. Haddad and M. Macka, Analyst, 2002, 127, 1564–1567 RSC
.
- Q. Lu and G. E. Collins, Analyst, 2001, 126, 429–432 RSC
.
- http://www.roithner-laser.com/ (accessed 24 October 2008).
- http://www.s-et.com/ (accessed 24 October 2008).
- P. K. Dasgupta, I. Y. Eom, K. J. Morris and J. Li, Anal. Chim. Acta, 2003, 500, 337–364 CrossRef CAS
.
- P. K. Dasgupta, H. S. Bellamy, H. Liu, J. L. Lopez, E. L. Loree, K. Morris, K. Petersen and K. A. Mir, Talanta, 1993, 40, 53–74 CrossRef CAS
.
- M. O'Toole and D. Diamond, Sensors, 2008, 8, 2453–2479
.
- M. O'Toole, K. T. Lau, R. Shepherd, C. Slater and D. Diamond, Anal. Chim. Acta, 2007, 597, 290–294 CrossRef CAS
.
- H. Liu and P. K. Dasgupta, Anal. Chim. Acta, 1994, 289, 347–353 CrossRef CAS
.
- D. J. Hooley and R. E. Dessy, Anal. Chem., 1983, 55, 313–320 CAS
.
- P. J. Worsfold, J. R. Clinch and H. Casey, Anal. Chim. Acta, 1987, 197, 43–50 CrossRef CAS
.
- J. Huang, H. Liu, A. Tan, J. Xu and X. Zhao, Talanta, 1992, 39, 589–592 CrossRef
.
- E. A. G. Zagatto, M. A. Z. Arruda, A. O. Jacintho and I. L. Mattos, Anal. Chim. Acta, 1990, 234, 153–160 CrossRef CAS
.
- A. Suzuki, J. Kondoh, Y. Matsui, S. Shiokawa and K. Suzuki, Sens. Actuators, B, 2005, 106, 383–387 CrossRef
.
- I.-Y. Eom and P. K. Dasgupta, Talanta, 2006, 69, 906–913 CrossRef CAS
.
- P. Jones, Analyst, 2000, 125, 803–806 RSC
.
- E. Sugrue, P. Nesterenko and B. Paull, J. Sep. Sci., 2004, 27, 921–930 CrossRef CAS
.
- M. O'Toole, K. T. Lau and D. Diamond, Talanta, 2005, 66, 1340–1344 CrossRef CAS
.
-
O. Geschke, H. Klank, P. Tellemann, Microsystem Engineering of Lab-on-a-chip Devices, WILEY-VCH, Weinheim, 2004 Search PubMed
.
-
M. O'Toole, R. Shepherd, K. T. Lau and D. Diamond, in SPIE Optics East 2007, held Boston, MA, USA, 2007, pp. 67550P67551–67550P67510 Search PubMed
.
- K. T. Lau, S. Baldwin, R. L. Shepherd, P. H. Dietz, W. S. Yerazunis and D. Diamond, Talanta, 2004, 63, 167–173 CrossRef CAS
.
- P. Nesterenko and P. Jones, J. Chromatogr., A, 1997, 770, 129–135 CrossRef CAS
.
- E. Sugrue, P. Nesterenko and B. Paull, Anal. Chim. Acta, 2005, 553, 27–35 CrossRef CAS
.
| This journal is © The Royal Society of Chemistry 2009 |
