Enhanced specificity and efficiency of polymerase chain reactions using poly(amidoamine) dendrimers and derivatives
Xueyan
Cao
a,
Xiangyang
Shi
*b,
Wenchao
Yang
a,
Xiaodong
Zhang
*a,
Chunhai
Fan
c and
Jun
Hu
ac
aNanobiology Laboratory, Bio-X Life Science Research Center, College of Life Science and Biotechnology, Shanghai JiaoTong University, Shanghai, 200240, P. R. China. E-mail: xdzhang@sjtu.edu.cn
bCollege of Chemistry, Chemical Engineering, and Biotechnology, Donghua University, Shanghai, 201620, P. R. China. E-mail: xshi@dhu.edu.cn
cShanghai Institute of Applied Physics, Chinese Academy of Sciences, P.O. Box 800-204, Shanghai, 201800, P. R. China
First published on 18th October 2008
Abstract
The polymerase chain reaction (PCR) has become a fundamental technique in molecular biology. Improvements to enhance the specificity and efficiency of PCR are always required and remain a great challenge. Here we introduce generation 4 (G4) and 5 (G5) poly(amidoamine) (PAMAM) dendrimers and their derivatives with different terminal groups as a novel class of enhancers to improve the specificity and efficiency of PCR. We show that the dendrimers are effective in optimizing error-prone two-round PCR and non-specific PCR in specificity and efficiency. With the increase of the number and density of terminal amine groups, the optimum concentration of polycationic dendrimers could be decreased to as low as 1.35 nM, which is four orders of magnitude smaller than that of fully acetylated dendrimers and carboxyl-terminated dendrimers. The present study underlines a fact that dendrimers could be used as a powerful additive to enhance the specificity and efficiency of PCR.
Introduction
The polymerase chain reaction (PCR) has become one of the most popular techniques in modern biological and medical sciences.1 Enough amounts of DNA samples could be amplified in one tube by PCR for analysis from one hair, one drop of blood, even one cell. This remarkable amplification ability is important in many circumstances, such as early stage diagnosis of HIV or cancer. However, the specificity of PCR does not always match its unparalleled sensitivity.2,3 It is well known that even with sophisticated optimization, PCR specificity is not always satisfactory.1,4 Due to the fact that the PCR mechanism is rather complicated, certain interference effects would be unavoidable in actual practices. The improvement of the PCR amplification specificity is not only determined by the optimized design of the primer sequence, but also dependent on the optimization of the reaction system and procedure. It is proven that by adding additives, such as nanogold,5 formamide,6 tetramethylammonium (TMA) chloride7 and its derivatives,8 and betaine,9,10etc. into the reaction mixture, some non-specific amplification problems could be solved to certain extent. However, finding new additives to enhance the specificity and efficiency of PCR is still valuable and remains a great challenge.Dendrimers are a novel class of highly branched, monodispersed, and synthetic macromolecules with well-defined structure and properties. A typical dendrimer molecule, which is very different from conventional linear polymers, consists of a central core, branched units, and terminal groups.11 Their peculiar structure makes dendrimers potentially suitable for a variety of applications. Dendrimers have been explored as light harvesting agents,12 chemical sensors,13 catalysts,14 drug delivery platforms,15 gene transfer agents,16 and contrast imaging agents,17etc.
In this present study, we explore a new application of dendrimers as a specificity and efficiency enhancer in PCR. Two test systems including an error-prone two-round PCR5 and a non-specific amplification system8 were employed in this study. We investigated the following additives: amine-terminated generation 4 (G4.NH2) and generation 5 (G5.NH2) poly(amidoamine) (PAMAM) dendrimers, G5 dendrimer derivatives with defined amine or carboxylic acid terminal groups, and other general PCR enhancers (formamide, DMSO, TMA chloride and betaine), which were used as controls. We found that in the presence of dendrimers with appropriate concentrations, PCR amplification can be optimized to enhance both specificity and efficiency. To our knowledge, this is the first report regarding the use of dendrimers as additives for enhancing the specificity and efficiency of PCR.
Experimental
PCR additives
Amine-terminated G4 PAMAM dendrimer (G4.NH2) was purchased from Sigma (catalog number: 41,244-9). Amine-terminated G5 PAMAM dendrimer (G5.NH2) was purchased from Dendritech (Midland, MI). G5 PAMAM dendrimers with defined acetylation (G5.25Ac, G5.50Ac, G5.75Ac and G5.100Ac) and carboxylation (G5.25SA, G5.50SA, G5.75SA and G5.100SA) degrees were synthesized and characterized in the previous work.18 The structures of the dendrimer additives were schematically illustrated in Fig. 1. Formamide, DMSO, TMA chloride and betaine were purchased from Sigma.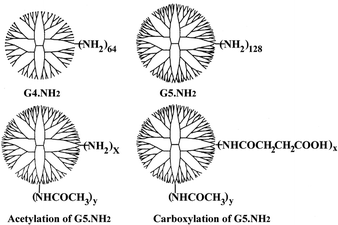 | ||
| Fig. 1 The schematic representation of the structures of G4.NH2, G5.NH2, and their derivatives with defined acetylation and carboxylation degrees. | ||
Error-prone two-round PCR test system
The error-prone two-round PCR was similar to the model described in our previous work.5 Briefly, in the first round PCR, 283-bp target DNA segment was amplified from λDNA template (TaKaRa Bio. Inc.) by using one pair of primers with high specificity. Then the 1000-fold diluted 283-bp PCR products of the first round were used as the template in the second round PCR, and amplified by the same primers. The sequences of the primers were as follows: primer 1: 5′- GGCTTCGGTCCCTTCTGT-3′, and primer 2: 5′-CACCACCTGTTCAAACTCTGC-3′. Amplification reactions were carried out under the following conditions: 10 mM Tris-HCl pH 8.8, 50 mM KCl, 1.5 mM MgCl2, 0.2 µM primers (Shanghai Sangon Biological Engineering & Technology and Service Co. Ltd.), 0.25 mM each dNTP (TaKaRa Bio. Inc.), 0.025 U/µL Ex Taq DNA polymerase (TaKaRa Bio. Inc.). The PCR protocol was: 2 min at 95 °C for pre-denaturation, followed by 35 cycles of: 20 s at 94 °C, 30 s at 55 °C, and 30 s at 72 °C. Then cycling was terminated after 5-min incubation at 72 °C. Sterilized deionized water was obtained from Milli Q instrument with resistivity higher than 18.2 MΩ cm. Amplifications were carried out in ABI 9600 PCR machine (Application Biosystems, USA).To evaluate the effect of the dendrimers on the PCR at low annealing temperature, we also performed the amplification in the annealing temperatures of 40 °C, 35 °C, 30 °C, and 25 °C, respectively.
Non-specific amplification test system
The non-specific amplification test system was similar to the one described in literature,8 wherein Thy-1 gene segment was amplified from 50 ng genomic DNA template isolated from rat tail (Beijing biodev-tech. scientific & technical Co. Ltd.). The sequences of the primers for rat Thy-1 gene were as follows: primer 3: 5′- ATGAACCCAGTCATCAGCA-3′, and primer 4: 5′-ATAGTTTTATTGGAGCTTGT -3′. The PCR conditions were similar to those mentioned above except that 0.05 U/µL Ex Taq DNA polymerase was added into the mixture. The PCR protocol was: 1 min at 94 °C for pre-denaturation, followed by 30 cycles of: 15 s at 94 °C, 15 s at 49 °C, and 30 s at 72 °C. Then cycling was terminated after incubation at 72 °C for 1 min. PCR for the rat Thy-1 gene were also conducted on ABI 9600 PCR machine.Evaluation methods of PCR
Amplification products were analyzed by 1% agarose gel electrophoresis in which 5 µL reaction products were loaded with 1 µL loading buffer. Gels were stained with ethidium bromide, visualized on a UV transilluminator, and documented by photography. All the products of PCR were analyzed by sequencing after purification in order to determine the fidelity of PCR.The effectiveness of various additives was described through the assignment of two densitometric quantities, termed specificity and efficiency, to each additive. From agarose gel electrophoresis image, the specificity of an additive at a particular concentration is defined as the ratio of the volume of the target band to the total volume of all bands, including undesired nonspecific bands, expressed as a percentage. The efficiency of an additive is defined as a ratio of the densitometric value of the target DNA band determined after PCR to one band (500 bp) of DL2000 DNA marker, which is assigned to a value of 1.0. Serial concentrations of each additive were added into the reaction, and the concentration of each additive that helped the PCR produce the most specific and the brightest target band (maximal efficiency) on the gel was selected as the optimum concentration of this additive.
Results and discussion
The effects of additives on error-prone two-round PCR test system
The two-round PCR system5 works on the similar principle as the nested PCR. However, due to the use of the same primers, even though the specific band was observed in the first round (Fig. 2, Lanes 1 and 2), the second round PCR always failed to amplify any meaningful band, showing “error-prone” phenomenon including broad molecular size distribution or smear in agarose gel electrophoresis (Fig. 2, Lanes 3 and 4). Those “error-prone” non-specific amplifications could not be improved only by optimizing the annealing temperature or the concentration of Mg2+ ions. So it is an appropriate model to detect if the additives could improve the specificity of DNA amplification.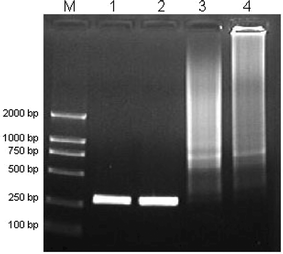 | ||
| Fig. 2 The results of the first-round PCR and two-round PCR amplification. Lane M is for marker. Lane 1, 2 show the results of the first round PCR; Lane 3, 4 show the results of the two-round PCR. | ||
Various additives (see Table 1) were tested in this two-round PCR system. Four kinds of small molecular compounds: formamide, DMSO, TMA chloride and betaine were tested for comparison. These small molecules were considered to be conventional enhancer in PCR.6,7,9,19 For each additive, serial concentrations were added into the reaction mixture to optimize the enhancing effect.
| Additives | Average practical terminal groups per molecule18 | Optimum concentrations | Maximal Efficiency | Maximal specificity | |
|---|---|---|---|---|---|
| a Theoretical amine terminal group. | |||||
| Dendrimers with amine terminal groups | G4.NH2 | 64a | 2.53 nM | 2.88 | 0.96 |
| G5.NH2 | 110 | 1.35 nM | 2.64 | 1.0 | |
| G5.25Ac | 89 | 1.44 nM | 2.64 | 1.0 | |
| G5.50Ac | 61 | 5.37 nM | 3.46 | 1.0 | |
| G5.75Ac | 39 | 6.02 nM | 2.04 | 1.0 | |
| G5.100Ac | 6 | 28.4 µM | 2.05 | 0.92 | |
| Dendrimers with carboxylic acid terminal groups | G5.25SA | 45 | 48.6 µM | 2.74 | 1.0 |
| G5.50SA | 67 | 68.3 µM | 4.74 | 1.0 | |
| G5.75SA | 90 | 42.6 µM | 4.67 | 0.96 | |
| G5.100SA | 110 | 62.0 µM | 4.64 | 1.0 | |
| Formamide | — | 2.4% | 2.35 | 1.0 | |
| TMA chloride | — | 60 mM | 2.41 | 1.0 | |
| DMSO | — | 10.4% | 1.59 | 0.57 | |
| Betaine | — | 2.0 M | 2.80 | 1.0 | |
Figs. 3, 4, and 5 show the electropherograms of PCR containing dendrimers with different generations, different percentages of -NH2 terminal groups, and different percentages of carboxylic acid terminal groups, respectively. For a comparison, Fig. 6 shows the results of PCR containing control additives. It is clear that nearly all the additives improve the specificity of two-round PCR except DMSO. The specificity and efficiency of each additive was calculated by semi-quantitative analysis (Table 1). We found that some of the dendrimers additives such as G4.NH2, G5.50Ac, G5.50SA, G5.75SA and G5.100SA exhibit better performance than the conventional additives of formamide, TMA chloride and betiane (Table 1). In addition, the optimum concentrations could be significantly different when the dendrimers with different terminal groups were used. The optimum concentrations of the dendrimers with amine terminal groups were nearly four orders of magnitude smaller than those of fully acetylated dendrimers and dendrimers with carboxylic acid terminal groups. For example, the optimum concentrations of G5.50Ac (practically 61 -NH2 terminal groups per dendrimer molecule) and G5.50SA (practically 67 -COOH terminal groups per dendrimer molecule) were 5.37 nM and 68.3 µM, respectively. For G5 dendrimers, with the increase of acetylation degree, the optimum concentration of dendrimers tends to increase, which is presumably due to the decreased number of amine terminal groups. Similarly, the optimum concentration of G4.NH2 (2.53 nM) is much higher than that of G5.NH2 (1.35 nM) due to the increased density and number of terminal amine groups for G5 dendrimers (Fig 4e). This implies that the number and density of dendrimer terminal amine groups play an important role in enhancing the specificity and efficiency of the PCR (vide infra). However, there is no correlation between the optimum concentrations of the carboxyl-terminated G5 dendrimers and the number of their carboxyl termini (Fig. 5e).
 | ||
| Fig. 3 The effects of G4.NH2 and G5.NH2 on the specificity of PCR. Lane M in every image is for marker. (a) G4.NH2 was added into PCR mixture, and for lane 1 to lane 5 its final concentration was 0, 1.41, 1.97, 2.53, 2.81 nM, respectively. (b) G5.NH2 was added into PCR mixture, and for lane 1 to lane 5 its final concentration was 0, 1.0, 1.25, 1.35, 1.49 nM, respectively. Lane 6 in (a) and (b) were negative control. | ||
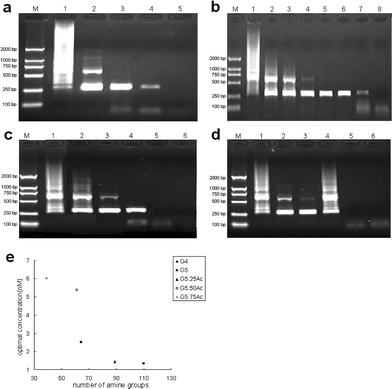 | ||
| Fig. 4 The effect of acelylated G5 dendrimers on the specificity of PCR. Lane M in every image is for marker. (a) G5.25Ac was added into PCR mixture, and for lane 1 to lane 5 its final concentration was 0, 0.41, 1.44, 1.66, 1.86 nM, respectively. (b) G5.50Ac was added into PCR mixture, and for lane 1 to lane 8 its final concentration was 0.83, 2.48, 4.13, 4.95, 5.37, 5.80, 6.61, 7.43 nM, respectively. (c) G5.75Ac was added into PCR mixture, and for lane 1 to lane 5 its final concentration was 2.74, 4.10, 6.02, 6.84, 8.21 nM, respectively. (d) G5.100Ac was added into PCR mixture, and for lane 1 to lane 6 its final concentration was 0, 25.82, 28.40, 32.27, 34.85, 38.72 µM, respectively. Lane 6 in (c) was negative control. (e) Optimum concentrations determined by densitometric analysis of the data in Fig. 4 and Fig. 5(a) ∼ (c), as a function of the number of amine terminal groups of acelylated G5 dendrimers. | ||
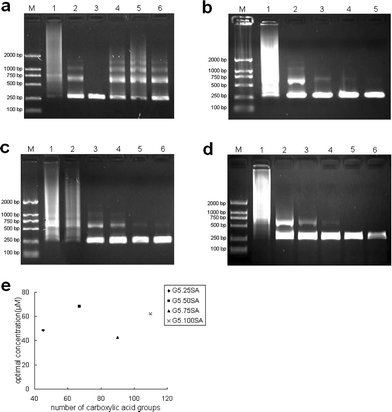 | ||
| Fig. 5 The effect of G5.SA on the specificity of PCR. Lane M in every image is for marker. (a) G5.25SA was added into PCR mixture, and for lane 1 to lane 6 its final concentration was 34.03, 43.76, 48.62, 51.05, 53.48, 58.34 µM, respectively. (b) G5.50SA was added into PCR mixture, and for lane 1 to lane 5 its final concentration was 0, 6.21, 37.28, 55.92, 68.35 µM, respectively. (c) G5.75SA was added into PCR mixture, and for lane 1 to lane 5 its final concentration was 0, 5.37, 11.26, 22.52, 40.58, 42.60 µM, respectively. (d) G5.100SA was added into PCR mixture, and for lane 1 to lane 6 its final concentration was 0, 5.16, 36.12, 46.44, 63.08, 97.52 µM, respectively. Lane 7 in (d) was negative control. (e) Optimum concentrations determined by densitometric analysis of the data in (a) ∼ (d), as a function of the number of carboxyl terminal groups of carboxylated G5 dendrimer. | ||
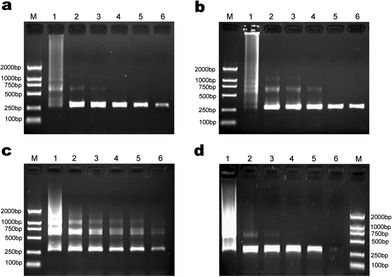 | ||
| Fig. 6 The effect of other additives on the efficiency and specificity of PCR. Lane M in every image is for marker. (a) Formamide was added into PCR mixture, and for lane 1 to lane 6 its final concentration was 0, 1.6%, 2.0%, 2.4%, 4.0%, 4.8%, respectively. (b) TMA chloride was added into PCR mixture, and for lane 1 to lane 6 its final concentration was 0, 8.0%, 8.8%, 9.6%, 10.4%, 11.2%, respectively. (c) DMSO was added into PCR mixture, and for lane 1 to lane 6 its final concentration was 0, 30, 40, 50, 60, 65 mM, respectively. (d) Betaine was added into PCR mixture, and for lane 1 to lane 6 its final concentration was 0, 0.5, 1.0, 2.0, 2.5, 3.0 M, respectively. | ||
According to Figs. 3, 4 and 5, we found some common features shared by all the additives of dendrimers: (1) With the increase of the additives’ concentration, target DNA 283-bp band is getting more and more distinct and those non-specific bands or smear tailed bands become weaker and weaker and eventually nearly peter out; (2) within their optimum concentrations, all kinds of dendrimers were found to be able to optimize PCR with respect to both high specificity and high efficiency; and (3) excess additive seems to decease the yield of target band to some extent or inhibit PCR completely. This phenomenon was similar to other conventional PCR additives.
It is interesting to note that for G5.100Ac and G5.25SA samples, non-specific amplification returns back when the concentrations of these two additives slightly exceed the optimum concentration (Fig. 4d, Lane 4 and Fig. 5a, Lane 4). In contrast, in this case other dendrimers display inhibition effect on PCR.
To evaluate if dendrimers could improve the efficiency and/or specificity of PCR at low annealing temperatures, we tested four annealing temperatures including 40 °C, 35 °C, 30 °C, and 25 °C. As shown in Fig. 7, in the presence of 6.02 nM G5.75Ac, we could obtain a single target band at non-optimal annealing temperatures of 40 °C, 35 °C, 30 °C, and 25 °C. In sharp contrast, in the absence of additives normal PCR often produces negligible amplified target DNA at these temperatures.
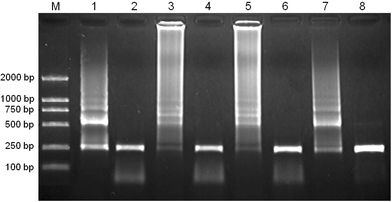 | ||
| Fig. 7 The effect of the annealing temperature on the specificity of PCR. Lane M is for marker. Lane 1, 2:40 °C; Lane 3, 4:35 °C; Lane 5, 6:30 °C; Lane 7, 8:25 °C; Lane 1, 3, 5 and 7 show the results of PCR performed in the absence of additive; Lane 2, 4, 6 and 8 show the results of PCR performed in the presence of G5.75Ac (6.02 nM). | ||
The effects of additives on non-specific amplification test system
In order to further generalize our findings, a 1026-bp segment of the Thy-1 gene was amplified from genomic DNA template isolated from rat tail. It is clear to see that there are two visible bright bands and small smear in the images of agarose gel in the absence of additives (Lane 1 of Fig 8a, 8b, 8c). These positive controls are different than those described in literature,8 where at least 6 bands were amplified. We believe that the difference lies in the type of polymerase used. In this non-specific amplification test system, two dendrimer additives with amine or carboxylic acid terminal groups that performed best in their classes in error-prone two-round PCR: G5.50Ac, G5.50SA were chosen to add into the PCR mixture while formamide was used as a control. The results are illustrated in Fig. 8 and Table 2. It is clear that all three additives exhibit enhanced specificity, and G5.50Ac exhibits marked efficiency (1.8 times as effective as formamide). The optimum concentrations of G5.50Ac and G5.50SA are 68.6 nM and 68.3 µM, respectively, with three orders of magnitude difference between them. All the single bands optimized by additives were sequenced and the alignment of rat Thy-1 gene was carried out. A few mutations were found as expected.| Additives | Optimum concentrations | Maximal efficiency | Maximal specificity |
|---|---|---|---|
| Formamide | 0.8% | 0.52 | 1.0 |
| G5.50Ac | 68.6 nM | 0.91 | 1.0 |
| G5.50SA | 68.3 µM | 0.52 | 1.0 |
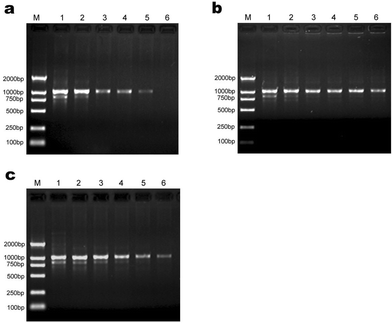 | ||
| Fig. 8 The effect of the tested additives on the efficiency and specificity of PCR amplification of Thy-1. Lane M in every image is for marker. (a) Formamide was added into PCR mixture, and for lane 1 to lane 6 its final concentration was 0, 0.4%, 0.8%, 1.2%, 1.6%, 2.4%, respectively. (b) G5.50Ac was added into PCR mixture, and for lane 1 to lane 6 its final concentration was 0, 34.3, 54.9, 68.6, 82.3, 96.1nM, respectively. (c) G5.50SA was added into PCR mixture, and for lane 1 to lane 6 its final concentration was 0, 31.1, 43.5, 55.9, 68.3, 80.8 µM, respectively. | ||
Analysis of the possible mechanism
The most important result in this study is the identification of novel PCR additives that have potential abilities in enhancing specificity and efficiency of PCR amplification. However, the molecular mechanism of the enhancing effect of these dendrimers on PCR is currently unknown.Formamide, TMA chloride and betaine are well-known enhancer of PCR amplification. It had been supposed that formamide exerted its effect by binding in the major and minor grooves of DNA and destabilizing the template double-helix.20 Rees et al. proposed that betaine could eliminate the dependence of dsDNA melting on the base pair composition,10 thereby decreasing the non-specificity amplification. In addition, TMA chloride may affect the thermal stability of the base pair and reduce the secondary structure of oligonucleotide primers so that it could help primers to bind to the DNA template more efficiently.7 Compared with these conventional PCR enhancers, dendrimers are a unique class of synthetic, highly branched, nearly spherical and symmetrical macromolecules with many functional terminal groups, which are responsible for high solubility and reactivity. It is expected that dendrimers may play a different role in terms of enhancing the specificity and efficiency of PCR from those small molecule enhancers mentioned above.
In our study, the dendrimers we tested are divided into two subclasses: the polycationic dendrimers (G4.NH2, G5.NH2 and acetylated G5 PAMAMs), and the polyanionic dendrimers (carboxylated G5 PAMAMs). A number of literature reports show that dendrimers can effectively interact with DNA21,22 or proteins23,24 to form stable complexes in certain conditions. Bielinska et al studied the DNA/dendrimers complexes and found that the binding of DNA to polycationic dendrimers appeared to alter the structure of DNA.21 Accordingly, the interaction between polycationic dendrimers and DNA might destabilize the double-strand structure of DNA, leading to a more correct pairing of primers to templates and consequently a more specific and efficient amplification. In this case, more amine groups per dendrimer molecule would produce stronger interaction with DNA, and would require less amount of dendrimer for optimizing PCR (Table 1). The enhancing effect of polyanionic carboxyl-terminated dendrimers is rather interesting. It is generally believed that polyanionic dendrimers could not form complexes with DNA because of the electrostatic repellency between their negative charges. Literature data show that substitutions of the surface amine groups with sugars, peptides, hydroxyl groups or acrylic acid inhibit DNA binding in a manner proportional to the degree of substitution.21 However, the carboxyl-terminated dendrimer may also serve as a scaffold to condense the concentrations of a variety of PCR components, similar to polycationic dendrimers (see below). It is reasonable to conclude that the interaction between polyanionic dendrimers and DNA is much weaker than that between polycationic dendrimers and DNA. Therefore, the enhancing effect of polyanionic dendrimers is weaker than that of polycationic dendrimers, and the optimum concentration of polyanionic dendrimers in optimizing PCR is required to be much higher.
On the other hand, the interaction between dendrimers and protein may also significantly affect the results of amplification. Klajnert et al demonstrated that both polycationic and polyanionic dendrimers could interact with BSA,23 while the interaction with polycationic dendrimers was much stronger.
The PCR system includes many kinds of molecules such as dsDNA template, polymerase, dNTP, ssDNA primers etc. It is anticipated that dendrimers added in the PCR system could interact with dsDNA template, ssDNA primers, and protein (such as polymerase) in parallel. The dendrimers could greatly condense the concentrations of a variety of PCR components locally, thereby significantly increasing the possibility of amplification reaction (Scheme 1). The interaction of PCR components with polycationic dendrimers is very different than that with polyanionic dendrimers, leading to a different enhancing capability in terms of PCR specificity and efficiency. The optimum concentrations of polycationic dendrimers are distinctly smaller than those of polyanionic dendrimers. Given the complexity of the interaction of dendrimers with PCR components, it is still not clear to understand the return-back effect of G5.100Ac and G5.25SA (Fig. 4d, Lane 4 and Fig. 5a, Lane 4) on PCR. We think that the detailed mechanisms of dendrimers on enhancing PCR specificity and efficiency must be very complex. Further mechanistic studies using dendrimers with other different terminal groups are going on in order to achieve a complete understanding.
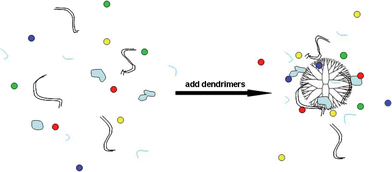 | ||
| Scheme 1 Schematic illustration of the interaction between PCR mixture and dendrimer. Red, yellow, green, blue dots: 4 kinds of dNTP; light blue pieces: polymerase; short, single line: primers; long, double line: template. | ||
Conclusions
In summary, we have used G4 and G5 PAMAM dendrimers and derivatives as additives to enhance the specificity and efficiency of PCR amplification. Our results show that nearly all of the tested dendrimers and derivatives are effective in the improvement of PCR performance at their optimal concentrations. With the increase of the number and density of terminal amine groups, the optimum concentration of polycationic dendrimers could be decreased to as low as 1.35 nM, which is four orders of magnitude smaller than that of fully acetylated dendrimers and carboxyl-terminated dendrimers. The current study suggests a novel application of dendrimers to impove the PCR technology, which is very important in the field of molecular biology and medicine.Acknowledgements
This work was supported by the National Natural Science Foundation of China (10674147), the Committee of Science and Technology of Shanghai (0652nm006, 0752nm021), and National Basic Research Program of China (973 Program 2007CB936000, 2006CB933000). X. S. thanks the support from the Program for Professor of Special Appointment (Eastern Scholar) at Shanghai Institutions of Higher Learning.References
- C. W. Dieffenbach and G. S. Dveksler, PCR Primer: A Laboratory Manual, Cold Spring Harbor Laboratory Press, New York, NY, 1995 Search PubMed.
- R. K. Agarwal and A. Perl, Nucleic Acids Res., 1993, 21, 5283–5284 CrossRef CAS.
- Q. Chou, M. Russell, D. E. Birch, J. Raymond and W. Bloch, Nucleic Acids Res., 1992, 20, 1717–1723 CrossRef CAS.
- K. H. Roux, PCR Methods Appl., 1995, 4, 185–194 Search PubMed.
- H. K. Li, J. H. Huang, J. H. Lv, H. J. An, X. D. Zhang, Z. Z. Zhang, C. H. Fan and J. Hu, Angew Chem Int Ed Engl., 2005, 44, 5100–5103 CrossRef CAS.
- G. Sarkar, S. Kapelner and S. S. Sommer, Nucleic Acids Res., 1990, 18, 7465 CAS.
- E Chevet, G. Lemaître and M. D. Katinka, Nucleic Acids Res., 1995, 23, 3343–3344 CrossRef CAS.
- M Kovárová and P. Dráber, Nucleic Acids Res., 2000, 28, e70 CrossRef CAS.
- N. Baskaran, R. P. Kandpal, A. K. Bhargava, M. W. Glynn, A. Bale and S. M. Weissman, Genome Research, 1996, 6, 633–638 CrossRef CAS.
- W. A. Rees, T. D. Yager, J. Korte and P. H. von Hippel, Biochemistry, 1993, 32, 137–144 CrossRef CAS.
- D. A. Tomalia, H. Baker, J. Dewald, M. Hall, G. Kallbs, S. Martin, J. Roeck, J. Ryder and P. Smith, Macromolecules, 1986, 19, 2466–2468 CrossRef.
- U Hahn, M. Gorka, F. Vögtle, V. Vicinelli, P. Ceroni, M. Maestri and V. Balzani, Angew. Chem. Int. Edn., 2002, 41, 3595–3598 CrossRef CAS.
- C. Kim, E. Park, C. K. Song and B. W. Koo, Synth. Met., 2001, 123, 493–496 CrossRef CAS.
- R. W. Scott, O. M. Wilson and R. M. Crooks, J. Phys. Chem. B, 2005, 109, 692–704 CrossRef CAS.
- R. Esfand and D. A. Tomalia, Drug Discov. Today, 2001, 6, 427–436 CrossRef CAS.
- J. D Eichman, A. U. Bielinska, J. F. Kukowska-Latallo and J. R. Baker Jr, Pharm. Sci. Technol. Today., 2000, 3, 232–245 CrossRef CAS.
- H. Kobayashi, S. Kawamoto, T. Saga, N. Sato, A. Hiraga, T. Ishimori, Y. Akita, M. H. Mamede, J. Konishi, K. Togashi and M. W. Brechbiel, Magn. Reson. Med., 2001, 46, 795–802 CrossRef CAS.
- X. Y. Shi, I. Bányai, K. Rodriguez, M. T. Islam, W. Lesniak, P. Balogh, L. P. Balogh and J. R. Baker Jr., Electrophoresis, 2006, 27, 1758–1767 CrossRef CAS.
- J. Kang, M. S. Lee and D. G. Gorenstein, J Biochem Biophys Methods, 2005, 64, 147–151 CrossRef CAS; J. Kang, M. S. Lee and D. G. Gorenstein, J Biochem Biophys Methods, 2005, 64, 147–151 CrossRef CAS.
- K. Varadaraj and D. M. Skinner, Gene, 1994, 140, 1–5 CrossRef CAS.
- A. U. Bielinska, J. F. Kukowska-Latallo and J. R. Baker Jr., Biochim Biophys Acta., 1997, 1353, 180–190 CrossRef CAS.
- M. L. Orberg, K. Schillén and T. Nylander, Biomacromolecules, 2007, 8, 1557–1563 CrossRef.
- B. Klajnert, L. Stanisławska, M. Bryszewska and B. Pałecz, Biochim Biophys Acta., 2003, 1648, 115–126 CAS.
- E. Gabellieri, G. B. Strambini, D. Shcharbin, B. Klajnert and M. Bryszewska, Biochim Biophys Acta., 2006, 1764, 1750–1756 CAS.
| This journal is © The Royal Society of Chemistry 2009 |
