Improvement of the electrochemical detection of catechol by the use of a carbon nanotube based biosensor
B.
Pérez López
ab and
A.
Merkoçi
*abc
aNanobioelectronics & Biosensors Group, Institut Català de Nanotecnologia, E-08193 Bellaterra, Barcelona, Catalonia, Spain
bDepartament de Química, Universitat Autònoma de Barcelona, E-08193 Bellaterra, Catalonia, Spain. E-mail: arben.merkoci.icn@uab.es; Fax: +34 935868020; Tel: +34 935868014
cICREA, E-08193 Bellaterra, Barcelona, Catalonia, Spain
First published on 18th October 2008
Abstract
Tyrosinase (Tyr) has been used frequently for the detection of phenolic compounds. The development of a biosensor based on this enzyme-integrated carbon nanotube (CNT) epoxy composite electrode (CNTECE) is described in order to perform measurements of catechol. The enzyme is immobilized into a matrix prepared by dispersion of multi-wall CNT (MWCNT) inside the epoxy resin forming a CNT epoxy-biocomposite (CNTEC-Tyr). The use of CNT improves the electronic transference between the enzyme and the electrode surface. The modified electrode was characterized electrochemically by amperometric and voltammetric techniques. An applied potential of −200 mV vs.Ag/AgC1 applied to the biocomposite based electrode was found to be optimal for electrochemical reduction of the enzymatic reaction products (quinones). The biosensor modified with MWCNT is also compared with a tyrosinase biosensor based on a graphite epoxy-composite (GECE-Tyr) showing a sensitivity of 294 µA/mM cm2, a detection limit of 0.01 mM for a signal-to-noise ratio of 3 in a concentration range of 0.0–0.15 mM catechol with a response time of 20 s and an RSD of 8% (n = 3). The electrodes were stable for more than 24 h. A 90% increase of the signal indicated that the response is better with the biocomposite based on carbon nanotubes rather than with the graphite.
1. Introduction
Over the last decade, biosensors for environmental surveillance have became more prevalent in the literature with the emphasis on phenol determination and control.1 Phenols are compounds of large scale production that cause ecologically undesirable effects.2 Most phenols exhibit different toxicities and their determination is very important for evaluating the total toxicity of an environmental sample. In general phenolic compounds are subjected to chromatographic separation before detection.3 However, the separation takes time, and often requires pre-concentration. In addition, the equipment is expensive and is not generally portable. For that reason new alternative biosensor designs for phenolic compounds are being developed and investigated. Rigid conducting carbon nanotubes-polymer based composites are reported. The plastic nature of these materials makes them modifiable, permitting the incorporation of a great number of biological materials that can be immobilised by blending them with these composites to form new biocomposite materials.4The use of carbon nanotubes (CNT) has become relevant due to their excellent conductivity including the improvement of electron transfer between the enzymes and the electrode surfaces5 and at the same time provides a very good matrix for enzyme immobilization.6 On the other hand, the biosensors based on nanostructured compounds7,8 have been demonstrated to be simple in preparation and offer a great promise for developing amperometric biosensors.
Biosensors represent an interesting alternative for the detection of phenolic compounds. Many different approaches can be found in the literature including carbon-paste biosensors,9graphite composite electrodes7,8, conducting polymer modified electrodes,10 and silica sol-gel composite films.11 Some of these methods are relatively complicated, require the use of several reagents and often the biosensor produced presents stability problems. Currently, there is an increasing interest to design functional membranes for biosensing application because of their possible use for analytical applications.12 The use of enzymatic electrodes is an inherently sensitive alternaive for the detection of enzyme substrate. Many biosensors have been developed in the past using the catalytic activity of the redox enzymes for phenol determination such as tyrosinase, peroxidase, laccase, etc.13 using different electrode materials, flow systems and sample pretreatment techniques.
Tyrosinase, also known as polyphenol oxidase, is a copper monooxygenase that catalyzes the oxidation of catechols to the corresponding o-quinones.14–16 The liberated quinine species can be further electrochemically reduced to phenolic substances at low potential in the absence of mediators.17,18 Electrochemical reduction of quinones is incomplete. This is because quinones are highly unstable in water and they easily polymerize to polyaromatic compounds.19 In spite of this problem, sensors based on this approach have been reported using graphite electrodes and graphite-epoxy based composite electrodes.20,21
Tyrosinase-based bioelectrodes22,23 have been reported; however, one of the most important analytical problems that appear in the case of tyrosinase-modified electrodes is their low operational stability, especially for detecting o-diphenols.24,25 This can be due to the fact that the enzyme is lost in the surrounding environment (especially when physical methods are used for enzyme immobilization), or due to its inactivation by the radical species that appear during the biocatalytic oxidation.26 Thus, it is of great significance to develop new approaches to detect phenol derivatives with high sensitivity.
The main strategies for biomolecules immobilization are based on physical adsorption, cross-linking, covalent bonding, entrapment in gels or membranes, etc. Recent developments in the field of rigid and conducting polymer composites based on CNTs applied to electrochemistry7,8 have opened a new range of possibilities for the construction of electrochemical biosensors based on carbon materials. In these devices, the biocomponents are immobilised into the CNT matrix of the composite forming a biocomposite, a new material with unique properties. The main features of a biocomposite based on CNT and tyrosinase for catechol detection are described in the present work and its potential for the construction of an amperometric biosensor is also discussed.
2. Experimental
2.1. Reagents and solutions
Tyrosinase from mushroom (Tyr, 2034 U per mg, Catalog No. 93898), catechol, potassium dihydrogen phosphate and potassium hydrogen phosphate were purchased from Sigma. Epoxy resin Epotek H77 A, hardener Epotek H77 B were received from Epoxy Technology. The multiwalled carbon nanotubes powder (0.5–200 µm) (MWCNT), were purchased from Aldrich. The CNTs were purified in HNO3 to remove impurities such as amorphous carbon, graphite particles and metal catalysts. Further purification was accomplished by stirring the CNTs in 2 M nitric acid at 25°C for 24 h. Graphite powder (particle size 50 µm) was obtained from BDH, UK. The alumina paper (polishing strips 301044–001), was obtained from Orion, Spain.The standard catechol solutions were prepared daily by dilution in 0.1 M phosphate buffer at pH 6.5 with ultra pure water from a Millipore-MilliQ system.
2.2. Apparatus and electrodes
Cyclic voltammetry (CV) and chronoamperometry experiments were performed using an electrochemical analyzer Autolab 20 (Eco Chemie, The Netherlands) and an LC-4C amperometric detector (BAS) connected to a personal computer with GPES software.The measurements were performed in 10 mL of a 0.1 M phosphate buffer solution (PBS) pH 6.5 without deoxidizing, at room temperature (25 °C) using three electrodes based configuration. A platinum electrode and Ag/AgCl were used as counter and reference electrode, respectively. The biosensor based on carbon nanotube (CNT) epoxy composite (CNTEC-Tyr) and the tyrosinase biosensor based on a graphite epoxy-composite (GECE-Tyr) were used as working electrodes.
2.3. Tyrosinase biosensor preparation
The carbon nanotube-epoxy biocomposite (CNTEC-Tyr) and graphite epoxy-biocomposite (GECE-Tyr) electrodes were prepared by mixing manually during 30 minutes the tyrosinase (Tyr) (2.0% w/w), Epoxy resin (80.0% w/w) and carbon nanotubes or graphite powder (18.0% w/w), respectively; the prepared biocomposite paste was then introduced into a PVC tube containing an electrical connector completed by using a copper disk and wire. The biocomposite was cured at 40 °C for one week. Before measurements, the cured biosensor surface was polished with different abrasive papers of decreasing grain size, ending in alumina paper. The biosensors (CNTEC-Tyr and GECE-Tyr) were kept in a refrigerator while not being used.2.4. Electrochemical measurements
Electrochemical experiments were carried out with a typical 10 mL cell, at room temperature (25°C), using the three electrodes configuration. A magnetic stirrer provided the convective transport during the amperometric measurements.Cyclic voltammetry using modified electrodes (CNTEC-Tyr and GECE-Tyr) were performed in 0.02 mM catechol solution. The response of catechol was measured in 10 mL of a 0.1 M phosphate buffer solution (PBS) pH 6.5. The potential range used for catechol determination was −0.4 to +0.8 V for CNTEC-Tyr and GECE-Tyr. The surface coverage (Γ) of CNTEC-Tyr and GECE-Tyr was estimated from the area of the cyclic voltammetric peaks corresponding to the oxidation of catechol. According to the equation Γ = Q/nFA,27 where Q is the area of the catechol oxidation peak, n is the number of electrons involved in the oxidation, F is the Faraday's constant, and A is the area of the electrode (A = 0.2827 cm2). Γ was found to be of 2.1 × 10⁻⁸ mol/cm2 for GECE-Tyr and of 2.7 × 10⁻⁸ mol/cm2 for CNTEC-Tyr.
The steady state amperometric response to catechol was measured in aliquots of 10 mL of buffer solution with different additions of catechol added into the reaction cell. The measurements were carried out in a 0.1 M phosphate buffer solution pH 6.5, used as supporting electrolyte. The applied potential to the working electrode for catechol determination was −0.2 V using CNTEC-Tyr and GECE-Tyr electrodes respectively. The background current was allowed to decay to a constant level before aliquots of phenolic compounds sample were added to the stirred buffer solution.
3. Results and discussion
A mushroom tyrosinase enzyme which catalyzes the oxidation of catechols to the corresponding quinone compounds is used in this carbon nanotube biocomposite based biosensor. The electrochemical reduction of o-quinone formed due to the enzymatic reaction17,18 (see Fig. 1) is used as an indicator reaction, by which an electrical signal proportional to the catechol concentration is obtained.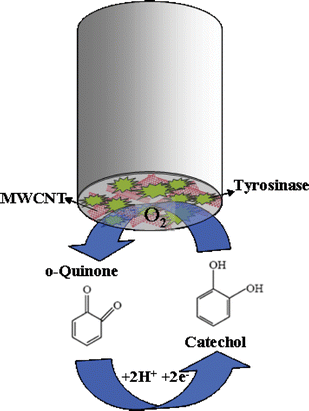 | ||
| Fig. 1 Schematic representation of the reaction of catechol with tyrosinase. | ||
3.1. Effect of scan rate
Figs. 2A and 3A illustrate the influence of the potential scan rate v on the cyclic voltammograms of GECE-Tyr and CNTEC-Tyr electrodes in 0.2 mM catechol solution (at 10, 20, 30, 40, 50, 60, 70, 80, 90, 100 mV/s, scanning potential range: −0.5 to 0.8 V) in 0.1 M phosphate buffer pH 6.5. It can be observed that the scan rate affects the position of the oxidation and reduction peaks. Inspection of the curves reveals that an increase in the scan rates, v, increases the current of the oxidation of catechol and shifts the anodic peak potential (Epa) toward more positive potentials as the rate increased, whereas the cathodic peak potential (Epc) shifts toward more negative potentials. The differences of these potential shifts for CNTEC-Tyr are 104 mV and 131 mV, respectively.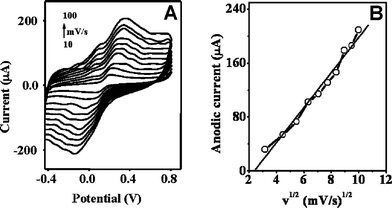 | ||
| Fig. 2 (A) Cyclic voltammograms of GECE-Tyr electrode in 0.2 mM catechol solution (at 10, 20, 30, 40, 50, 60, 70, 80, 90, 100 mV/s, scanning potential range: −0.5 to 0.8 V); (B) plots of anodic peak currents versus the square root of scan rate. | ||
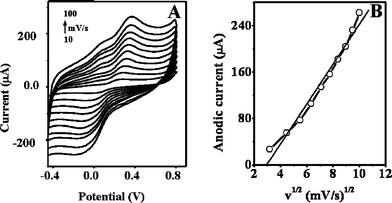 | ||
| Fig. 3 (A) Cyclic voltammograms of CNTEC-Tyr electrode in 0.2 mM catechol solution (at 10, 20, 30, 40, 50, 60, 70, 80, 90, 100 mV/s, scanning potential range: −0.5 to 0.8 V); (B) plots of anodic peak currents versus the square root of scan rate. | ||
The influence of sweep rate v (v1/2) on anodic peak current (Ipa) is shown in Fig. 2B for GECE-Tyr and Fig. 3B for CNTEC-Tyr respectively. Further analysis of the results indicate that the anodic peak current increases linearly with the square root of the rate, and the corresponding linear equation is i(µA) = 26.038 v1/2 − 62.46 with a linear correlation coefficient of 0.9902 for GECE-Tyr and for CNTEC-Tyr the corresponding linear equation is i(µA) = 34.369v1/2 − 100.794 with a linear correlation coefficient of 0.9889, both cases at pH = 6.5. The relation between Ipa and v½ indicates that the anodic dissolution process within the potential range of peak (Fig. 2B and 3B) is a diffusion controlled process.
The difference between the Epa and the Epc, for the GECE-Tyr is ΔEp = 214 mV and for the CNTEC-Tyr is ΔEp = 206 mV, both obtained at a potential scan rate of 100 mV.s−1, and the current ratio between the peaks (Ia/Ic) is 0.98 and 1.14 respectively. These results demonstrate that the oxidation process of catechol in both electrodes can be considered quasi-reversible.
3.2. Amperometric behavior of tyrosinase biosensor
The hydrodynamic voltammogram (HDV) data are very important for selecting the operating potential for amperometric measurements. In the case of CNTEC-Tyr, as it was already reported, there is an important catalytic effect, on the reduction of o-quinone and oxidation of catechol, making it possible for high sensitive detection of phenolic compounds. Fig. 4 compares hydrodynamic voltammograms for 0.025 mM catechol for GECE-Tyrosinase (a) and at CNTEC-Tyrosinase (b) in 0.1 M phosphate buffer pH 6.5. The reduction current for the o-quinone enzymatically generated starts at potential −0.2 V at CNTEC-Tyr and GECE-Tyr. At CNTEC-Tyr the signal increases around 80% at the potential of −0.2 V (observe the different current scales at figure 4) indicating that the sensitivity largely increases as consequence of the type of material. Therefore, carbon nanotubes promote in a very efficient way the electron transfer between o-quinone and CNTEC-Tyr. This electrocatalytic activity facilitates low-potential amperometric determination of catechol.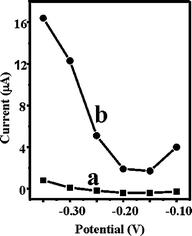 | ||
| Fig. 4 Hydrodynamic voltammogram for 0.025 mM catechol for GECE-Tyr (a) and at CNTEC-Tyr (b) in 0.1 M phosphate buffer pH 6.5. | ||
3.3. Biosensor response toward catechol
The amperometric responses for the determination of catechol on GECE-Tyr (a) and CNTEC-Tyr (b) electrodes at the scan rate of 100 mV·s−1 are compared in Fig. 5. It shows well-defined responses for each successive addition of 0.02 mM catechol at the graphite-epoxy-Tyr composite (GECE-Tyr) (a) and carbon nanotube-epoxy composite (CNTEC-Tyr) (b) electrodes using operating potential of −0.2 V in 0.1 M phosphate buffer solution pH 6.5, with their respective calibration plots (insets). The CNTEC-Tyr electrode offer substantially larger signals reflecting the electrocatalytic properties of carbon nanotubes. The sensitivity of detection for catechol determination at an applied potential of −0.2 V is based in the amount of o-quinone produced by enzymatic reaction between catechol and tyrosinase. It was of 46 µA/mM cm2 for GECE-Tyr and of 294 µA/mM cm2 for CNTEC-Tyr with a current intensity 90% higher than GECE-Tyr (note the different scales) (Fig. 5). Nevertheless, the repeatability of the method was obtained in one day by the same analyst using the same reagent solutions demonstrating to be better for GECE-Tyr than for CNTEC-Tyr with a RSD = 5% (n = 3) and RSD = 8% (n = 3), respectively. The plots of current vscatechol concentration were linear for a concentration range of 0.0–0.15 mM at CNTEC-Tyr and GECE-Tyr electrodes (inset calibration plots (5a and 5b) with a correlation coefficient of 0.990 and 0.996, respectively.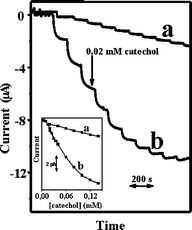 | ||
| Fig. 5 Current–time recordings obtained from amperometric experiments at GECE-Tyr (a) and at CNTEC-Tyr (b) for successive additions of 0.02 mM catechol. Working potential: −0.2 V in 0.1 M phosphate buffer pH 6.5. The inset shows the corresponding calibration plots. | ||
The highest current response for CNTEC-Tyr due to the distinctive properties of CNTs, especially, the biocompatibility and ability to facilitate electron transfer make them suitable candidates for immobilization of biomolecules and biosensor applications.28,29 A variety of enzymes by using CNTs as molecule wires to facilitate the electron transfer of enzyme with electrode have been employed in the relatively new field of enzyme-based nanotube sensors.30
The stability of the CNTEC-Tyr and GECE-Tyr electrodes is very important during the chronoamperometric experiments. It was studied using the same conditions as was above mentioned. For each different addition of 0.02 mM catechol solution a response time of about 20 s was observed and thereafter a good stability is maintained at GECE-Tyr during 5 minutes and a better current increase with CNTEC-Tyr, operating at a potential of −0.2 V, the electrodes being stable for more than 24 h (results not shown).
4. Conclusions
In summary, the experiments described above illustrate an attractive construction of renewable biosensors for the catechol detection. Tyrosinase maintains its enzymatic properties in the composite matrix; furthermore, the sensing surface can be renewed by a simple polishing procedure resulting in a fresh surface. Various additives may be incorporated into the biocomposite matrix to enhance the analytical performance further.One of the outstanding features of these conducting biomaterials is their rigidity. The proximity of the redox centres of tyrosinase and the carbon nanotubes on the sensing surface favours the transfer of electrons between electroactive species. Composites electrodes modified with carbon nanotubes show improved electrochemical properties offering important advantages: i) CNTEC-Tyr exhibit better electronic properties than GECE-Tyr due to the promotion in a very efficient way of electron transfer between o-quinone and CNTEC-Tyr electrode ii) CNTEC-Tyr shows a detection limit (0.01mM) almost half of that obtained by GECE-Tyr iii) The CNT biocomposite offer the possibility for electrode surface renewing forming a new active layer and lastly iv) The CNTEC-Tyr and GECE-Tyr amperometric biosensors are very attractive for mass fabrication so as to obtain low cost biosensors.
Acknowledgements
The WARMER Project Reference: FP6-034472-2005-IST-5 and MAT2008-03079/NAN (From MEC, Madrid) are acknowledged.References
- K. R. Rogers, Biosens. Bioelectron., 1995, 10, 533 CrossRef CAS
.
- J. Kulys and R. Vidziunaite, Biosens. Bioelectron., 2003, 18, 319 CrossRef CAS
.
- V. Carralero, M. L. Mena, A. González-Cortés, P. Yáñez-Sedeño and J. M. Pingarrón, Biosens. and Bioelectron., 2006, 22, 730 Search PubMed
.
- F Cèspedes and S. Alegret, TrAC, Trends Anal. Chem., 2000, 19(4), 276 CrossRef CAS
.
- A. Merkoçi, Microchim. Acta., 2006, 152, 157 CrossRef CAS
.
- B. Pérez, J. Sola, S. Alegret and A. Merkoçi, Electroanalysis, 2008, 20(6), 603 CrossRef
.
- B. Pérez, M. Pumera, M. Del Valle, A. Merkoçi and S. Alegret, J. Nanosci. Nanotech., 2005, 5(10), 1694 CrossRef CAS
.
- M. Pumera, A. Merkoçi and S. Alegret, Sens. Actuators, B.(113), 617 Search PubMed
.
- A. Merkoçi, M. Pumera, X. Llopis, B. Perez, M. Del Valle and S. Alegret, Trends. Anal. Chem., 2005, 24, 826 CrossRef CAS
.
- O. Adeyoju, E. J. Iwuoka, M. R. Smyth and D. Leech, Analyst, 1996, 121, 1885 RSC
.
- Li, L. S. Chia, N. K. Goh and S. N. Tan, Anal. Chim. Acta., 1998, 362, 203 CrossRef CAS
.
- A. Liu, H. Zhou and I. Honma, Electrochem. Commun. 2005, 7, 1 Search PubMed
.
- N. Duran and E. Esposito, Appl. Catal. B Environ., 2000, 28, 83 CrossRef CAS
.
- E. I. Solomon, U. M. Sundaram and T. E. Machonkin, Chem. Rev., 1996, 96, 2563 CrossRef CAS
.
- H. Decker and F. Tuczek, Trends Biochem. Sci., 2000, 25, 392 CrossRef CAS
.
- E. J. Land, C. A. Ramsden and P. A. Riley, Acc. Chem. Res., 2003, 36, 300 CrossRef CAS
.
- T. Toyata, S. S. Kuan and G. G. Guilbault, Anal. Chem., 1985, 57, 1925 CrossRef CAS
.
- A. Ghindilis, V. Gavrilova and A. Yaropolov, Biosens. Bioelectron., 1992, 7, 127 CrossRef CAS
.
-
N. H. Horowitz, M. Fling, and G. Horn, Methods in Enzymology, Academic Press, New York, 1970, 120 Search PubMed
.
- F. Ortega, E. Domínguez, G. Jönsson-Pettersson and L. Gorton, J. Biotechnol., 1993, 31, 289 CrossRef CAS
.
- P. Önnerfjord, J. Emnéus, G. Marko-Varga and L. Gorton, Biosens. Bioelectron., 1995, 10, 607 CrossRef
.
- E. S. Forzani, G. A. Rivas and V. M. Solís, J. Electroanal. Chem., 1999, 461, 174 CrossRef CAS
.
- E. S. Forzani, V. M. Solís and E. J. Calvo, Anal. Chem., 2000, 72, 5300 CrossRef CAS
.
- A. I. Yaropolov, A. N. Kharybin, J. Emnéus, G. Marko-Varga and L. Gorton, Anal. Chim. Acta., 1995, 308, 137 CrossRef CAS
.
- F Ortega, E. Domínguez, E. Burestedt, J. Emnéus, L. Gorton and G. Marko-Varga, J. Chromatogr., 1994, A675, 65 CrossRef
.
- C. Nistor and J. Emnéus, Waste Manage, 1999, 19, 147 CrossRef CAS
.
-
A. J. Bard, L. R. Faulkner, Electrochemical Methods, Wiley, New York, 2001 Search PubMed
.
- M. Shim, N. W. Shi Kam, R. J. Chen, Y. Li and H. Dai, Nano Lett. 2, 2002, 285 Search PubMed
.
- E. Katz and I. Willner, Chem. Phys. Chem. 5, 2004, 1084 Search PubMed
.
- Y. Liu, X. Qu, H. Guo, H. Chen, B. Liu and S. Dong, Biosens. and Bioelectron. 21, 2006, 2195 Search PubMed
.
| This journal is © The Royal Society of Chemistry 2009 |
