Photovoltaic properties of three new cyanine dyes for dye-sensitized solar cells
Wenjun
Wu
,
Jianli
Hua
,
Yinghua
Jin
,
Wenhai
Zhan
and
He
Tian
*
Key Laboratory for Advanced Materials and Institute of Fine Chemicals, East China University of Science and Technology, Shanghai 200237, China. E-mail: tianhe@ecust.edu.cn; Fax: +86-21-64252288; Tel: +86-21-64252756
First published on 31st October 2007
Abstract
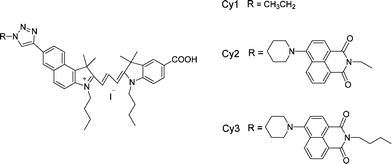
Three carboxylated cyanine dyes, 2-[(1-butyl-3,3-dimethyl-5-carboxylindoline-2-ylidene)propenyl]-[1-butyl-3,3-dimethyl-7-(1-ethyl-1H-1,2,3-triazole-4-yl]-1H-benz[e]indolium iodide (Cy1), 2-[(1-butyl-3,3-dimethyl-5-carboxyl-indoline-2-ylidene)propenyl]-{1-butyl-3,3-dimethyl-7-[(4-piperidine-N-ethyl-1,8-naphthalimide)-1H-1,2,3-triazole-4-yl]}-1H-benz[e]indolium iodide (Cy2) and 2-[(1-butyl-3,3-dimethyl-5-carboxyl-indoline-2-ylidene)propenyl)-[1-butyl-3,3-dimethyl-7-{(4-piperidine-N-butyl-1,8-naphthalimide)-1H-1,2,3-triazole-4-yl}]-1H-benz[e]indolium iodide (Cy3), have been synthesized and characterized with regard to their structures and electrochemical properties. Upon adsorption onto a TiO2electrode, the absorption spectra of the three cyanine dyes are all broadened to both red and blue sides compared with their respective spectra in an acetonitrile and ethanol mixture. Cy2 and Cy3, containing a naphthalimide group, have stronger absorption intensities and broader absorption spectra than Cy1, which consequently leads to better light-to-electricity conversion properties. Among the three cyanine dyes, Cy3 generated the highest photoelectric conversion yield of 4.80% (Jsc = 14.5 mA cm–2, Voc = 500 mV, FF = 0.49) under illumination with 75 mW cm–2 white light from a Xe lamp.
Introduction
Dye-sensitized solar cells (DSSCs) are extensively studied as promising systems for photoelectric conversion, especially ruthenium complex-sensitized TiO2 solar cells.1,2 However, the high price of RuCl3 and difficulties in the synthesis of Ru(II)-polypyridine complexes limit the practical application of DSSCs at the present time. Compared with Ru(II) complexes, pure organic dyes not only are easier to prepare but also cost less. Therefore, some pure organic dyes with rich photophysical properties are expected to be promising sensitizers for nanocrystalline solar cells. Recently, pure organic dye-sensitized solar cells3–13 have made great progress, indicating that pure organic dyes would be a promising type of sensitizer for DSSCs.Of pure organic dyes, cyanine dyes have intense and broad absorption bands in the visible and near-infrared regions, and excellent sensitizing properties in photography. Recently, they have been used as sensitizers in DSSCs and some progress has been made in this area. Sayama studied a series of benzothiazole merocyanines with different chain lengths and found that the solar light-to-power conversion efficiency (η) and the incident photon-to-current conversion efficiency (IPCE) increased with increasing length of the alkyl chain attached to the benzothiazole ring. The best sensitizer has a conversion yield of 4.5%, with a short-circuit photocurrent (Jsc) of 11.4 mA cm–2, an open-circuit voltage (Voc) of 600 mV and a fill factor of 0.65 under AM 1.5, 100 mW cm–2 simulated solar light.11 Chen synthesized new cyanine dyes (Sqb and Cyb3) with a carboxylbenzyl group and different methine chains as sensitizers for nanocrystalline solar cell. The results showed that Jsc (2.76 mA cm–2), IPCE (46%) and η (1.7%) of a TiO2 nanocrystalline solar cell sensitized by Sqb were higher than that of a TiO2 nanocrystalline solar cell sensitized by Cyb3 when TiO2 nanostructured porous film was 6.5 µm thick.12 On the other hand, Guo10 studied the co-sensitization of two new cyanine dyes. It was found that the aggregates of the cyanine dyes were efficient in light harvesting and that a mixture of two cyanine dyes could be employed to sensitize the solar cell over the entire visible spectrum. They generated a photoelectric conversion yield of 3.4%.
Recently, we have succeeded in synthesizing a series of hemicyanine and cyanine dyes and we found that these dyes could perform excellent spectral sensitization by reasonable design.14–16 In order to enrich the research field of cyanine dyes for DSSCs and gain more information on the structure–property relationships. In this paper, we report the photovoltaic properties of three new cyanine dyes (Cy1–Cy3) (Scheme 1) having different alkyl chain length between the naphthalimide and triazole groups.
 | ||
| Scheme 1 Molecular structures of Cy1, Cy2 and Cy3. | ||
Experimental
Materials
The FTO conducting glass (fluorine doped SnO2, sheet resistance < 15 Ω, transmission > 90% in the visible) was obtained from Geao Science and Educational Co. Ltd., China. P25 (Nanocrystalline TiO2, grain size < 20 nm) was purchased from Shanghai Haiyi Scientific & Trading Co., Ltd. All other solvents and chemicals used were produced by Sinopharm Chemical Reagent Co., Ltd, China (reagent grade) and used as received. Cy1–Cy3 were synthesized according to the literature,16 and the synthetic route is briefly illustrated in Scheme 2. The structures of three cyanine dyes were confirmed by 1H NMR, 13C NMR and MS-ESI.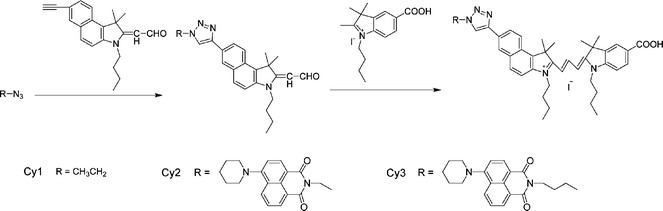 | ||
| Scheme 2 Synthetic route to cyanine dyes Cy1, Cy2 and Cy3. | ||
Cy1. 1H NMR (DMSO-d6, 400 MHz), δ: 8.75 (s, 1H), 8.55 (d, J = 12.8 Hz, 1H), 8.5 (d, J = 12.4 Hz, 1H), 8.40 (d, J = 8.4 Hz, 1H), 8.15 (m, 2H), 8.05 (s, 1H), 7.9 (d, J = 7.6 Hz, 1H), 7.7 (d, J = 8.8 Hz, 1H), 7.3 (d, J = 7.6 Hz, 1H), 6.5 (m, 2H), 4.5 (m, 2H), 4.25 (m, 4H), 2.0 (s, 6H), 1.75 (m, 10H), 1.55 (t, J = 6.8 Hz, 3H), 1.40 (m, 4H), 0.95 (m, 6H); 13C NMR (DMSO-d6, 400 MHz), δ: 175.2, 174.8, 149.4, 146.9, 142.3, 139.4, 137.9, 133.5, 132.2, 131.1, 130.8, 128.8, 127.9, 127.4, 126.2, 123.9, 122.5, 120.1, 111.0, 109.6, 102.9, 101.9, 50.9, 49.2, 45.5, 44.5, 29.8, 29.6, 29.3, 28.9, 27.9, 27.7, 22.6, 20.2, 15.6, 13.9, 13.8, 10.9; MS (EI)m/z: 629.4 (M – I–).
Cy2. 1H NMR (DMSO-d6, 400 MHz), δ: 8.75 (s, 1H), 8.50 (m, 3H), 8.38 (m, 3H), 8.19 (d, J = 8.8 Hz, 1H), 8.05 (m, 2H), 7.95 (d, J = 8.4 Hz, 1H), 7.75 (m, 2H), 7.35 (d, J = 8.4 Hz, 1H), 7.25 (d, J = 8.4 Hz, 1H), 6.5 (m, 2H), 4.8 (t, J = 5.32 Hz, 2H), 4.50 (t, J = 6.1 Hz, 2H), 4.20 (m, 4H), 3.20 (t, J = 4.7 Hz, 4H), 2.0 (s, 6H), 1.75 (m, 16H), 1.4 (m, 4H), 0.95 (m, 6H); 13C NMR (DMSO-d6, 400 MHz), δ: 175.0, 174.7, 170.31, 164.4, 163.8, 157.7, 149.4, 146.9, 142.2, 139.4, 139.3, 138.1, 133.4, 133.0, 132.1, 131.3, 133.1, 130.0, 127.7, 127.4, 126.2, 125.3, 123.9, 122.4, 121.1, 114.9, 114.6, 111.1, 109.6, 103.1, 102.1, 54.4, 50.8, 49.2, 48.0, 44.5, 39.6, 29.8, 29.6, 27.9, 27.7, 26.1, 24.2, 20.2, 13.9, 13.8; MS (EI)m/z: 907.4 (M – I–).
Cy3. 1H NMR (DMSO-d6, 400 MHz), δ: 8.75 (s, 1H), 8.50 (m, 3H), 8.38 (m, 3H), 8.19 (d, J = 8. 9 Hz, 1H), 8.09 (m, 2H), 8.05 (d, J = 8.1 Hz, 1H), 7.92 (d, J = 7.1 Hz, 1H), 7.80 (t, J = 8.1 Hz, 1H), 7.40 (d, J = 7.7 Hz, 1H), 7.30 (d, J = 8.2 Hz, 1H), 6.62 (d, J = 3.4 Hz, 1H), 6.55 (d, J = 13.2 Hz, 1H), 4.50 (t, J = 6.9 Hz, 2H), 4.27 (t, J = 6.7 Hz, 2H), 4.12 (m, 4H), 3.20 (t, J = 4.7 Hz, 4H), 2.01 (s, 6H), 1.98 (t, J = 9.9 Hz, 2H), 1.82 (m, 4H), 1.77 (m, 4H), 1.75 (s, 6H), 1.63 (m, 4H), 1.43 (m, 4H), 0.95 (m, 6H); 13C NMR (DMSO-d6, 400 MHz), δ: 176.3, 173.1, 164.6, 164.1, 157.5, 155.7, 146.8, 139.3, 134.3, 132.8, 132.4, 131.1, 130.8, 129.9, 127.9, 127.3, 126.2, 125.3, 122.8, 115.5, 114.7, 111.6, 104.8, 103.9, 54.5, 51.1, 50.0, 48.7, 45.6, 39.0, 31.9, 30.2, 29.7, 29.3, 28.3, 27.9, 26.2, 25.1, 24.3, 22.67, 20.4, 19.1, 14.1, 14.0, 12.1, 1.23; MS (ESI) m/z: 936.4 (M – I–).
Preparation of TiO2colloidal dispersion and nanocrystalline TiO2electrode
TiO2colloidal dispersion was prepared by following the procedure reported in the literature,17 except that we only use polyethylene glycol (PEG, Mw 20000) (40% by weight of TiO2) without cellulosic polymer. A conducting glass of 2 cm × 5 cm was cleaned with acetone, redistilled water and anhydrous alcohol, and then its four edges were covered with an adhesive tape (3M) having a normal thickness of 40 µm. A drop of the paste was applied to one of the edges of a FTO substrate and flattened with a glass rod by sliding over the tape-covered edges and dried under infrared lamp. The TiO2 film is obtained by the five times repetitive coating. The important procedure is quick slide of the glass rods for the successive overlayers. After sintering at 500 °C for 30 min, the porous TiO2electrodes were cooled to 80 °C and then dipping into a 3 × 10⁻⁴ M solution of the dyes in acetonitrile and ethanol (volume ratio: 1:1) for 12 h at room temperature. Finally, the DSSCs were fabricated and the platinum sputtered ITO was used as counter electrode. The DSSCs were sealed with KC-904 hot melt adhesive tape (Kouuci, Shanghai) and leaving two side hole for injecting electrolyte.Photoelectrochemical measurements and analyses
The UV-Vis spectra were measured with model CARY 100 spectrophotometer. The fluorescence spectra were observed on a Cary Eclipse fluorescence spectrophotometer. The cyclic voltammograms of dyes were estimated with a Versastat II electrochemical workstation (Princeton Applied Research) using a normal three-electrode cell with a Pt working electrode, a Pt wire auxiliary electrode, and Ag/AgCl reference electrode in saturated KCl solution.The Photocurrent action spectra were measured with a Model SR830 DSP Lock-In Amplifier and a Model SR540 Optical Chopper (Stanford Research Corporation, USA), a 7IL/PX150 xenon lamp and power supply, and a 7ISW301 Spectrometer. Volt-current characteristics were performed on a Model 2400 Sourcemeter (Keithley Instruments, Inc. USA) and a 500 W xenon lamp served as a white light source in conjunction with a GRB3 neutral filter. Here a GRB3 neutral filter was used to cut off infrared light to protect the electrode from heating. The redox electrolyte solution was composed of 0.5 M LiI, 0.05 M I2 in the mixture of acetonitrile and 3-methoxypropionitrile (volume ratio: 7 : 3). The effective area of photocells is 0.15 cm2. The intensity of the illumination source was measured using a power meter. The thicknesses of the TiO2 films are 6 µm which are measured with a Tencor Alpha-Step 500 Surface Profiler.
Result and discussion
Absorption spectra of dyes Cy1, Cy2 and Cy3 in solution and on TiO2 film
The absorption spectra of dyes Cy1, Cy2 and Cy3 in acetonitrile and ethanol mixture solution and on nanocrystalline TiO2 are shown in Fig. 1. It can be seen from Fig. 1 that the absorption peaks of Cy1–Cy3 in solution are at 550 and 583 nm for Cy1, 408, 550 and 583 nm for Cy2, and 408, 550 and 583 nm for Cy3, respectively. The corresponding maximum extinction coefficients (εmax) of Cy1, Cy2 and Cy3 are 9.62 × 10⁴, 1.42 × 10⁵ and 1.83 × 10⁵ M–1 cm–1, respectively. These values are much greater than those of Ru complexes (1.4 × 10⁴ M–1 cm–1). Fig. 1 also shows the absorption spectra of Cy1, Cy2 and Cy3 on TiO2 layers. The absorption spectra of dyes attached to TiO2 film broaden into both sides compared to those in solution, implying that the formation of dye aggregates are on the TiO2 surface. It is known that the dyes, especially cyanine dyes, have a strong tendency to aggregate in solution or at the solid–liquid interface due to a strong attractive force between the molecules. Dye aggregates usually have three forms: Red-shifted J-aggregates, blue-shifted H-aggregates and both red- and blue-shifted Herring-bone aggregates.10 The experimental results shown in Fig. 1 indicate that the dyes used in this work form Herring-bone aggregates on the TiO2nanocrystal surface. Cy2 and Cy3 containing naphthalimide group have stronger absorption intensities and broader absorption spectra than that of Cy1 (cf.Fig. 1), which consequently leads to a better light-to-electricity conversion property.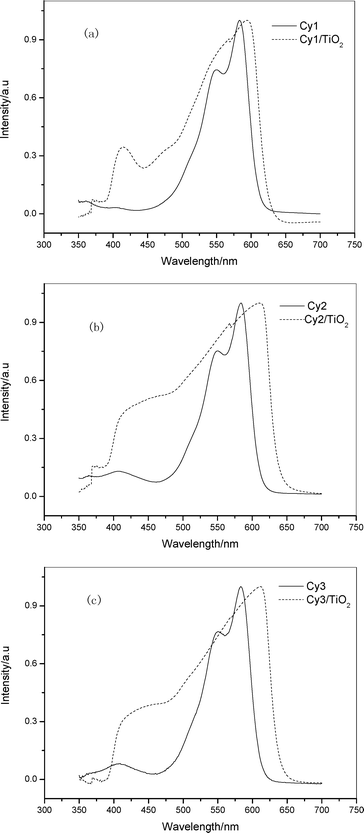 | ||
| Fig. 1 Absorption spectrum of Cy1–Cy3 in acetonitrile and ethanol mixture solution (volume ratio: 1 : 1) and of TiO2electrodes sensitized by Cy1–Cy3 (a) Cy1; (b) Cy2; (c) Cy3. | ||
Energy levels of dyes
For the photo-induced electron injection into TiO2, the energy level of the excited state of the dye must be higher than that of the conduction band of TiO2. The energy level of the excited states of dyes Cy1, Cy2 and Cy3 can be described by the following equations:18| E0D+/D* = E0D+/D + Eg | (1) |
| Eg(eV) = 1240/λg(nm) | (2) |
where E0D+/D* is the excited-state energy, E0D+/D is the ground-state energy, Eg is the band gap energy, and λg is the absorption threshold wavelength of dyes. Usually, the ground-state energy of a dye, E0D+/D, is estimated from its equilibrium redox potential, which can be obtained from a cyclic voltammetric (CV) curve. Fig. 2 shows the cyclic voltammograms of dyes Cy1, Cy2 and Cy3 in ethanol solutions. The equilibrium potentials of Cy1, Cy2 and Cy3, as obtained from Fig. 2, are 1.10, 1.08 and 1.07 V (vs. Ag/AgCl), corresponding to energy levels of –5.82, –5.80 and –5.79 eV (vs. vacuum) respectively. From Fig. 1 (a), (b) and (c), we know that the absorption thresholds for dyes Cy1, Cy2 and Cy3 are about 640 nm, which correspond to the band gap energy of 1.94 eV according to eqn (2). Then, based on eqn (1), the excited-state energy of Cy1, Cy2 and Cy3 are calculated to be –3.88 eV, –3.86 eV and –3.85 eV, respectively. All of them are higher than the bottom of the conduction band of TiO2 (–4.4 eV). The results confirm that photo-induced electron injection is thermodynamically favorable.
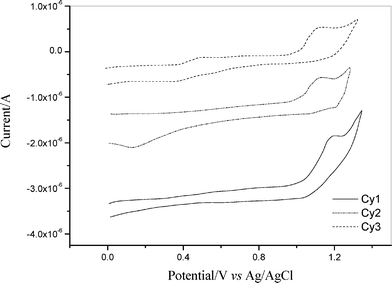 | ||
| Fig. 2 Cyclic voltammetry curve of Cy1–Cy3 in 0.2 mM acetonitrile solution, scan rate: 25 mV s–1. | ||
Photoelectrochemical performances of dye-sensitized solar cells
Photocurrent action spectra for the dye-coated TiO2electrodes are shown in Fig. 3. The monochromatic incident photo-to-electron conversion efficiency (IPCE), defined as the number of electrons generated by light in the outer circuit divided by the number of incident photons, was obtained by means of the following equation: | (3) |
where the constant 1240 is derived from unit conversion, Isc is the short-circuit photocurrent generated by monochromatic light, and λ is the wavelength of incident monochromatic light, the light intensity of which is Pin. The losses of light reflection and absorption by the conducting glass were not corrected. From Fig. 3 we can see that all three dyes can efficiently convert visible light to photocurrent in the region from 400 nm to 700 nm. The IPCE of Cy1 reached a maximum (35%) at 600 nm. The IPCE exceeds 30% in the spectral range 520–640 nm for Cy2, which reaches its maximum of 57% at 600 nm. And the maximum IPCE of Cy3 reaches 59.5% at 540 nm. Although the HOMO and LUMO energy levels for Cy2 and Cy3 are almost same as those for Cy1 (Table 1), the IPCE performances of the DSSCs with Cy2 and Cy3 are higher than those for solar cells with Cy1. This is because Cy2 and Cy3, containing the naphthalimide group, have stronger absorption intensities and broader absorption spectra than that of Cy1 upon adsorption on a TiO2electrode.
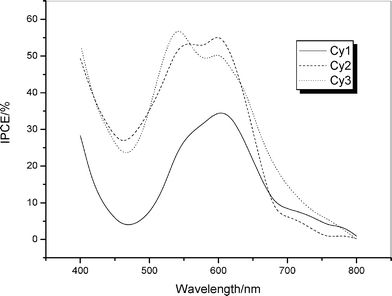 | ||
| Fig. 3 Photocurrent action spectra of the TiO2electrodes sensitized by Cy1–Cy3. | ||
| λ max/nm | ε/M–1 cm–1 | HOMO/eV | LUMO/eV | |
|---|---|---|---|---|
| Cy1 | 583 | 9.62 × 10⁴ | –5.82 | –3.88 |
| Cy2 | 583 | 1.42 × 10⁵ | –5.80 | –3.86 |
| Cy3 | 583 | 1.83 × 10⁵ | –5.79 | –3.85 |
The photoelectrochemical properties of the cyanine dye sensitized TiO2electrodes are listed in Table 2, while the photocurrent–voltage curves are shown in Fig. 4 under irradiation intensities of 20 mW cm–2 (solid line) and 75 mW cm–2 (dashed line). We can see from Fig. 4 and Table 2 that the short-circuit photocurrent of the Cy3-sensitized TiO2electrode is higher than those of the Cy1 and Cy2-sensitized systems. Cy1 has the lowest short-circuit photocurrent and overall conversion yield because of its lower IPCE values and converts light to electricity in relatively narrow light region. Cy2 and Cy3 exhibit higher short-circuit photocurrents and overall yields due to their higher IPCE values in the broad light region. The results are consistent with the energy level of cyanine dyes (see Table 1).
| Dye (light intensity/mW cm–2) | J sc /mA cm–2 | V oc/mV | FF | η (%) |
|---|---|---|---|---|
| Cy1(75) | 7.40 | 490 | 0.60 | 2.90 |
| Cy1(20) | 2.17 | 510 | 0.58 | 3.22 |
| Cy2(75) | 13.5 | 470 | 0.47 | 4.00 |
| Cy2(20) | 4.07 | 430 | 0.62 | 5.50 |
| Cy3(75) | 14.5 | 500 | 0.49 | 4.80 |
| Cy3(20) | 4.34 | 540 | 0.49 | 5.80 |
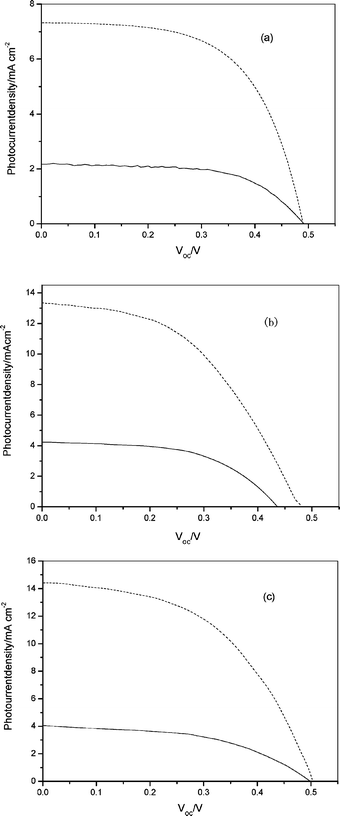 | ||
| Fig. 4 Photocurrent–voltage characteristics for Cy1–Cy3-sensitized solar cells under irradiation intensities of 20 mW cm–2(solid line) and 75 mW cm–2 (dashed line) white light from a xenon lamp (a) Cy1; (b) Cy2; (c) Cy3. | ||
From Fig. 3 and Table 2 we can also see the relation between the photoelectrochemical properties and molecular structure. Cy2 and Cy3, containing a naphthalimide group, have stronger absorption intensities and broader absorption spectra than that of Cy1 upon adsorption on a TiO2electrode. This can also lead to higher IPCE values and light-to-electricity conversions. For Cy2 and Cy3, the short-circuit photocurrent (Isc) and open circuit photovoltage (Voc) increased with increasing alkyl chain length between the naphthalimide and triazole groups. Consequently, the solar light-to-power conversion efficiency (η) increased with increasing alkyl chain length. The increase of alkyl chain length may be expected by preventing the approach of acceptors (i.e., I3– ion) to the TiO2 surface and/or by reducing the reorganization energy of the dye, resulting in the desired situation for the kinetic competition for the reduction of the dye cation.19 Among the three cyanine dyes, cyanine dyes containing naphthalimide and longer alkyl chains between the naphthalimide and triazole groups can improve photon-to-current efficiency. Unlike the stable performance of a silicon solar cell, DSSC is sensitive to variable illumination. When the irradiation intensified, the transport of I3–/I– to and from the counter electrode was not fast enough to fully regenerate the oxidized dye.20 The diffusion kinetics in the electrolyte becomes the limiting step in the current production, which has a dramatic influence on the efficiency of Cy1, Cy2 and Cy3, which decreases from 3.22% to 2.90%, 5.50% to 4.00%, and 5.8% to 4.8%, respectively. Compared with Ru(II) complexes, cyanine dyes not only have higher molar extinction coefficients, but can be obtained by simple preparation and purification procedure at lower cost. Interestingly, cyanine dyes adsorbed on the nanocrystalline TiO2 film can form J- or H-aggregates, which broaden the absorption spectra to both red and blue sides and which will in turn enhance the conversion efficiency of light to electricity. Though the overall photoelectric conversion yield of the DSSC with cyanine dyes in this work is a little lower than those for the solar cells with other high efficiency dyes, we believe that the development of highly efficient organic cyanine dyes can be made possible through rational structural modifications.
Conclusion
In this paper, we designed and synthesized three cyanine dyes, and investigated systematically the relationship between the photoelectrochemical properties and structures. Through investigation of their absorption and photoelectrochemical properties, we found that, among the three cyanine dyes, Cy3 generated the highest photoelectric conversion yield of 4.80%, with a short-circuit photocurrent of 14.50 mA cm–2, an open-circuit voltage of 500 mV, and a fill factor of 0.49 under irradiation with 75 mW cm–2 white light from a Xe lamp. Our study indicates that through reasonable design, cyanine dyes could perform excellent spectral sensitization. Furthermore, more efficient cyanine dyes as sensitizers could be designed following study of the structure–efficiency relationship.Acknowledgements
This work was supported by NSFC/China (90401026, 20772031), National Basic Research 973 Program (2006CB806200) and Scientific Committee of Shanghai.References
- M. K. Nazeeruddin, A. Kay, I. Rodicio, R. Humphry-Baker, E. Müller, P. Liska, N. V. Lachopoulos and M. Grätzel, Conversion of Light to Electricity by cis-X2Bis(2,2′-bipyridyl-4,4′-dicarboxylate) ruthenium(II) Charge-Transfer Sensitizers (X = C1–, Br–, I–, CN–, and SCN–) on Nanocrystalline TiO2 Electrodes, J. Am. Chem. Soc., 1993, 115, 6382–6390 CrossRef CAS.
- P. Wang, C. Klein, R. H. Baker, S. M. Zakeeruddin and M. Grätzel, A High Molar Extinction Coefficient Sensitizer for Stable Dye-Sensitized Solar Cells, J. Am. Chem. Soc., 2005, 127, 808–809 CrossRef CAS.
- T. Horiuchi, H. Miura and S. Uchida, Highly-efficient metal-free organic dyes for dye-sensitized solar cells, Chem. Commun., 2003, 3036–3037 RSC.
- D. P. Hagberg, T. Edvinsson, T. Marinado, G. Boschloo, A. Hagfeldt and L. Sun, A Novel Organic Chromophore for Dye-Sensitized Nanostructured Solar Cell, Chem. Commun., 2006, 2245–2247 RSC.
- K. Hara, Z. Wang, T. Sato, A. Furube, R. Katoh, H. Sugihara, Y. Dan-oh, C. Kasada, A. Shinpo and S. Suga, Oligothiophene-Containing Coumarin Dyes for Efficient Dye-Sensitized Solar Cells, J. Phys. Chem. B, 2005, 109, 15476–15482 CrossRef CAS.
- S. Ito, S. M. Zakeeruddin, R. Humphry-Baker, P. Liska, R. Charvet, P. Comte, M. K. Nazeeruddin, M. Takata, H. Miura, S. Uchida and M. Grätzel, High-Efficiency Organic-Dye-Sensitized Solar Cells Controlled by Nanocrystalline-TiO2 Electrode Thickness, Adv. Mater., 2006, 18, 1202–1205 CrossRef CAS.
- K. Hara, M. Kurashige, Y. Dan-oh, C. Kasada, A. Shinpo, S. Suga, K. Sayama and H. Arakawa, Design of New Coumarin Dyes Having Thiophene Moieties for Highly Efficient Organic-Dye-Sensitized Solar Cells, New J. Chem., 2003, 27, 783–785 RSC.
- F. A. Castro, A. Faes, T. Geiger, C. F. O. Graeff, M. Nagel, F. Nüesch and R. Hany, On the Use of Cyanine Dyes as Low-Bandgap Materials in Bulk Heterojunction Photovoltaic Devices, Synth. Met., 2006, 156, 973–978 CrossRef CAS.
- H. A. Shindy, M. A. El-Maghraby and F. M. Eissa, Synthesis, Photosensitization and Antimicrobial Activity of Certain Oxadiazine Cyanine Dyes, Dyes Pigm., 2006, 70, 110–116 CrossRef CAS.
- M. Guo, P. Diao, Y. J. Ren, F. S. Meng, H. Tian and S. M. Cai, Photoelectrochemical Studies of Nanocrystalline TiO2 Co-Sensitized by Novel Cyanine Dyes, Sol. Energy Mater. Sol. Cells, 2005, 88, 23–35 CrossRef CAS.
- K. Sayama, S. Tsukagoshi, K. Hara, Y. Ohga, A. Shinpou, Y. Abe, S. Suga and H. Arakawa, Photoelectrochemical Properties of J Aggregates of Benzothiazole Merocyanine Dyes on a Nanostructured TiO2 Film, J. Phys. Chem. B, 2002, 106, 1363–1371 CrossRef CAS.
- X. Y. Chen, J. H. Guo, X. J. Peng, M. Guo, Y. Q. Xu, L. Shi, C. L. Liang, L. Wang, Y. L. Gao, S. G. Sun and S. M. Cai, Novel Cyanine Dyes with Different Methine Chains as Sensitizers for Nanocrystalline Solar Cell, J. Photochem. Photobiol., A, 2005, 171, 231–236 CrossRef CAS.
- Z. S. Wang, Y. Cui, K. Hara, Y. Dan-oh, C. Kasada and A. Shinpo, A High-Light-Harvesting-Efficiency Coumarin Dye for Stable Dye-Sensitized Solar Cells, Adv. Mater., 2007, 19, 1138–111 CrossRef CAS.
- Q. H. Yao, F. S. Meng, F. L. Li, H. Tian and C. H. Huang, Photoelectric Conversion Properties of Four Novel Carboxylated Hemicyanine Dyes on TiO2 Electrode, J. Mater. Chem., 2003, 13, 1048–1053 RSC.
- F. S. Meng, Q. H. Yao, J. G. Shen, F. L. Li, C. H. Huang, K. C. Chen and H. Tian, Novel Cyanine Dyes with Multi-carboxyl Groups and their Sensitization on Nanocrystalline TiO2 Electrode, Synth. Met., 2003, 137, 1543–1544 CrossRef CAS.
- W. H. Zhan, W. J. Wu, J. L. Hua, Y. H. Jing, F. S. Meng and H. Tian, Photovoltaic properties of new cyanine-naphthalimide dyads synthesized by ‘Click’ chemistry, Tetrahedron Lett., 2007, 48, 2461–2465 CrossRef CAS.
- S. Ito, T. Kitamura, Y. Wada and S. Yanagida, Facile Fabrication of Mesoporous TiO2 Electrodes for Dye Solar Cells: Chemical Modification And Repetitive Coating, Sol. Energy Mater. Sol. Cells, 2003, 76, 3–13 CrossRef CAS.
- Hagfeldt and M. Grätzel, Light-Induced Redox Reaction in Nanocrystalline Systems, Chem. Rev., 1995, 95, 49–68 CrossRef CAS.
- N. Koumura, Z. S. Wang, S. Mori, M. Miyashita, E. Suzuki and K. Hara, Alkyl-Functionalized Organic Dyes for Efficient Molecular Photovoltaics, J. Am. Chem. Soc., 2006, 128, 14256–14257 CrossRef CAS.
- C. J. Barbè, F. Arendse, P. Comte, M. Jirousek, F. Lenzmann, V. Shklover and M. Grätzel, Nanocrystalline Titanium Oxide Electrode for Photovoltaic Application, J. Am. Ceram. Soc., 1997, 80, 3157–3171 CAS.
| This journal is © The Royal Society of Chemistry and Owner Societies 2008 |