Performance and low temperature behaviour of hydrous ruthenium oxide supercapacitors with improved power densities
Xiaorong
Liu
and
Peter G.
Pickup
*
Department of Chemistry, Memorial University of Newfoundland, St. John's, Newfoundland, Canada A1B 3X7. E-mail: ppickup@mun.ca; Fax: +1 709-737-3702; Tel: +1 709-737-8657
First published on 5th August 2008
Abstract
The performances of hydrous Ru oxide supercapacitors have been characterized by cyclic voltammetry, constant current discharge, and impedance experiments. The effective series resistance (ESR) was reduced to 0.10 Ω cm2 by using a Nafion®NRE 211 separator, providing a power density of over 100 kW kg−1 at 5 W h kg−1, calculated for discharge from 1.0 to 0.5 V. The maximum energy density was 21.8 W h kg−1 (31.2 W h kg−1 for discharge to 0 V). Both the ESR and electrode ionic resistance increased exponentially with decreasing temperature, while the specific capacitance decreased linearly from 770 F g−1 at 40 °C to 690 F g−1 at −40 °C. At −40 °C the energy loss at 500 W kg−1 was 15% relative to +25 °C.
Introduction
In recent years, supercapacitors (also called ultracapacitors or electrochemical capacitors) have become an active research subject due to their long life cycle, highly reversible charge–discharge capability, and high power density.1–5 In general, supercapacitors are classified as double layer capacitors and pseudocapacitors. Double layer capacitors store charge at the interface between the electrolyte and electrodes. In contrast, Faradaic reactions occur within the active materials of electrodes in pseudocapacitors during the charge–discharge processes.2,4 Among materials with pseudocapacitive behaviors, Ru oxide has been attracting huge interest due to its excellent capacitive behavior and good conductivity. Since Zheng and coworker6,7 first reported that the specific capacitance of hydrous Ru oxide synthesized by a sol–gel method reached over 720 F g−1, many alternative preparation approaches have been investigated. These include cathodic eletrodeposition,8 an oxidative synthesis with H2O2,9electrophoretic deposition,10,11 and voltammetric deposition.9,12 Jang et al.10 reported that the specific capacitance of Ru oxide can reach 734 F g−1 by electrophoretic deposition of 0.19 mg cm−2, and its energy density and power density reached 25 W h kg−1 and 21 kW kg−1, respectively.High gravimetric capacitance and high gravimetric energy and power density have been obtained by many researchers; however, these results are mainly based on low Ru oxide electrode loadings. Jang et al.10,11 reported that the specific capacitance decreases with increasing Ru oxide loading. For example, a specific capacitance of 599 F g−1 was obtained for a 0.64 mg cm−2 loading of Ru oxide, but this decreased to 350 F g−1 for a 1.7 mg cm−2 loading. This was ascribed to poor mechanical stability of the electrodes. We have addressed this problem by adding Nafion to the Ru oxide layers as a proton conducting binder, and have reported a specific capacitance of 682 F g−1 from impedance spectroscopy at a loading of 50 mg cm−2.13
Although Ru oxide appears to offer outstanding potential for use in supercapacitors, and particularly in high power devices with aqueous acid electrolytes, there is little data in the open literature on the performances of Ru oxide supercapacitors. Zheng et al.7 reported a supercapacitor with a Ru oxide specific capacitance of 768 F g−1 at 5 mA cm−2, and later14,15 reported an energy density of 26.7 W h kg−1 and power density of 10 kW kg−1 at 20 W h kg−1 with a carbon black additive. We have reported a specific capacitance of 977 F g−1 for a Ru oxide supercapacitor based on constant current (1 mA cm−2) discharging. Energy and power densities were enhanced by improving proton conductivity using Nafion ionomer as a binder.13 The best energy density was 31.2 W h kg−1, with a maximum average (based on discharge to 0 V) power density of 31.5 kW kg−1 obtained at 4.2 W h kg−1.
In this paper, further characterization of Ru oxide supercapacitors is provided, with an emphasis on the effect of the separator. The power densities of the supercapacitors have been increased significantly. A preliminary study of the low temperature performance of the supercapacitors is also reported.
Results and discussion
Operating potential window
Supercapacitors were initially characterized by cyclic voltammetry in order to estimate capacitances and determine the useable potential window. Fig. 1 shows that the specific capacitance obtained increased with increasing potential window. With higher potential limits, more Ru oxide is involved in the redox processes, and the average change in oxidation state of the Ru is increased. However, as the limit is increased beyond 1.4 V (or −1.4 V, since this is a symmetrical device), an increasing amount of irreversible charge is passed. For the cycling to 1.4 V and back to 0 V, 93% of the charge passed on the forward (charging) scan was recovered on the reverse scan, while this fell to 83% for cycling to 1.5 V and 53% for cycling to 1.6 V.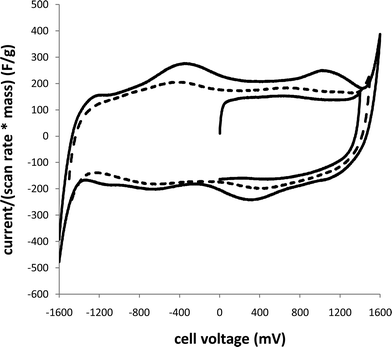 | ||
| Fig. 1 Cyclic voltammograms (20 mV s−1) of a Ru oxide supercapacitor over different potential windows. The current scale has been converted to a specific capacitance scale by dividing by the scan rate and total mass of Ru oxide (10 mg). | ||
Although these results indicate that operation of the supercapacitor at voltages up to 1.4 V is feasible, the work reported here was restricted to 1.0 V operation to minimize the effects of irreversible processes.
The effect of the separator on performance
Use of Nafion (and other ionomer) membranes in supercapacitors has been explored by a number of groups,16–21 and we13 have found it to work particularly well with Ru oxide. Since the separator plays a crucial role in determining the performance of a supercapacitor, we have characterized devices with a variety of commercial separators (Nafion®N-115, Nafion-112, Nafion NRE-211 and Celgard 3400 (Celgard Inc.)) by constant current discharging, impedance spectroscopy and cyclic voltammetry.| Mass of Ru oxide/mg | Separator | Thickness/μm | ESR/Ω | R I/Ω | C s a | |
|---|---|---|---|---|---|---|
| Impedance/F g−1 | Cyclic voltammetry/F g−1 | |||||
| a Values in parenthesis are single electrode values. | ||||||
| 10.34 | Nafion 115 | 127 | 0.33 | 0.3 | 141 (563) | 165 (662) |
| 10.24 | Celgard 3400 | 25 | 0.27 | 0.2 | 125 (499) | 126 (501) |
| 10.94 | Nafion NRE-211 | 25 | 0.17 | 0.1 | 138 (552) | 161 (642) |
| 10.23 | Nafion 112 | 51 | 0.22 | 0.2 | 135 (540) | 157 (629) |
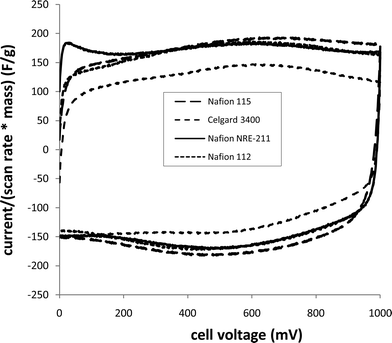 | ||
| Fig. 2 Cyclic voltammograms (20 mV s−1) of Ru oxide (10 mg) supercapacitors with different separators. | ||
 | ||
| Fig. 3 Constant current charging and discharging (at 1 mA) curves for a supercapacitor with 10.72 mg of Ru oxide and a Nafion NRE-211 separator. | ||
 | ||
| Fig. 4 Constant current charging and discharging (at 1 A) curves for a supercapacitor with 10.20 mg of Ru oxide and a Nafion NRE-211 separator. | ||
At 1 mA (Fig. 3), charging and discharging of the supercapacitor to a maximum voltage of 1 V was very reproducible, with no significant differences between the times (and charges) for charging and discharging, nor between consecutive charging/discharging cycles. The specific capacitance of the device was 196 F g−1 (784 F g−1 for each electrode).
At 1 A (Fig. 4), both charging and discharging were accompanied by a large instantaneous jump in potential due the effective series resistance (ESR) of ca. 170 mΩ (as determined by impedance spectroscopy and reported in Table 1). Total energy densities and average power densities for discharge of the supercapacitors to 0 V were obtained from the constant current discharging data by integrating and averaging, respectively, the power (iV) over the total discharge time. These energy and power values were divided by the combined mass of Ru oxide on the two electrodes (ca. 10 mg).
Ragone plots derived from results for cells with different separators are shown in Fig. 5. It can be seen that the total energy and average power depend significantly on the separator employed. The highest energy density was obtained with a Nafion®N-115 separator (31.2 W h kg−1 at 1 mA cm−2), while the lowest energy density was obtained with the Celgard separator (23.4 W h kg−1 at 1 mA cm−2). The other Nafion® separators gave intermediate energy densities.
 | ||
| Fig. 5 Ragone plots for Ru oxide (ca. 10 mg) supercapacitors with different separators. Measurements were made by constant current discharge from 1.0 V. | ||
The maximum power density of a supercapacitor is determined by its ESR and is given by Pmax = V2/4ESR.22 Based on the ESR values in Table 1, power should increase with decreasing Nafion thickness from Nafion 115 to Nafion NRE-211, and this is seen in the data shown in Fig. 5. Celgard 3400 should be intermediate between Nafion 115 and Nafion 112, but is in fact no better than Nafion 115. This can be attributed to the fact that the power densities shown in Fig. 5 are averages for full discharge, and therefore contain an influence from the ionic conductivity of the Ru oxide layers. Clearly, this is influenced by the nature of the separator (i.e.Nafionvs. Celgard). The combined effects of the lower ESR with Nafion®NRE 211 and better Ru oxide electrochemistry improve average power density (34.3 kW kg−1) by 20% at 1 A cm−2 (183 A g−1) relative to Celgard (28.5 kW kg−1). Moreover, the energy density at this discharge rate was improved by 120%, from 6.4 W h kg−1 to 14.2 W h kg−1.
The Ragone plots shown in Fig. 5 are based on discharge of the supercapacitors to 0 V, which is scientifically the most objective measurement. However, the high voltage performance of the supercapacitor is most important from a practical perspective and so Ragone plots are often based on discharge to half of the initial voltage. Such data are shown for the best device in Fig. 6, together with data for discharge to 0 V. In this particular case, the ESR had been decreased to 0.101 Ω by use of NRE-211 and a thinner (0.1 mm) carbon fibre paper support, plus reduction of lead resistances. The maximum average power density of 114 kW kg−1 achieved, for discharge to 0.5 V, was limited by the 2 A current capability of the potentiostat. At an energy density of 10 W h kg−1, the power densities for full (61 kW kg−1) and half (60 kW kg−1) discharge were almost the same. The best energy density obtained for discharge from 1.0 V to 0.5 V was 21.8 W h kg−1 at 1 mA for the device with a Nafion-115 separator.
 | ||
| Fig. 6 Ragone plots for a Ru oxide (10.14 mg) supercapacitor with a NRE-211 separator. Measurements were made by constant current discharge from 1.0 V. | ||
 | ||
| Fig. 7 Complex plane impedance plots for Ru oxide supercapacitors with various separators. The total loading of Ru oxide was ca. 10 mg. | ||
The Nyquist plots in Fig. 7 all have the expected shape for porous electrodes,23 consisting of a ca. 45° intermediate region and a ca. 90° low frequency region. The sum of the ionic resistances of the two capacitive layers (RI) corresponds to three times the length of the 45° degree region on the real axis.24 Values from the data in Fig. 7 are presented in Table 1.
Table 1 shows that the lowest ionic resistance for the Ru oxide layers (RI) was 0.13 Ω, obtained for Nafion NRE-211. Curiously, the Ru oxide ionic resistance appears to increase with increasing thickness of the Nafion separator. The Ru oxide resistance with the Celgard separator was intermediate between the values for Nafion 112 and Nafion 115. Thus RI follows the same trend as the ESR.
Limiting series capacitances obtained at 5 mHz from the impedance data are listed in Table 1. Although the Nafion 115 supercapacitor had the highest ESR and Ru oxide resistance, it yielded the highest specific capacitance. Celgard 3400 gave the lowest specific capacitance.
The influence of the Nafion separator thickness on the ESR, reported in Table 1, is straight forward. It follows a linear dependence, indicating that there are not significant differences in conductivities. The intercept at zero thickness is 0.14 Ω, and this represents the combined resistances of other components. This resistance (i.e. ESR − Rseparator) was decreased to ca. 0.07 Ω for the results in Fig. 6 and can be decreased further with optimization, and use of larger area electrodes.
The apparent influence of the Nafion separator thickness on the electrode resistances reported in Table 1 is difficult to understand, since the thickness of the separator should not influence the bulk ionic conductivity of the electrodes. Again it follows a linear relationship, paralleling the change in ESR. Some insight into the origin of this effect can be obtained by inspection of the impedance data when plotted as series capacitance vs. resistance (real impedance), as shown in Fig. 8, where the ESR has been subtracted to leave just the resistances of the electrodes.
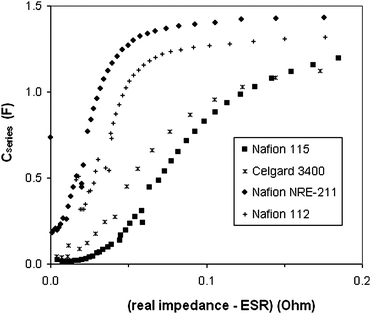 | ||
| Fig. 8 Capacitance plots derived from the impedance data shown in Fig. 7. | ||
It can clearly be seen from the data in Fig. 8 that accessing the capacitance of the Ru oxide layers involved more resistance as the thickness of the Nafion separator was increased. The increasing capacitances in these plots reflect the charging and discharging of a greater fraction of the Ru oxide layers as the frequency was decreased, and the effects of the ac perturbation probe deeper into each Ru oxide layer from its interface with the Nafion separator (since the ionic resistance of the layer limits its charging/discharging rate13). The slopes of the Cseriesvs. R plots are proportional to the ion conductivity of the Ru oxide layers,24 and it is clear that this decreased as the thickness of the Nafion was increased. The curves also shift to higher resistances with increasing thickness, indicating that there is an additional resistance that is not associated with significant capacitance. The presence of this resistance is most obvious for Nafion 115 in the 0 to 0.05 Ω region. This corresponds to a small arc centred at ca. 0.34 Ω in the Nyquist plot (Fig. 7), and is most likely due to charge transfer resistances either within the Ru oxide layers (i.e. at the Ru oxide/H2SO4(aq) interface) or at the Ru oxide + H2SO4(aq)/Nafion interfaces. How the thickness of the separator can influence these resistances is currently unclear. Further investigation has revealed that the apparent resistance of the electrodes (bulk + interfacial) when Nafion 115 is used can be decreased by increasing the compression of the cell, although it remains higher than for NRE-211 or Nafion-112.
The effect of operating temperature on the performance of a Ru oxide supercapacitor
Variable temperature experiments were carried out by using a 5 M (33%) H2SO4 electrolyte. The cell was immersed in a 5 M H2SO4 + dry ice bath to obtain temperatures below ambient. Nyquist plots obtained at selected operating temperatures are shown in Fig. 9. ESR values and ionic resistances for the Ru oxide layer obtained from these plots are shown in Fig. 10 as a function of temperature. Both increased exponentially with decreasing temperature with the effect being much more pronounced for the Ru oxide resistance. The specific capacitance of the Ru oxide, measured by constant current discharge at 10 mA dropped linearly from 770 F g−1 at 40 °C to 690 F g−1 at −40 °C (Fig. 11). Fig. 12 shows plots of energy vs. time for selected discharge experiments at 10 mA. Decreasing the temperature from +25 °C to −18 °C resulted in an energy loss of only 5% at an average power density of 530 W kg−1 which was not changed by the decrease in temperature. At −40 °C the average power dropped to 500 W kg−1 and the energy loss was 15% relative to the +25 °C data.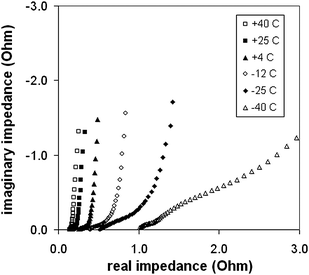 | ||
| Fig. 9 Variable temperature complex plane impedance plots for a supercapacitor with 9.2 mg of Ru oxide, a 5 M H2SO4 electrolyte, and a Nafion NRE-211 separator. | ||
 | ||
| Fig. 11 Specific capacitance vs. temperature from the impedance data in Fig. 9. | ||
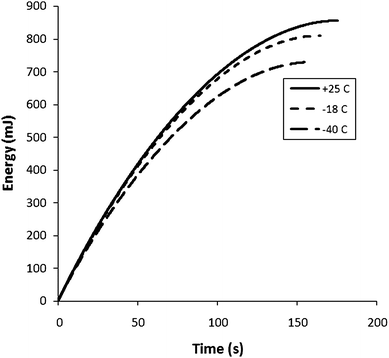 | ||
| Fig. 12 Energy vs. time plots for constant current discharge (10 mA) of a Ru oxide (9.2 mg) supercapacitor (5 M H2SO4 electrolyte; Nafion NRE-211 separator) at various temperatures. | ||
Although low temperature operation of supercapacitors is important for many applications, there is limited data in the literature.14,25–31 Zheng and Jow14 reported a ca. 20% loss of capacitance for Ru oxide between +20 °C and −52 °C, which is significantly larger than the 10% loss from +40 °C to −40 °C seen in Fig. 11. Their increase in ESR of a factor of ca. 7 (+73 °C to −52 °C) is similar to the factor of 8 seen in Fig. 10. Gualous et al.25 have reported a 4-fold increase in ESR from 40 °C to −40 °C for a carbon/organic electrolyte supercapacitor, with an 18% loss of capacitance from +25 °C to −35 °C. On the other hand, Liu et al.28 have reported much smaller temperature effects with acetonitrile as the electrolyte, and Brandon et al.31 have shown that increases in ESR can be mitigated by use of various electrolyte blends. Du Pasquier et al.26 have reported a 32% loss of energy density at 1000 W kg−1, when a carbon supercapacitor was operated at −20 °C. An energy loss of ca. 50% at 500 W kg−1 at −40 °C was reported for a hybrid supercapacitor with activated carbon and Li4Ti5O12electrodes.27 The loss of only 15% at −41 °C and an average power density of 500 W kg−1 (5% at −18 °C) reported in Fig. 12 therefore appears to be quite low.
Experimental
Preparation of hydrous Ru oxide powder
Hydrous Ru oxide was prepared by a sol–gel method as described previously.13 Samples were annealed in air at 110 °C for 3 h which was found to give the highest specific capacitance. X-ray diffraction showed the oxide to be amorphous, however, annealing at 250 °C produced the characteristic pattern for RuO2, as previously reported.6 According to many literature reports (e.g. ref. 7, 32, and 33) the approximate formula for hydrous Ru oxide annealed at 110 °C is RuO2·xH2O with x ∼ 0.7–0.9, while x falls to ca. 0.1–0.4 at 250 °C. The mass loss between 110 and 250 °C for our sample was 9.2% which is consistent with x decreasing from ca. 0.9 to 0.15. We can therefore assign an approximate formula of RuO2·0.9H2O to the Ru oxide used here.Electrode preparation
Ru oxide, an equal mass of 5% of Nafion® solution (DuPont) as binder, and a few drops of deionized water were ground to form a paste, which was then painted onto a 1 cm2 disc of carbon fibre paper (Toray™ Carbon Paper, TGP-H-090) with known mass. Electrodes were allowed to dry in air, and then dried for a further 10 min at 110 °C. In the calculations of specific capacitance, energy density and power density, only the mass of Ru oxide was considered. In most cases, values for the combined mass of Ru oxide on both electrodes are reported. However, estimates of single electrode specific capacitances are also presented to allow for comparison with literature values. These are taken to be four times the device values because the device has double the mass of Ru oxide and its capacitance is half of the capacitance of each electrode.Supercapacitors
Supercapacitors were constructed by sandwiching a Nafion® film or Celgard separator between two equivalent 1 cm2Ru oxide electrodes. Two titanium plates built into polycarbonate blocks were used as current collectors. The assembly was immersed in a 1 M or 5 M sulfuric acid electrolyte. Air was not excluded.Electrochemical characterization
Cyclic voltammetry and constant current charging/discharging were run in 2-electrode mode (reference lead connected to the counter electrode) by using a EG&G273A Potentiostat/Galvanostat or Solartron 1286 Potentiostat/Galvanostat. Impedance spectroscopy was conducted on supercapacitors in 2-electrode mode by using the EG&G273A potentiostat/galvanostat, a EG&G 5210 lock-in amplifier and EG&G PowerSuite software. The frequency range was from 10 kHz to 5 mHz or 1 mHz, with an amplitude of 10 mV and a DC bias potential of 1 V.Conclusions
High performance supercapacitors have been constructed with Ru oxide and a Nafion NRE-211 separator. A practical (to Vinitial/2) power density of over 100 kW kg−1 at 5 W h kg−1 has been achieved with a 1 cm2 device at 10 mg of Ru oxide cm−2. Ru oxide supercapacitors with a 33% H2SO4 electrolyte and a Nafion separator have been shown to offer attractive low temperature performances.The high power performance (Fig. 6) of the optimized Ru oxide supercapacitor reported here is greatly increased over our recently published results.13 An average power density of 61 kW kg−1 has been achieved at an energy density of 10 W h kg−1 (ca. 60 kW kg−1 for discharge to Vinitial/2 at 10 W h kg−1), which is 165% higher than the 23 kW kg−1 at the same energy density reported in ref. 13. The improvement in power density has been achieved primarily by decreasing the ESR by decreasing the Nafion separator thickness, decreasing the carbon fibre paper thickness, and minimizing the effects of lead resistances. The resistances of the Ru oxide electrodes (RI) have also been decreased by use of the thinner Nafion separator. Further improvements can be achieved by using large area electrodes and higher voltage operation.
All of the power and energy density data presented here are for discharging from 1 V. However, operation at voltages up to ca. 1.4 V appears to be feasible, as shown in Fig. 1. The 1 A cycling data to 1.2 V in Fig. 4 show good reversibility with the charge obtained on the discharging segments averaging 95% of the charge passed during the charging segments. Further evaluation of higher voltage operation is currently in progress.
Acknowledgements
This work was supported by Defence Research and Development Canada, the Natural Sciences and Engineering Council of Canada (NSERC) and Memorial University.References
- B. E. Conway, Electrochemical Supercapacitors, Kluwer, New York, 1999 Search PubMed.
- R. Kotz and M. Carlen, Electrochim. Acta, 2000, 45, 2483 CrossRef CAS.
- M. Winter and R. J. Brodd, Chem. Rev., 2004, 104, 4245 CrossRef CAS.
- R. A. Huggins, Solid State Ionics, 2000, 134, 179 CrossRef CAS.
- A. F. Burke, Proc. IEEE, 2007, 95, 806 CrossRef.
- J. P. Zheng and T. R. Jow, J. Electrochem. Soc., 1995, 142, L6 CAS.
- J. P. Zheng, P. J. Cygan and T. R. Jow, J. Electrochem. Soc., 1995, 142, 2699 CAS.
- B. O. Park, C. D. Lokhande, H. S. Park, K. D. Jung and O. S. Joo, J. Power Sources, 2004, 134, 148 CrossRef CAS.
- W. C. Fang, J. H. Huang, L. C. Chen, Y. L. O. Su and K. H. Chen, J. Power Sources, 2006, 160, 1506 CrossRef CAS.
- J. H. Jang, A. Kato, K. Machida and K. Naoi, J. Electrochem. Soc., 2006, 153, A321 CrossRef CAS.
- J. H. Jang, K. Machida, Y. Kim and K. Naoi, Electrochim. Acta, 2006, 52, 1733 CrossRef CAS.
- C. C. Hu and Y. H. Huang, Electrochim. Acta, 2001, 46, 3431 CrossRef CAS.
- X. Liu and P. G. Pickup, J. Power Sources, 2008, 176, 410 CrossRef CAS.
- J. P. Zheng and T. R. Jow, J. Power Sources, 1996, 62, 155 CrossRef CAS.
- J. P. Zheng, Electrochem. Solid-State Lett., 1999, 2, 359 CrossRef CAS.
- P. Staiti, M. Minutoli and F. Lufrano, Electrochim. Acta, 2002, 47, 2795 CrossRef CAS.
- M. Morita, J. L. Qiao, N. Yoshimoto and M. Ishikawa, Electrochim. Acta, 2004, 50, 837 CrossRef CAS.
- P. Staiti and F. Lufrano, Electrochim. Acta, 2007, 53, 710 CrossRef CAS.
- R. Y. Song, J. H. Park, S. R. Sivakkumar, S. H. Kim, J. M. Ko, D. Y. Park, S. M. Jo and D. Y. Kim, J. Power Sources, 2007, 166, 297 CrossRef CAS.
- A. L. M. Reddy, F. E. Amitha, I. Jafri and S. Ramaprabhu, Nanoscale Res. Lett., 2008, 3, 145 Search PubMed.
- W. J. Kim and D. W. Kim, Electrochim. Acta, 2008, 53, 4331 CAS.
- W. G. Pell and B. E. Conway, J. Power Sources, 1996, 63, 255 CrossRef CAS.
- R. De Levie, in Advances in Electrochemistry and Electrochemical Engineering, ed. P. Delahay and C. W. Tobias, Interscience, New York, 1967, vol. 6, pp. 329–397 Search PubMed.
- M. C. Lefebvre, R. B. Martin and P. G. Pickup, Electrochem. Solid-State Lett., 1999, 2, 259 CrossRef CAS.
- H. Gualous, D. Bouquain, A. Berthon and J. M. Kauffmann, J. Power Sources, 2003, 123, 86 CrossRef CAS.
- A. Du Pasquier, I. Plitz, S. Menocal and G. Amatucci, J. Power Sources, 2003, 115, 171 CrossRef CAS.
- I. Plitz, A. DuPasquier, F. Badway, J. Gural, N. Pereira, A. Gmitter and G. G. Amatucci, Appl. Phys. A, 2006, 82, 615 CrossRef CAS.
- P. Liu, M. Verbrugge and S. Soukiazian, J. Power Sources, 2006, 156, 712 CrossRef CAS.
- M. W. Verbrugge and P. Liu, J. Electrochem. Soc., 2006, 153, A1237 CrossRef CAS.
- S. C. Pang, M. A. Anderson and T. W. Chapman, J. Electrochem. Soc., 2000, 147, 444 CAS.
- E. J. Brandon, W. C. West, M. C. Smart, L. D. Whitcanack and G. A. Plett, J. Power Sources, 2007, 170, 225 CrossRef CAS.
- W. Sugimoto, H. Iwata, K. Yokoshima, Y. Murakami and Y. Takasu, J. Phys. Chem. B, 2005, 109, 7330 CrossRef CAS.
- A. Foelske, O. Barbieri, M. Hahn and R. Kotz, Electrochem. Solid-State Lett., 2006, 9, A268 CrossRef CAS.
| This journal is © The Royal Society of Chemistry 2008 |

