Design and fabrication of a chemically-stable proton conductor bilayer electrolyte for intermediate temperature solid oxide fuel cells (IT-SOFCs)
Emiliana
Fabbri
a,
Daniele
Pergolesi
a,
Alessandra
D'Epifanio
a,
Elisabetta
Di Bartolomeo
a,
Giuseppe
Balestrino
b,
Silvia
Licoccia
a and
Enrico
Traversa
*a
aNAST Center & Department of Chemical Science and Technology, University of Rome Tor Vergata, Via della Ricerca Scientifica, 00133, Rome, Italy. E-mail: traversa@uniroma2.it
bINFM-CNR Coherentia & Department of Mechanical Engineering, University of Rome Tor Vergata, Via del Politecnico, 00133, Rome, Italy
First published on 23rd June 2008
Abstract
Bilayer electrolytes made of barium cerate covered with a thin film of barium zirconate deposited by pulsed laser deposition show promise for improving chemical stability without greatly affecting electrochemical performance in fuel cell operation.
The high operating temperatures (900–1000 °C) of conventional solid oxide fuel cells (SOFCs) using yttria-stabilized zirconia as electrolyte lead to difficult thermal management, degradation of materials, limits in selecting interconnecting materials, and slow start up and cool down.1–3 To overcome these problems, efforts are being made to develop electrolytes that can operate at intermediate temperatures (IT, 500–700 °C). Most of the studies on IT-SOFCs are based on doped ceria and lanthanum gallate as oxygen-ion conductors,4,5 while recently more effort has been dedicated to electrolytes based on high temperature proton conductors (HTPCs).6–8 SOFCs, whose electrolyte is an oxygen-ion conductor, produce water at the fuel-side electrode. The dilution of the fuel in water reduces the cell efficiency. SOFCs using HTPC electrolytes eliminate this problem generating water at the cathode.9 Therefore, the use of HTPCs allows reduction of the operating temperature without compromising the cell efficiency.
Several perovskite-type oxides, such as doped BaCeO3, SrCeO3, BaZrO3, and SrZrO3, show proton conductivity in hydrogen and water vapour containing atmospheres.10–12 However, none of these compounds concurrently satisfies two of the essential requirements for IT-SOFC application: high proton conductivity and good chemical stability under the fuel cell operating environment. BaCeO3-based protonic conductors, e.g., BaCe1−xYxO3−δ, are the best performing HTPCs in terms of proton conductivity (about 10−2 S cm−1 at 600 °C), although they suffer from poor chemical stability due to degradation in the presence of acidic gases (e.g., CO2) and steam, precluding their practical use as electrolytes in fuel cells.7,13,14 BaZrO3-based protonic conductors, e.g., BaZr1−xYxO3−δ, exhibit good chemical stability,15 but their proton conductivity is too low (about 10−3 S cm−1 at 600 °C) for practical use,6,7 due to the blocking effect of grain boundaries. Therefore, recently a variety of research activities have been devoted to finding the best compromise between high proton conductivity and chemical stability, coupling the properties of cerates and zirconates by realizing solid solutions of the two compounds.7,13,16–21
In this paper we followed a different and simpler approach: a highly conductive and chemically stable proton conductor electrolyte was developed by protecting a sintered Y-doped barium cerate pellet with a thin Y-doped barium zirconate layer. The overall performance of the bilayer electrolyte turned out to be of great interest.
The bilayer electrolyte was fabricated using a 1 mm thick pellet of BaCe0.8Y0.2O3−δ (BCY) as a substrate for a 1 μm thick BaZr0.8Y0.2O3−δ (BZY) film grown by pulsed laser deposition (PLD). Fig. 1 shows the X-ray diffraction (XRD) pattern of the BZY–BCY bilayer electrolyte, which evidenced the concurrent identification of the BCY and BZY perovskite structures. In fact, BCY is a distorted perovskite oxide with an orthorhombic structure (a = 6.24 Å, b = 6.23 Å, and c = 8.76 Å), while BZY has a cubic cell with crystal lattice parameter of about 4.20 Å. These measured parameters are consistent with literature data.7,21,22 The identification of the crystalline reflections from the BCY substrate was obtained considering the pseudo-cubic lattice of its orthorhombic perovskite structure, which has a crystal lattice constant of about 4.38 Å, close to the cubic lattice parameter of BZY. Using the BCY pseudo-cubic cell, the reflection lines of the two crystalline structures in the XRD plot (Fig. 1) could be grouped in pairs, each of them referring to the same string of Miller indices.
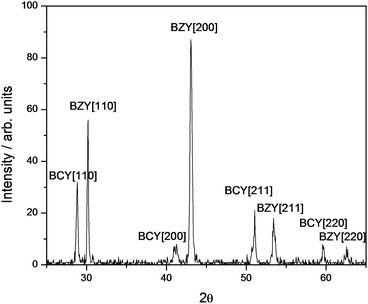 | ||
| Fig. 1 XRD pattern of the BZY-BCY bilayer electrolyte. | ||
Fig. 2 shows the cross-section field emission SEM (FE-SEM) micrograph of the bilayer electrolyte. The BZY was fully dense and homogeneously deposited on the BCY pellet substrate. The pellet–coating interface was very well defined and sharp. The SEM analysis, together with the interpretation of the XRD analysis, gave a strong indication of an epitaxial grain by grain growth. Energy dispersive X-ray spectroscopy (EDX) line measurements performed on the cross-section of as-prepared samples showed the absence of interdiffusion between Ce and Zr, within the limits of the technique.
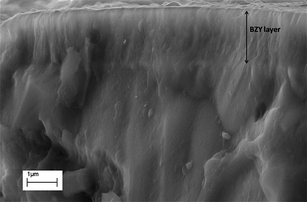 | ||
| Fig. 2 Cross-section FE-SEM micrograph of the BZY–BCY bilayer electrolyte. | ||
The chemical and physical properties of the BZY–BCY bilayer electrolyte were investigated to ascertain whether they met three independent, but converging requirements: (1) the BZY layer must be able to protect the BCY pellet against interaction with CO2; (2) since it has been demonstrated that BZY and BCY can form a solid solution,7,13,16–21 the electrolyte concept under investigation makes mandatory the study of the possible interdiffusion of the two materials with time and temperature, which could end with dilution of Zr into the remaining BCY matrix; (3) the presence of a new interface along the charge carriers path could result in a bottle-neck effect with consequent and unforeseen implications on the charge transport (rise and depletion charge regions, low conductivity).
The chemical stability in the presence of CO2 was tested exposing the BZY-protecting layer to 100% CO2 atmosphere at 900 °C for 3 hours and investigating the treated sample by XRD analysis.
Barium cerate can indeed react both with carbon dioxide and water vapour according to the following reactions:
| BaCeO3 + CO2 → BaCO3 + CeO2 | (1) |
| BaCeO3 + H2O → Ba(OH)2 + CeO2 | (2) |
However, barium cerate reacts more easily with CO2 than with water vapour, and reaction (2) is not significant at the operating temperatures (400–700 °C) expected for a fuel cell.23 For these reasons, the discussion on the chemical stability of the bilayer electrolyte has been limited to reaction (1). The reactivity of the electrolyte with CO2 was also tested to evaluate the possibility of using the bilayer electrolyte with hydrocarbon fuels, like methane; using methane instead of hydrogen will generate CO2 at the anode side.
Fig. 3 shows the XRD patterns of the bilayer electrolyte and as a comparison of a BCY pellet, without protecting layer, after and before the same CO2 thermal treatment. The BCY pellet decomposed in BaCO3 and CeO2 during the CO2 thermal treatment, whereas the BZY–BCY bilayer sample remained unchanged. This result demonstrated that the BZY layer is able to protect the BCY electrolyte against CO2, even when the bilayer is exposed to 100% CO2 at 900 °C. XRD analysis was also used to check the stability of the bilayer from the point of view of chemical interdiffusion. Referring to Fig. 1, the (110) reflections from the BZY cubic cell and the BCY pseudo-cubic cell can be identified around 2θ = 30.10° and 28.85°, respectively, being among the most intense reflection lines. The (110) reflection line of BCY–BZY solid solution compounds would fall between the above reflections, being the precise 2θ value determined by the relative content between Ce and Zr.16–18 The BZY–BCY bilayer pellet was thermally treated in air in five steps: after 3 days at 700 °C, the bilayer was subsequently kept at 800, 900, 1000, and 1100 °C, and held at each temperature for 24 hours. XRD patterns were acquired after each thermal step. In the case of thermally-activated dilution of Zr into the BCY pellet, a progressive reduction in the BZY (110) reflection intensity and eventually the presence of the characteristic peaks of the solid-solution compounds would be expected on analysing the XRD plots of the BZY–BCY bilayer electrolyte after each thermal treatment. Fig. 3(d) shows the XRD plot after the last thermal treatment. As can be seen, the XRD plots before (Fig. 1) and after the described severe thermal treatments show basically the same polycrystalline heterostructure, without any evidence of interdiffusion. Therefore, within the limits of XRD analysis, the formation of a solid solution can be discarded even after thermal treatments up to 1100 °C.
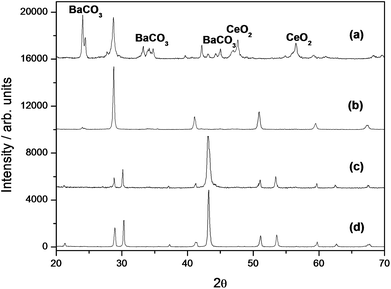 | ||
| Fig. 3 XRD patterns of BCY pellet after CO2 treatment (a), BCY pellet (b), BZY–BCY bilayer after CO2 treatment (c), and BZY–BCY bilayer after thermal treatment (d). | ||
Fig. 4 shows the measured ionic conductivity of the bilayer electrolyte in wet H2 (∼3% vol. H2O), together with the conductivities of BCY and BZY pellets reported as a reference. At high temperatures (T ≥ 650 °C), the conductivity of the bilayer approached the values of the BCY pellet. At 700 °C, for example, the ionic conductivity of the BZY–BCY bilayer was 1.25 × 10⁻² S cm−1 and for the BCY was 1.47 × 10⁻² S cm−1. At the same temperature the BZY pellet showed a much lower conductivity (5.68 × 10⁻³ S cm−1). The activation energy for proton transport, calculated for temperatures below 700 °C (it is well known that above 700 °C these HTPCs show a decreasing proton solubility, resulting in a weaker conductivity–temperature dependence6), was slightly larger for the BZY–BCY bilayer with respect to the BCY pellet (0.43 eV versus 0.35 eV, respectively). Consequently, the difference in conductivity increased as the temperature approached the lowest measured values. The activation energy for the BZY pellet was 0.58 eV, significantly larger than the value obtained for the bilayer electrolyte.
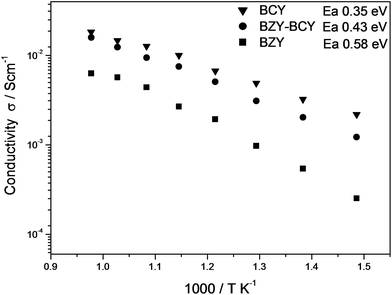 | ||
| Fig. 4 Electrical conductivity of the BZY–BCY bilayer in humidified H2 in comparison with BCY and BZY electrolytes in the same operating conditions. | ||
Fig. 5 shows the I–V curve and the power density output from humidified hydrogen–air fuel cell experiments at 700 °C for the BZY–BCY bilayer electrolyte. For comparison, the fuel cell performance of single cells using BCY and BZY electrolytes is also shown. All the electrolyte pellets were 1 mm thick. For all the samples, platinum was used as the material for the electrodes, both anode and cathode. The open circuit voltage (OCV) was 0.9 V in the case of the BZY electrolyte and very close to 1 V for the BCY and the BZY–BCY bilayer electrolytes. The larger OCV values obtained for the BCY and BZY–BCY bilayer electrolytes suggested that no gas leakages were present in these electrolytes. This fact is in agreement with the SEM analysis that clearly showed the higher density of the BCY pellet and also of the protecting BZY layer. On the other hand, the BZY pellet was more difficult to sinter and its density was slightly lower.24
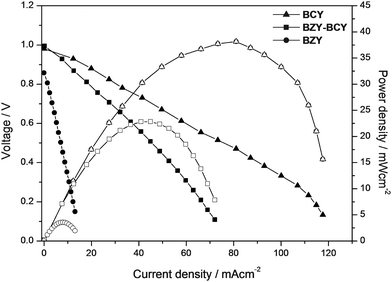 | ||
| Fig. 5 I–V curves and power density output from humidified H2–ambient air fuel cell tests at 700 °C of the BZY–BCY bilayer, BCY and BZY electrolytes. | ||
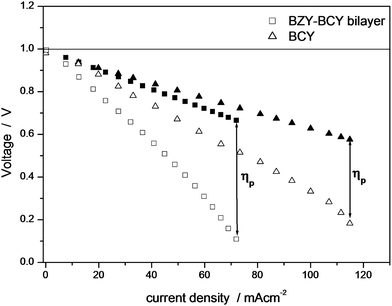
The maximum power output of the BZY–BCY bilayer was significantly lower than the value recorded for the BCY electrolyte. The slightly lower conductivity of the bilayer cannot explain this finding. The ohmic electrolyte resistance as well as the electrode polarization resistance contribute to the voltage loss during fuel cell discharge. Electrochemical impedance spectroscopy (EIS) measurements were performed in situ during the fuel cell tests to further clarify this point. Fig. 6 shows the typical EIS complex impedance plane plots for the BCY and BZY–BCY bilayer based fuel cells measured at 700 °C under open circuit voltage conditions. The intercept with the real axis at high frequencies represents the ohmic electrolyte resistance (Rohmic), whereas the difference between the high frequency and low frequency intercepts with the real axis represents the sum of the electrode (anode and cathode) reaction resistances.17 A significantly large difference in the electrode-reaction resistance rather than in the ohmic electrolyte resistance was recorded for the two samples. The close ohmic resistance of the two electrolytes is consistent with the small difference in their electrical conductivity values measured at 700 °C (Fig. 4). In fact, Fig. 7 compares the polarization curves (open symbols) with the ohmic (iR) losses (filled symbols), which were estimated from the BCY and the BZY–BCY bilayer electrolyte resistance (Rohmic) measured by EIS. The modulus of the difference between the values of the two curves taken at the same current density gives a measure of the electrode overpotential (ηp, indicated in Fig. 7 with vertical arrows). The iR losses of the two electrolytes were very close, while the polarization drop at the Pt electrodes (ηp) was significantly larger for the bilayer electrolyte than for BCY.
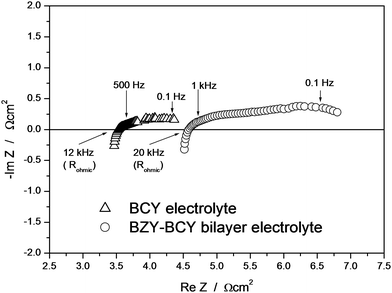 | ||
| Fig. 6 EIS plots of the BCY and BZY–BCY bilayer based fuel cells measured at 700 °C under open circuit conditions. | ||
 | ||
| Fig. 7 I–V curves (open symbols), iR loss curves (filled symbols) and electrode polarization (ηp) of the BCY and BZY–BCY bilayer electrolyte based fuel cells with Pt electrodes at 700 °C under humidified H2 and air. | ||
This finding clearly showed that problems are caused by the Pt–BZY interface, as already reported in the literature, where layer cracking and peeling off during the sintering step can occur due to weak attachment of the Pt layer to the BZY surface and thermal expansion mismatch.25 These problems do not usually occur at the Pt–BCY interfaces. However, to further clarify this point, EIS measurements of symmetric Pt/electrolyte/Pt cells, using BCY and BZY pellets as electrolyte, were performed under humidified hydrogen and ambient air atmosphere to determine the area specific resistance (ASR) of Pt electrodes in anodic or cathodic environments.21 The ASR values of the Pt electrode were found to be larger using BZY electrolyte with respect to BCY both in wet H2 and ambient air. In particular, at 700 °C, the operating temperature of the fuel cell tests, the ASR of the Pt electrode increased in air from 0.36 Ω cm2 to 1.51 Ω cm2 and in hydrogen from 0.67 Ω cm2 to 2.11 Ω cm2 using BCY and BZY electrolytes, respectively.21 The larger ASR of the Pt electrodes over the BZY electrolyte confirms that it was the cathode-electrode reaction, occurring at the BZY protecting layer side, that significantly hindered the fuel cell performance of the BZY–BCY bilayer electrolyte with respect to the BCY electrolyte-based fuel cell.
However, it must be highlighted that, maintaining the same chemical stability of BZY,15,21,24 the bilayer electrolyte is able to produce a power density more than one order of magnitude larger than the BZY electrolyte, even without using proper electrodes. Therefore, the BZY–BCY bilayer electrolyte turned out to be a promising solution to obtain a stable proton conductor electrolyte without greatly compromising the electrical conductivity with respect to the better performing BCY electrolyte. Further control in the interface microstructure and BZY film thickness might increase the power output performance, although it seems that the main challenge will be the selection of a more suitable cathode material at the interface with BZY.
Methods
Pellets preparation
A sol–gel process described elsewhere21,24 was used for preparing BaCe0.8Y0.2O3−δ (BCY) and BaZr0.8Y0.2O3−δ (BZY) oxide powders. The starting materials were commercial Ba(NO3)2 (3% H2O, Aldrich, 99.999%), (CH3CO2)xZr(OH)y (Aldrich), Ce(NO3)3·6H2O (Aldrich 99.9%) and Y(NO3)3·6H2O (Aldrich 99.9%); citric acid was used as chelating agent. The synthesized powders were calcined for 5 hours with a heating rate of 5 °C min−1 at 1100 °C for BZY and 1000 °C for BCY. To obtain dense pellets, the powders were uniaxially pressed into cylindrical pellets at 250 MPa for 10 minutes and then sintered for 8 hours in air at 1600 °C and 1500 °C for BZY and BCY, respectively.PLD deposition of thin BZY layer
The PLD system consists of a high vacuum stainless steel chamber equipped with a turbo molecular pump, with a base pressure of about 5 10−5 Pa. An oxygen inlet line allows the setting of the required O2 partial pressure during the PLD deposition. A KrF excimer laser with a wavelength of 248 nm and a pulse width of 25 ns is focused on the target material in a spot area of about 3 mm2. The BZY target was mounted on a target carousel, while the BCY substrate pellet was glued with Ag print on a stainless steel removable substrate holder. A radiant heater set the temperature of the substrate holder up to about 650 °C during the deposition and the Ag print paste ensured the thermal contact between the sample holder and the deposition substrate. One of the surfaces of a 1 mm thick BCY pellet, used as deposition substrate, was polished with standard size P1000 and P2500 silicon carbide grinding paper, using ethanol as lubricant. A laser fluency of about 5 J cm−2, with a repetition rate of 10 Hz, was used. The substrate temperature was 650 °C, the target to substrate distance was 25 mm, while the oxygen partial pressure was set at about 10 Pa. With the described set of deposition parameters, an ablation rate of about 3 Å s−1 was achieved and a 1 μm thick coating was deposited in about 60 min. By means of field emission scanning electron microscopy (FE-SEM), several surface and cross section micrographs were acquired to study the morphology of the samples, particularly at the interface between the two materials, using energy dispersive (EDX) analysis to study the chemical composition.Chemical stability
The chemical stability of the BZY–BCY bilayer pellet was investigated from the point of view of the interdiffusion of the two materials at their interface and the interaction of the BZY covered surface with CO2. To study the possibility of chemical interdiffusion between BZY and BCY oxides, the samples were left in a tubular furnace for 72 h at 700 °C, and subsequently for 24 h at 800, 900, 1000, and 1100 °C. After each thermal treatment the phase composition of the bilayer electrolyte was investigated by X-ray diffraction (XRD) analysis. The chemical stability in the presence of CO2 was tested exposing the BZY face to pure CO2 at 900 °C for 3 h. The CO2 thermally treated sample was analyzed by XRD, looking for possible formation of barium carbonates and Zr–Ce oxides at the exposed surface.Electrochemical characterization
Two symmetrical Pt electrodes were deposited by applying porous platinum paste (Heraeus, CL11-5100) onto both sides of the samples for the measurements of the conduction properties, electrode resistance, and the acquisition of the I–V curves. To achieve a good electrode/electrolyte contact, the Pt/electrolyte samples were fired at 800 °C for 2 hours in air. Electrical conductivity measurements were performed in humidified hydrogen (∼3% vol. H2O) using electrochemical impedance spectroscopy (EIS) with a multichannel potentiostat VMP3 (Princeton Applied Research) in the frequency range between 500 kHz and 0.1 Hz. EIS measurements were also used to calculate the area specific resistance (ASR) of the Pt/electrolyte interfaces. The ASR is calculated from the electrode resistance (Rp) by ASR = (Rp*A)/2, where A is the geometrical electrode area, divided by 2 because symmetrical cells were used. ASR measurements were performed in ambient air and humidified hydrogen (∼3% vol. H2O). Fuel cell tests were carried out at 700 °C exposing the anode surface (BCY pellet) to wet (∼3% vol. H2O) hydrogen and the cathode (BZY protecting layer) to ambient air. The samples were affixed to the end of an alumina tube with a gas tight ceramic paste seal (Aremco 552). Gold wires as current collectors were fixed with platinum paste on the top of the anode and cathode.The authors gratefully acknowledge funding by the Ministry of University and Research (MiUR) of Italy (FISR Project “Polymer and Ceramic Electrolytes for Fuel Cells: System Validation and Development of New Materials”, and a PRIN project).
References
- B. C. H. Steele, J. Mater. Sci., 2001, 36, 1053 CrossRef CAS.
- A. Boudghene Stambouli and E. Traversa, Renewable Sustainable Energy Rev., 2002, 6, 433 CrossRef.
- S. C. Singhal, Solid State Ionics, 2002, 152–153, 405 CrossRef CAS.
- M. Dokiya, Solid State Ionics, 2002, 152–153, 383 CrossRef CAS.
- O. Yamamoto, Electrochim. Acta, 2000, 45, 2423 CrossRef CAS.
- H. G. Bohn and T. Schober, J. Am. Ceram. Soc., 2000, 83, 768 CAS.
- K. Katahira, Y. Kohchi, T. Shimura and H. Iwahara, Solid State Ionics, 2000, 138, 91 CrossRef CAS.
- K. D. Kreuer, St. Adams, W. Munch, A. Fuchs, U. Klock and J. Maier, Solid State Ionics, 2001, 145, 295 CrossRef CAS.
- H. Iwahara, Y. Asakura, K. Katahira and M. Tanaka, Solid State Ionics, 2004, 168, 299 CrossRef CAS.
- H. Iwahara, Solid State Ionics, 1995, 77, 289 CrossRef CAS.
- H. Iwahara, Solid State Ionics, 1996, 86–88, 9 CrossRef CAS.
- T. Norby, Solid State Ionics, 1999, 125, 1 CrossRef CAS.
- K. H. Ryu and S. M. Haile, Solid State Ionics, 1999, 125, 355 CrossRef CAS.
- S. V. Bhide and A. V. Virkar, J. Electrochem. Soc., 1999, 146, 2038 CrossRef CAS.
- A. D'Epifanio, E. Fabbri, E. Di Bartolomeo, S. Licoccia and E. Traversa, Solid-State Ionics, 2006, Mater. Res. Soc. Symp. Proc., 2007, 972, 31–36 CAS.
- T. Shimada, C. Wen, N. Taniguchi, J. Otomo and H. Takahashi, J. Power Sources, 2004, 131, 289 CrossRef CAS.
- C. Zuo, S. Zha, M. Liu, M. Hatano and M. Uchiyama, Adv. Mater., 2006, 18, 3318 CrossRef CAS.
- A. K. Azad and J. T. S. Irvine, Solid State Ionics, 2007, 178, 635 CrossRef CAS.
- X. Ma, J. Dai, H. Zhang and D. E. Reisner, Surf. Coat. Technol., 2005, 200, 1252 CrossRef CAS.
- S. Tao and J. T. S. Irvine, Adv. Mater., 2006, 18, 1581 CrossRef CAS.
- E. Fabbri, A. D'Epifanio, E. Di Bartolomeo, S. Licoccia and E. Traversa, Solid State Ionics, 2008, 179, 558 CrossRef CAS.
- K. Namura and H. Kageyama, Solid State Ionics, 2007, 178, 661 CrossRef.
- S. M. Haile, G. Staneff and K. H. Ryu, J. Mater. Sci., 2001, 36, 1149 CrossRef CAS.
- A. D'Epifanio, E. Fabbri, E. Di Bartolomeo, S. Licoccia and E. Traversa, Fuel Cells, 2008, 8, 69 CrossRef CAS.
- J. M. Serra and W. A. Meulenberg, J. Am. Ceram. Soc., 2007, 90, 2082 CrossRef CAS.
| This journal is © The Royal Society of Chemistry 2008 |