Electrochemical oxidation of solid carbon in hybrid DCFC with solid oxide and molten carbonate binary electrolyte
Received
20th March 2008
, Accepted 13th May 2008
First published on 17th June 2008
Abstract
The hybrid direct carbon fuel cell (HDCFC) with solid oxide and molten carbonate binary electrolyte merges solid oxide fuel cell (SOFC) and molten carbonate fuel cell technologies to achieve direct conversion of solid carbon to electric power. The purpose of this study is to investigate in detail the electrochemistry of the oxidation of solid carbon in the carbon/carbonate slurry in the HDCFC. A planar test cell has been fabricated employing conventional SOFC materials and a eutectic carbonate mixture of lithium carbonate and potassium carbonate. The HDCFC with a model fuel, carbon black XC-72R, shows very high open circuit voltages (OCVs), approximately 1.5 V at 550–700 °C, especially after a high temperature operation at 900 °C, where carbonate decomposes to O2− and CO2. The carbon/carbonate slurry increases the active reaction zone from a two-dimensional Ni/YSZ anode to a three-dimensional slurry and significantly enhances the carbon oxidation. The high OCV is probably due to the low activity of CO2 in the slurry, which results from the recombination of CO2 and O2−. Gaseous products were analysed using an online gas chromatograph, and CO2 and CO were detected, with their selectivity found to be dependent on temperature. Solid carbon is electrochemically oxidised to CO2 and the final distribution of the products is dominated by the equilibrium of the Boudouard reaction (C + CO2 ⇄ 2CO).
1. Introduction
Fuel
cell technology offers many advantages based on its high energy efficiency and scalability. One of the main difficulties for current fuel cell systems, especially those based on hydrogen, is low energy density. The use of solid carbon as a fuel in direct carbon fuel cells (DCFCs) would certainly remove this problem as the energy density of carbon is higher than alternative sources available both on a volumetric1 and a mass density2 basis. Carbon fuels can be obtained from coal, cracking of hydrocarbons, or pyrolysis of biomass. Biomass is a very attractive energy source in terms of renewable energy.
The DCFC itself has a long history.3 The first report relating to DCFC was in 1896 by Jacques.4 This fuel cell used molten hydroxide as the electrolyte, operating in the temperature range of 400–500 °C. It, however, suffered from poisoning due to the build up of carbonate in the electrolyte. More recently, DCFCs using molten carbonate electrolyte have been reported,2,5–7 as the stability, ionic conductivity and thermal properties of carbonates for molten carbonate fuel cell (MCFC) applications have been widely investigated since the 1960s.8 The DCFCs with molten carbonate, however, require complex CO2 management and cathode materials that are tolerant to molten carbonate at high temperature. The DCFCs based on solid oxide fuel cell (SOFC) technology have also been reported.9–12 It is, however, difficult to get sufficient interaction between solid carbon fuel and solid electrode/electrolyte.
The hybrid direct carbon fuel cell (HDCFC) with a binary electrolyte merges SOFC and MCFC technologies.13–15 A solid oxide electrolyte is employed to separate the cathode and anode compartments while a molten carbonate electrolyte is utilised in the anode compartment. Oxygen is reduced to O2− at the cathode and transported across the solid electrolyte membrane to the carbon/carbonate slurry, where carbon is oxidised. The ideal overall reaction is the oxidation of carbon to carbon dioxide:
This concept has some advantages in comparison to normal MCFC and SOFC. CO2 circulation, which is required in normal MCFC, is not necessary. The cathode is not exposed to carbonate; therefore, the cathode materials already developed for SOFC applications are available. An enhancement of carbon oxidation by the carbonate slurry can be expected.
We have already demonstrated this concept using tubular HDCFCs,14,15 which are suitable for practical demonstrations, with some model fuels including biomass based fuel. It is, however, difficult to determine the exact nature of the anode reaction with those tubular cells because the active area of the electrolyte/electrode and the state of active sites are difficult to be certain of in a closed cell above temperatures where the carbonate has melted. The purpose of this study is to investigate, in detail, the electrochemistry of the oxidation of solid carbon in the carbon/carbonate slurry using a test cell with planar geometry. Investigating the HDCFC reaction over a specific anode with small area should contribute to better understanding of the anode reaction. A test cell was fabricated employing standard materials for SOFC: a yttria-stablilized zirconia (YSZ) electrolyte, Ni/YSZ cermet anode, and (La0.8Sr0.2)0.95MnO3 (LSM) cathode. A eutectic carbonate mixture of lithium carbonate and potassium carbonate was utilised for the molten carbonate.
2. Experimental
Solid electrolyte and electrodes
YSZ pellets (2 mm thickness and 20 mm diameter) were prepared from YSZ powder (8-YSZ, Pi-Kem) by sintering at 1500 °C. A NiO/YSZ (NiO 325 mesh, Aldrich; NiO : YSZ = 8 : 2 weight) anode and a LSM/YSZ composite cathode were applied on opposite surfaces of the YSZ pellet by screen printing. The LSM/YSZ cathode consists of 3 layers: the 1st and 2nd layers contain 50% LSM ((La0.8Sr0.2)0.95MnO3, Praxair), and the 3rd layer contains 100% LSM for current collection. The sintering temperature of the anode and cathode were 1300 and 1250 °C, respectively. The surface area of the sintered electrodes was 1.13 cm2. Fig. 1 shows a cross section of the Ni/YSZ cermet anode taken with a scanning electron microscope (JEOL JSM-5600). The thickness of the anode was approximately 20 μm.
Test cell
Fig. 2 shows a schematic diagram of the test cell. For current collection, a gold mesh and a gold wire for the cathode, and another gold wire for the anode were attached to the pellet using gold paste (Metalor Technologies T10112). The pellet was attached to an alumina tube with a ceramic paste (Aremco 668). The gold paste was sintered at 900 °C before the carbon/carbonate mixture was added. Electrochemical oxidation of solid carbon in this study was carried out under batch fuel conditions. Two types of carbon black were used as model fuels: Super-S (Timcal; 45 m2 g −1) and XC-72R (Cabot; 250 m2 g −1). A eutectic mixture of 62 mol% Li2CO3 (Sigma-Aldrich) and 38 mol% K2CO3 (Fisher) were mixed with a carbon (carbon : carbonate = 1 : 1 mol) and put into the cell at room temperature. The standard amount of the carbon/carbonate mixture was 1.9 g, which is equivalent to about 3 cm height of powder. Ar gas (100 ml min −1) was fed to the anode compartment, and the cathode was exposed to static air.
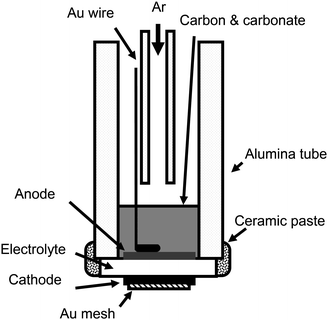 |
| | Fig. 2 Schematic diagram of the test cell. | |
Electrochemical measurement
Electrochemical measurements were carried out using a potentiostat and frequency response analyser system (Solartron 1280B). The measurement was started at 900 °C and then the temperature was decreased stepwise to 550 °C, unless otherwise stated. All electrochemical measurements were started once a steady OCV had been achieved, typically after 15–30 min, at each temperature. I–V curves were measured by potential sweep at a scan rate of 1 mV s −1. AC impedance at open circuit voltage (OCV) was measured over the frequency range 105–10−2 Hz with an AC amplitude of 20 mV.
Symmetrical cell
Impedance measurements with a symmetrical cell were also carried out to characterise the cathode performance. A symmetrical pellet was fabricated by applying the same cathodes and current collectors as the HDCFC on both sides of a YSZ pellet (2 mm thick, 20 mm diameter).
Products analysis
Gaseous products were carried by the Ar purge and analysed using an online gas chromatograph (Micro GC 3000, Agilent) equipped with two capillary columns: MolSieve 5A PLOT with He carrier for CO detection and PLOT U with He carrier for CO2 detection. Current efficiency (CE) for each product is defined, as in| |  | (2) |
Here, nO is the number of oxygen in a product molecule, F is the Faraday constant, r and r0 are the formation rates at anodic and open-circuit conditions, and I is the current. r0 is subtracted from r to exclude the influence of non-electrochemical reaction on current efficiency.
The powder mixtures after electrochemical measurements were analysed with an X-ray diffractometer (STOE STADI-P) in transmission mode.
3. Results and discussion
Performance tests with binary electrolyte
Initial performance tests were carried out using Super-S. Two different amounts of the carbon/carbonate mixture were tested to clarify how effectively the carbon/carbonate slurry enhanced the carbon oxidation. Fig. 3 shows the I–V curves at 900 and 700 °C measured with 0.63 and 1.9 g of the Super-S/carbonate slurry. In all cases, the HDCFC with the binary electrolyte showed high OCVs, over 1.2 V. The cell performance showed a significant dependence on the amount of the slurry. The maximum outputs at 900 °C were 13.0 and 6.9 mW cm −2 with 1.9 and 0.63 g of the slurry, respectively.
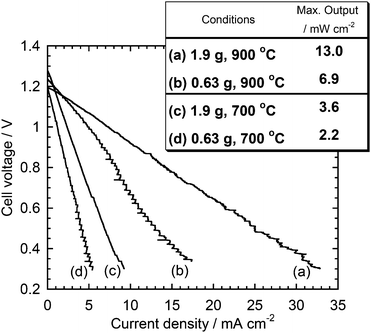 |
| | Fig. 3 Effect of the amount of the carbon/carbonate slurry on the I–V cures at 900 and 700 °C. Carbon: Super-S. | |
Fig. 4 shows the impedance spectra at OCV with different amounts of slurry. Area specific resistances (ASRs) evaluated from the slope of I–V curves are also plotted for comparison. The curves did not terminate in the measured frequency range (105 to 10 −2 Hz). The measurement at lower frequency was difficult because the data was noisy. The curves can be extrapolated with a depressed semi-circle terminating around the ASR values from the I–V curves. Series resistance values were low enough to suggest that the polarisation resistance limited the performance of the test cell. The performance of the cathode used in this study was characterised separately using a symmetrical set up and the ASRs are shown in Table 1. Most of the polarisation resistance in the impedance of the HDCFC seems to be due to the anode polarisation as the ASRs of the LSM cathode shown in Table 1 are low compared to those of the whole cell. These suggest that the anodic polarisation resistance limited the cell performance and that this was significantly decreased by increasing the amount of the carbon/carbonate slurry.
Table 1 Polarisation resistance (Rp) of the cathode measured using a symmetrical cell
| Temperature/°C |
550 |
600 |
700 |
800 |
900 |
|
R
p/Ω cm2 |
50.4 |
13.0 |
1.6 |
0.34 |
0.07 |
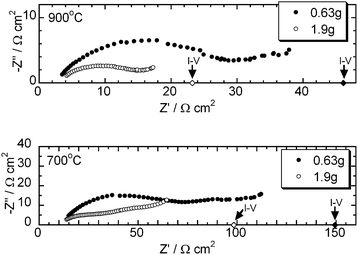 |
| | Fig. 4 Effect of the amount of the carbon/carbonate slurry on the impedance spectra at 900 and 700 °C. (◆, ◇): ASR values at OCV from the I–V curves. Carbon: Super-S. | |
The HDCFC system with Super-S but without carbonate was also tested. Fig. 5 shows the I–V curves of the HDCFC without carbonate. At 800 °C and higher, the cell without carbonate indeed showed a good performance. This performance presumably resulted from the electrochemical oxidation of CO that was produced in the reverse Boudouard reaction:9,12
The test cell without carbonate, however, did not work below those temperatures. This is reasonable because the reverse Boudouard reaction is not thermodynamically spontaneous at 700 °C or lower.
16 This result suggests that the normal SOFC design requires quite high temperature to oxidise solid carbon directly.
Fig. 6 shows a comparison of the maximum outputs between the DCFCs with and without carbonate. The HDCFC with the binary electrolyte shows a significant advantage at 550–700 °C.
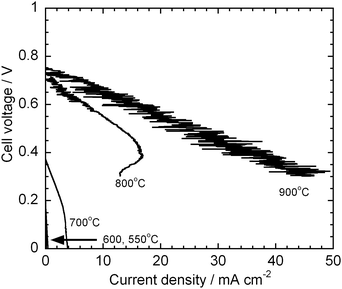 |
| | Fig. 5
I–V curves with Super-S but without carbonate at 550–900 °C. | |
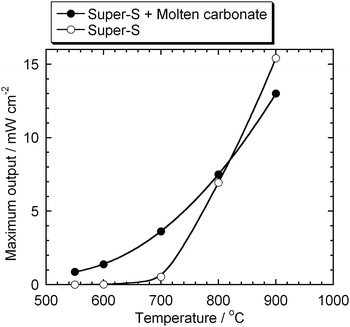 |
| | Fig. 6 Comparison between the maximum outputs of the DCFCs with and without carbonate. | |
The significant effect of the carbon/carbonate slurry would suggest that the carbon oxidation occurs not only on the Ni anode but also in the slurry. Carbon and molten carbonate probably work as a current collector and an ion conductor, respectively, for the electrochemical oxidation in the slurry.
Different carbon fuels
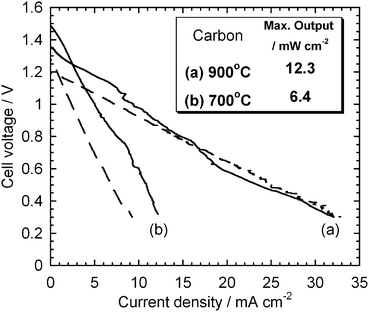
Two different types of carbon black were tested to investigate how the specific surface area of the carbon fuel affected the HDCFC performance. Fig. 7 shows the I–V curves measured with another carbon black XC-72R, which has a higher specific surface area than Super-S, at 700 and 900 °C. Remarkably, XC-72R showed even higher OCVs, 1.35 and 1.50 V at 900 and 700 °C, respectively. The maximum output with XC-72R were 12.6 and 6.4 mW cm−2 at 900 and 700 °C, respectively. The higher specific surface area of carbon improved the cell performance at 700 °C but no significant difference was observed at 900 °C.
 |
| | Fig. 7
I–V curves measured with CX-72R. Dashed line: the curves with Super-S. | |
After performing the measurement, shown in Fig. 7, the test cell was operated for 10 h at 0.5 V and 700 °C as a short term stability test. Fig. 8 shows the changes in current density with elapsed time during the potentiostatic operation at 0.5 V. After the rapid degradation at the early stage, the current density slightly increased, and then gradually decreased. The current density after 10 h was 10.3 mA cm −2, while that found in the I–V curve in Fig. 7, at the start of the experiment, was 10.9 mA cm −2. These suggest that the HDCFC with the binary electrolyte could be operated with a stable performance at least for 10 h.
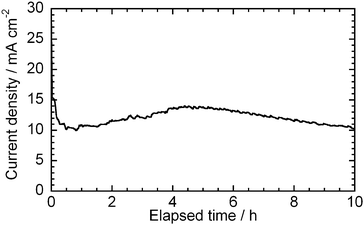 |
| | Fig. 8 Change in current density with elapsed time at 0.5 V and 700 °C after the operation at 900 °C. Carbon: XC-72R. | |
Thermal history and formation of active species
As shown above, the HDCFC with the binary electrolyte shows very high OCVs, which are much higher than the theoretical standard potential of carbon combustion (1.02 V at 800 °C). Herein, the importance of the thermal history of the HDCFC is discussed.
Fig. 9 shows the effect of thermal history on OCVs of the HDCFC with the binary electrolyte and XC-72R. Theoretical standard potentials for possible overall reactions were evaluated using a thermodynamic calculation software package16 and plotted in the figure for comparison. When the electrochemical measurement was started at 900 °C, the test cell showed the high OCV values as described above. On the other hand, when started from 550 °C, the cells did not show as good OCV as those from 900 °C. Fig. 10 shows the effect of the thermal history on the fuel cell performance with XC-72R. The cell performance was drastically improved, as indicated by the high OCVs after high temperature operation.
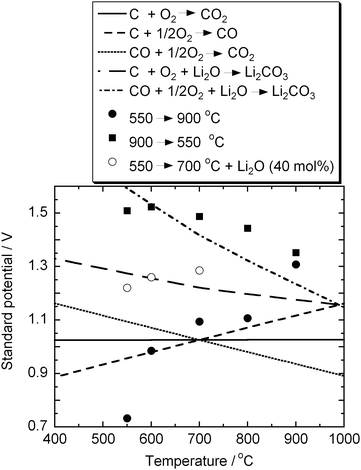 |
| | Fig. 9 Effect of the thermal history on OCVs measured with XC-72R, and theoretical standard potentials for possible overall reactions calculated using HSC chemistry 5.1.16 | |
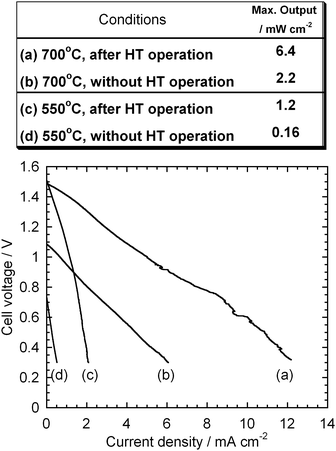 |
| | Fig. 10 Effect of the high temperature (HT) operation on the I–V curves and maximum outputs at 700 and 550 °C. Carbon: XC-72R. | |
The improvement caused by the high temperature operation suggests that some active species are produced around 900 °C. One possible species is O2− produced in the decomposition of carbonate:
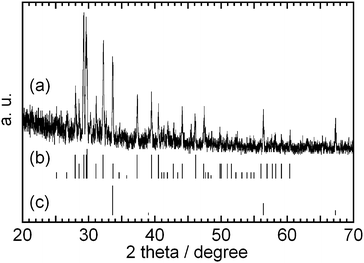
After an electrochemical measurement at 900 °C for about 1 h, the cell was cooled down under an Ar flow, and then the residue was analysed by
X-ray diffraction (
XRD).
Fig. 11 shows a XRD pattern in the 2
θ range 20–70°. Most peaks are assigned to LiKCO
3, which is a reasonable product from the test cell as the LiKCO
3 phase has been reported in the phase diagram of the Li/K carbonate system.
17 Diffraction peaks assigned to Li
2O were also observed suggesting the decomposition of carbonate at 900 °C.
 |
| | Fig. 11
XRD patterns of (a) the powder mixture after the electrochemical measurement at 900 °C, (b) LiKCO3 (JCPDF 34-1148) and (c) Li2O (JCPDF 12-254). | |
The amount of decomposed carbonate can be evaluated by monitoring the gaseous products from the test cell under open-circuit condition. A test cell was heated from room temperature to 900 °C, at the same ramp rate as the other electrochemical measurements, monitoring the formation rates of gaseous products and OCV. Fig. 12 shows the formation rates of CO and CO2, and OCV while heating the test cell. CO2 would be produced by the decomposition of CO32− (eqn (4)) and CO would be by the reverse Boudouard reaction (eqn (3)). The decomposition of carbonate was not fast until the cell temperature reached 700 °C. The OCV at 700 °C was about 1.0 V, which is close to the standard potential of carbon combustion. Once the cell temperature exceeded 700 °C, the formation rate of CO started increasing significantly and the OCV responded accordingly. The formation rate of CO reached 230 μmol min −1 at 900 °C, which is equivalent to about 0.6% min −1decomposition of carbonate, and then gradually decreased. The OCV increased up to 1.4 V after a certain amount of carbonate was decomposed. The electrochemical measurements in this study were normally started at 120 min after starting to heat up the test cell. This means approximately 35% of carbonate has been decomposed before the electrochemical measurements.
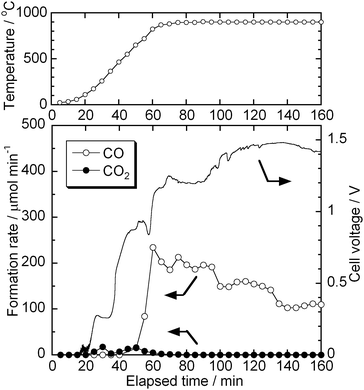 |
| | Fig. 12 Formation rates of CO and CO2, and OCV while heating the test cell. The starting amount of carbonate: 17.9 mmol. | |
The effect of oxide on the OCV can also be experimentally confirmed by adding Li2O to the carbon/carbonate slurry. 40 mol% of Li2O to total carbonate was added to a test cell and it was operated from 550 to 700 °C. As shown in Fig. 9, the cell with Li2O showed higher OCVs than that without Li2O. These experimental data suggest that considerable amounts of carbonate decomposed evolving CO2 at 900 °C and the residual Li2O caused the very high OCV.
Effect of oxide on OCV
The existence of O2− in the carbon/carbonate slurry of the HDCFC could explain the very high OCVs measured after the high temperature operation. O2− can recombine with the electrochemically produced CO2 to form CO32− and keep the activity of the electrochemical product, CO2, in the slurry very low. This could contribute to the high OCV as Nernst potentials of electrochemical reactions depend on the activities of reactants and products.
The effect of the recombination on the OCV can be thermodynamically simulated by considering the activity of CO2 in the carbon/carbonate slurry. If the electrochemical reaction of carbon is selective to CO2, as is discussed in the next section; the OCV would be dominated by the Nernst potential of eqn (1):
| |  | (5) |
Here, Δ
G(1) and Δ
G(1)° are the reaction Gibbs function and the standard reaction Gibbs function of
eqn (1),
n is the number of electrons in the electrochemical reaction, and
a is the activity of each reactant and product.
a(C) would be 1 because carbon is solid and
a(O
2) would be 0.21 because air is used as the
oxidising agent under the experimental condition.
a(CO
2) in the slurry phase would be dominated by the recombination with O
2−. If Li
+ is considered as the counter
cation, the recombination can be described, as in
The standard reaction Gibbs function can be described, as in
| |  | (7) |
Ideally, the thermodynamic properties of Li
2O and Li
2CO
3 dissolved in the slurry require to be described. It is, however, practically difficult to handle the thermodynamic data, as the system is quite complicated. If some solid Li
2O precipitates in the slurry and is under equilibrium with dissolved Li
2O, the thermodynamic data of solid Li
2O with the activity value of 1 can be used to describe the thermodynamics of
eqn (6). This assumption is reasonable as the solubility of O
2− in a eutectic
carbonate mixture has been reported to be up to 0.5 mol%.
17 The data of pure Li
2CO
3 with the activity value of 1 are also used here to simplify the issue. The activity of carbonate would not affect the calculation very much as the liquid phase in the slurry is very similar to the
carbonate melt. The standard chemical potential of molten carbonate in the real system must be lower than that of pure Li
2CO
3 because carbonate is stabilised by forming a eutectic melt. With these two assumptions,
eqn (7) can be converted, as in
| | ΔG(6)° = RT![[thin space (1/6-em)]](https://www.rsc.org/images/entities/char_2009.gif) ln ln![[thin space (1/6-em)]](https://www.rsc.org/images/entities/char_2009.gif) a(CO2) a(CO2) | (8) |
By substituting
eqn (8) from
eqn (5), the Nernst potential of the electrochemical oxidation of carbon can be described, as in
| |  | (9) |
The second and third terms on the right hand side represent the contributions of the activities of CO
2 and O
2, respectively, to the Nernst potential. The contribution of the O
2 activity on the cathode side is not large, −0.038 V (900 °C) at maximum.
Table 2 summarises the contribution of the CO
2 activity dominated by the recombination with
oxide simulated by calculating Δ
G(6)°.
16 As the recombination is a spontaneous reaction, the calculation suggests a positive contribution of the recombination, +0.15–0.25 V, to the Nernst potential. The sum of Δ
G(1)° and Δ
G(6)° in
eqn (9) is equal to the standard reaction Gibbs function of the four electron carbon
oxidation to Li
2CO
3:
| | | C + O2 + Li2O → Li2CO3 | (10) |
The standard potentials of
eqn (10) have been calculated and plotted in
Fig. 9. The calculated potentials are 1.27–1.18 V in the temperature range 550–900 °C.
Table 2 The activity of CO2 dominated by the recombination and its contribution to the Nernst potential
|
T/°C |
a(CO2) |

|
| 550 |
7.77 × 10⁻⁷ |
0.25 |
| 600 |
4.56 × 10⁻⁶ |
0.23 |
| 700 |
8.73 × 10⁻⁵ |
0.20 |
| 800 |
6.12 × 10⁻⁴ |
0.17 |
| 900 |
2.70 × 10⁻³ |
0.15 |
Although there is still a gap of approximately 0.2 V between the calculated and measured potentials, the thermodynamic calculation reproduces the increase in the Nernst potential by the recombination of O2– and CO2. Several reasons can be considered for the gap. At higher temperature, where the reverse Boudouard reaction is spontaneous, the electrochemical reaction may start from CO. The standard potentials of the CO oxidation are also plotted in Fig. 9 and show higher potentials than those for the carbon oxidation, especially if considering the recombination of CO2 and Li2O. The stabilisation of carbonate by forming a eutectic mixture would increase the Nernst potential because the carbonate in the eutectic phase would have lower chemical potential. The difference between the chemical potentials of carbon-black and graphite could also increase the Nernst potential as the chemical potential of graphite was used for the calculation.
Based on the results and calculations shown above, it can be concluded that O2− is produced in the carbon/carbonate slurry at high temperature and contribute to high voltage by trapping CO2.
Gaseous products of HDCFC
It is important to quantify the gaseous products from the HDCFC to understand the reactions occurring at the anode. It should be noted that all gas chromatography in this study was carried out, on heating without any prior high temperature operation. Discussing the gaseous products after the high temperature operations is more difficult and requires further long term testing because O2− produced by the decomposition would trap the electrochemically produced CO2. Without the high temperature operation, it was difficult to obtain enough current to detect gaseous products under fuel cell conditions. The test cell was, therefore, operated in galvanostatic modes, 13.3 mA cm−2 at 550 °C and 26.5 mA cm−2 at 600–700 °C.
Fig. 13 (a) shows the formation rates of CO and CO2 during the galvanostatic and open-circuit conditions at 700 °C. The formation of CO and CO2 at t = 0 shows the decomposition of carbonate at open-circuit condition. After starting the galvanostatic operation, the formation rates of CO and CO2 gradually increased and reached a steady state, and then after stopping current, the formation rates quickly decreased. At both galvanostatic and open-circuit conditions, the main product was CO at this temperature. The slow response of the CO formation may be because carbon oxides were trapped by O2− that had been produced by the decomposition of carbonate. Fig. 13 (b) shows the current efficiencies of the products during the galvanostatic operation. The total current efficiency at the steady state was almost 100%, suggesting that the difference between the formation rates of open-circuit and galvanostatic conditions was equivalent to that expected from the applied current.
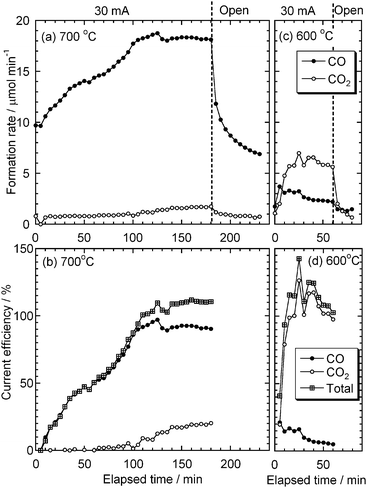 |
| | Fig. 13 (a), (c) Formation rates and (b), (d) current efficiency of CO and CO2 from the test cell at galvanostatic and open-circuit conditions at 700 and 600 °C. Carbon: XC-72R. | |
Fig. 13 (c) shows the formation rates of the products at 600 °C. CO2 was the main product during the galvanostatic operation at this temperature and its formation rate reached a steady state more quickly than the formation rate of CO at 700 °C. Fig. 13 (d) shows the current efficiencies of the products at 600 °C. It is interesting to note that the current efficiency of CO2 at this temperature was almost 100%. This suggests that the electrochemical oxidation under this experimental condition is quite selective to CO2 formation.
Similar experiments were carried out at 550 and 650 °C and the CO2 selectivities are plotted as a function of temperature in Fig. 14. At both galvanostatic and open-circuit conditions, the CO2 selectivity was almost 100% at 550 °C and decreased with increasing temperature. This behaviour has the same trend as the thermodynamic prediction for the Boudouard reaction. Interestingly, between 600 and 650 °C, CO2 selectivity at galvanostatic condition was higher than that at open-circuit condition. This difference and the current density of CO2 shown in Fig. 13 (d) suggest that the electrochemical oxidation in the anode compartment is selective to CO2. It seems that solid carbon is electrochemically oxidised to CO2 and the final distribution of the products is dominated by the equilibrium of the Boudouard reaction.
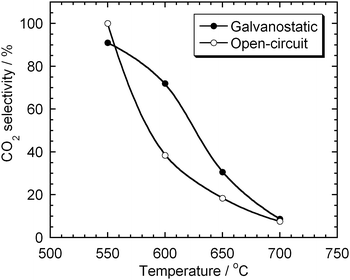 |
| | Fig. 14 CO2 selectivity of the gaseous products from the test cell at galvanostatic and open-circuit conditions. Carbon: XC-72R. | |
Reaction schemes
On the basis of the present experimental results and discussion, two kinds of possible reaction schemes are proposed in Fig. 15.
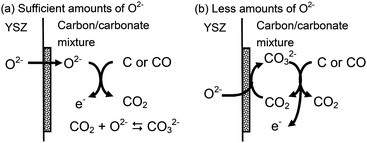 |
| | Fig. 15 Possible reaction schemes of the direct oxidation of solid carbon in the DCFC with (a) sufficient and (b) less amounts of O2− in the carbon/carbonate slurry. | |
As long as sufficient amounts of O2− are supplied and can dissolve into the carbon/carbonate slurry, O2− would work as the main active species directly and oxidise carbon to CO2. When the cell is operated, O2− is supplied from the YSZ electrolyte, and can be carried into the carbon/carbonate mixture where the carbon oxidation occurs. If the concentration of O2− is high enough, produced CO2 could be converted to CO32− so that the CO2 activity in the carbon/carbonate slurry is kept low. It has been reported that O2− up to 0.5 mol% are soluble in a Li–Na–K ternary eutectic carbonate under Ar flow in the temperature range 400–700 °C.18
With lower amounts of O2−, CO32− is probably the main ion carrier in the carbon/carbonate slurry and oxidises carbon to CO2. In this scheme, CO32− is required to be regenerated from O2− and CO2 on the Ni cermet anode. Some CO2 is reported to be physically (CO2) and chemically (C2O52−) soluble in carbonate melts.18,19
In both schemes, electronic/ionic mixed conduction in the carbon/carbonate slurry increases the active reaction zone from a two-dimensional Ni/YSZ anode to three-dimensional slurry and enhances the electrochemical oxidation of carbon to CO2. At higher temperature, the electrochemical oxidation may start from CO produced in the reverse Boudouard reaction (eqn (3)), which is a non-electrochemical reaction. The final distribution of the products is presumably dominated by the equilibrium of the Boudouard reaction.
4. Conclusions
The electrochemistry of the direct oxidation of solid carbon in the HDCFC with solid oxide and molten carbonate binary electrolyte was investigated using a planar test cell. The best outputs with the test cell were 13.0 and 6.9 mW cm − 2 at 900 and 700 °C, respectively. The carbon/carbonate slurry increases the active reaction zone from a two-dimensional Ni/YSZ anode to three-dimensional slurry and significantly enhances the carbon oxidation. The HDCFC with the binary electrolyte shows high OCV, approximately 1.5 V at 550–700 °C, especially after O2− are produced by the decomposition of carbonate at high temperature. O2− or CO32− are probably the main active species of the electrochemical oxidation of solid carbon in the carbon/carbonate slurry. The electrochemical oxidation in the anode compartment is quite selective to CO2 formation, but the final distribution of products is dominated by the equilibrium of the Boudouard reaction.
The very high OCV with molten carbonate implies an interesting prospect for liquid secondary electrolytes. The liquid electrolyte is thought to keep the activity of the electrochemical products quite low and contribute to high OCV. This effect on OCV can be maximised in the case when the liquid phase has some chemical species that can trap the electrochemical products, e.g. O2−, which reacts with CO2 in this system. The effect of O2− was only demonstrated under batch conditions in this study. If the recombination of CO2 and O2− and the formation of O2− by the decomposition of carbonate could be balanced, this mediation process would cycle and show a good fuel cell performance continuously. Further work is required to be done to demonstrate long term stability and to improve the anode performance by optimising the electronic/ionic mixed conduction and catalysis of the carbon/carbonate slurry.
Acknowledgements
The authors would like to thank Scottish Enterprise and EPSRC for funding and Robert Marshall Associates for support. We thank Sneh L. Jain for valuable discussion and assistance.
References
- K. Pointon, B. Lakeman, J. Irvine, J. Bradley and S. Jain, J. Power Sources, 2006, 162, 750 CrossRef CAS.
- S. Zecevic, E. M. Patton and P. Parharni, Carbon, 2004, 42, 1983 CrossRef CAS.
- D. Cao, Y. Sun and G. Wang, J. Power Sources, 2007, 167, 250 CrossRef CAS.
- W. W. Jacques, Harper's Magazine, 1896–1897, 94, 144 Search PubMed.
- D. G. Vutetakis, D. R. Skidmore and H. J. Byker, J. Electrochem. Soc., 1987, 134, 3027 CrossRef CAS.
- W. H. A. Peelen, M. Olivry, S. F. Au, J. D. Fehribach and K. Hemmes, J. Appl. Electrochem., 2000, 30, 1389 CrossRef CAS.
- N. J. Cherepy, R. Krueger, K. J. Fiet, A. F. Jankowski and J. F. Cooper, J. Electrochem. Soc., 2005, 152, A80 CrossRef CAS.
-
J. Larminie and A. Dicks, in Fuel Cell Systems Explained, Wiley and Sons, West Sussex, 2000 Search PubMed.
- N. Nakagawa and M. Ishida, Ind. Eng. Chem. Res., 1988, 27, 1181 CrossRef CAS.
- T. M. Gur and R. A. Huggins, J. Electrochem. Soc., 1992, 139, L95 CrossRef CAS.
- T. Horita, N. Sakai, T. Kawada, H. Yokokawa and M. Dokiya, J. Electrochem. Soc., 1995, 142, 2621 CrossRef CAS.
- M. Ihara and S. Hasegawa, J. Electrochem. Soc., 2006, 153, A1544 CrossRef CAS.
-
A. S. Liplin, I. I. Balachov, L. H. Dubois, A. Sanjurjo, M. C. McKubre, S. Crouch-Baker, M. D. Hornbostel and F. L. Tanzclla, US Pat., Appl. No. 20060019132, 2006.
- S. Jain, B. Lakeman, K. D. Pointon nad and J. T. Irvine, ECS Trans., 2007, 7, 829 Search PubMed.
- S. L. Jain, J. B. Lakeman, K. D. Pointon and J. T. S. Irvine, J. Fuel Cell Sci. Technol., 2007, 4, 280 CrossRef CAS.
- A. Ronie, Outokumpu HSC chemistry 5.1, 2002 Search PubMed.
- G. J. Janz and M. R. Lorenz, J. Chem. Eng. Data, 1961, 6, 321 CrossRef CAS.
- S. White and U. Twardoch, J. Appl. Electrochem., 1989, 19, 901 CrossRef CAS.
- D. Peeters, D. Moyaux and P. Claes, Eur. J. Inorg. Chem., 1999, 1999, 589 CrossRef.
|
| This journal is © The Royal Society of Chemistry 2008 |
Click here to see how this site uses Cookies. View our privacy policy here. 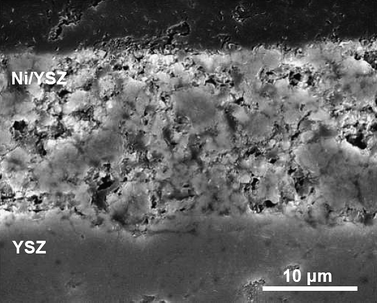


![[thin space (1/6-em)]](https://www.rsc.org/images/entities/char_2009.gif) ln
ln![[thin space (1/6-em)]](https://www.rsc.org/images/entities/char_2009.gif) a(CO2)
a(CO2)


