Small angle X-ray scattering analysis of the effect of cold compaction of Al/MoO3 thermite composites
Joshua A.
Hammons
a,
Wei
Wang
a,
Jan
Ilavsky
b,
Michelle L.
Pantoya
c,
Brandon L.
Weeks
a and
Mark W.
Vaughn
*d
aDepartment of Chemical Engineering, Texas Tech University, Lubbock, TX USA. Fax: 805 742 3552; Tel: 806 742 3553
bAdvanced Photon Source, Argonne National Laboratory, Argonne, IL USA. Fax: 630 252 0862; Tel: 630 252 0866
cDepartment of Mechanical Engineering, Texas Tech University, Lubbock, TX USA. Fax: 805 742 3563; Tel: 806 742 3540
dDepartment of Chemical Engineering, Texas Tech University, Lubbock, TX USA. E-mail: mark.vaughn@ttu.edu; Fax: 805 742 3552; Tel: 806 742 0451
First published on 21st November 2007
Abstract
Nanothermites composed of aluminum and molybdenum trioxide (MoO3) have a high energy density and are attractive energetic materials. To enhance the surface contact between the spherical Al nanoparticles and the sheet-like MoO3 particles, the mixture can be cold-pressed into a pelleted composite. However, it was found that the burn rate of the pellets decreased as the density of the pellets increased, contrary to expectation. Ultra-small angle X-ray scattering (USAXS) data and scanning electron microscopy (SEM) were used to elucidate the internal structure of the Al nanoparticles, and nanoparticle aggregate in the composite. Results from both SEM imaging and USAXS analysis indicate that as the density of the pellet increased, a fraction of the Al nanoparticles are compressed into sintered aggregates. The sintered Al nanoparticles lost contrast after forming the larger aggregates and no longer scattered X-rays as individual particles. The sintered aggregates hinder the burn rate, since the Al nanoparticles that make them up can no longer diffuse freely as individual particles during combustion. Results suggest a qualitative relationship for the probability that nanoparticles will sinter, based on the particle sizes and the initial structure of their respective agglomerates, as characterized by the mass fractal dimension.
1. Introduction
An important application of Al nanoparticles is in improving the efficiency of high-energy thermites. These finely divided mixtures of aluminum and metal oxides are used in welding, metal purification, propellants, and defense applications.1 Recently, thermites composed of Al nanoparticles have been found to have increased oxidation rates and lower ignition temperatures than those composed of micrometer-sized Al particles.2–8 For the case of Al/MoO3 thermites, oxidation is considered to be diffusion controlled,5 so the separation distance and the degree of contact between the two species will impact the kinetics of the reaction.5,7 Accordingly, it might be expected that compression of the Al/MoO3 composite would result in higher burn rates, as is the case for micron-sized Al particles,2 since compression would reduce the distance between species. Surprisingly however, lower burn rates were observed for the compressed composite.2Nanoparticles have a strong tendency to form agglomerates,8–11 and because the degree of contact and separation distance would be affected by the degree of agglomeration, the oxidation kinetics would be correspondingly influenced. For many nanoparticle materials, agglomerate formation is controlled by subjecting the matter to high stresses through high-pressure homogenization, shear flow, or ultrasonication.12–14 Similarly, once a nanoparticle-containing composite has been formed, external stresses from further processing, such as compaction, may also alter the structure of the internal nanoparticles.9
For complex, opaque solid composites such as thermites, only a few techniques are available to access the internal structure of the components. One of these is ultra small angle X-ray scattering (USAXS),15 which is the primary technique used here. However, to interpret the USAXS data, we also need a model of the structure of the composite, which we obtain from scanning electron microscopy (SEM). In what follows, these techniques are used to investigate the structure of Al agglomerates in Al/MoO3 thermite pellets, and elucidate how that structure may influence the burn rate behavior of high density pellets.
Aluminum nanoparticles can form clusters as a result of van der Waals forces. Agglomerates formed as a result of these relatively weak forces are commonly referred to as soft agglomerates.16 Particles that are held together by much stronger chemical bonds, are commonly referred to as hard agglomerates or aggregates.16 In this paper, soft agglomerates will be referred to as agglomerates and hard agglomerates will be referred to as aggregates. These two concepts are of extreme importance for thermite composites. Aggregates would be undesirable for a diffusion controlled reaction, because the entire aggregate would be the diffusing species instead of the individual particles.
The degree to which the particles that make up the agglomerate or aggregate are packed can be expressed in terms of the effective density, ρe, of the agglomerate:
 | (1) |
Small-angle X-ray scattering
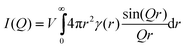
As X-rays are passed through a material, they are (mostly) elastically scattered by the electrons of individual atoms. The constructive interference of these radially scattered X-rays is seen only at certain angles from the sample. The scattering vector, Q, is related to the scattering angle by the equation: | (2) |
 | (3) |
 | (4) |
 | (5) |
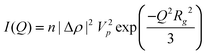
The scattering intensity functions can be simplified at high and low Q. At low Q the scattering intensity will follow Guinier’s approximation, eqn (6), while at high Q the scattering intensity will follow Porod’s law, eqn (7):
 | (6) |
 | (7) |
On a log–log plot of I versus Q, there will be a region in which the scattered intensity will decrease, forming a “knee” in the plot. This “knee” is commonly referred to as the Guinier region; it can be used to resolve the radius of gyration, Rg, of the scattering particles according to eqn (6). Depending on the shape of the particles (i.e. spheres, plates, cylinders), the Rg will represent different aspects of the particles such as radius, thickness or length, but will be unaffected by their orientation. For the materials investigated here, scattering may occur from both plates and spherical particles. The I vs. Q curve for plate-like particles will have two Guinier regions separated by a power law decay of −2; the Guinier region at low Q will be associated with the plate’s planar dimensions, while the Guinier region at high Q will be associated with the plate thickness. If the planar dimensions of the plate are very large, the associated Guinier region will not be seen, since it is too large for even the smallest Q range measurable by USAXS. A spherical particle will contain only one Guinier region. For spheres, the radius of gyration is related to the particle radius, while the Rg is related to the thickness by
 | (8) |
 | (9) |
Agglomerates of nanoparticles can also be characterized using SAS.19 Although agglomerates are not true fractals, they do exhibit a fractal-like nature between the Guinier regions corresponding to the Rg of the agglomerate and the Rg of the primary particle. The correlation function is again used to describe the probability that two points on the same line, r, are in the particle. When extended to agglomerates, the correlation function describes the probability that two points are located in either the same or two different particles.16 Thus, as the scattering angle increases, the probability that two points are located in different particles decreases with the mass fractal dimension. The mass fractal dimension, df, of an agglomerate is therefore resolved by a power-law decay of Q−df that precedes the Guinier region of the primary particles. In general, as the mass fractal dimension increases from 1 to 3, the agglomerate primary particles become more compact (eqn (1)).24 However, as the mass fractal dimension approaches 3, there will be no power-law decay, since contrast between the particles within the agglomerate is lost. For a mass fractal dimension of 3, SAS reflects the overall radius of gyration of the agglomerate, but will not be able to resolve the individual particles.
A three-dimensional agglomerate is not expected to have a smooth surface, because it is made up of primary particles. Therefore, tightly packed agglomerates will have a surface fractal dimension, ds, between 2 and 3, corresponding to a power law decay of Q−(6 −ds).24 Surface fractal scattering, as derived by Bale and Schmidt, has been observed in porous materials where the surface of the pore is not smooth.24 Power-law decays from the agglomerate surface are normally not observed. If a three-dimensional agglomerate has sufficient contrast between the primary particles, the power law decay resulting from the mass fractal dimension will be much stronger than that of the surface. However, if the primary particles are packed close enough, the agglomerate will scatter as a single particle. In this case, the power-law decay from the local surface of the agglomerate will be related to the surface fractal dimension.
Though a SAS model could be developed from the appropriate form factor, structure factor and size distribution, we employ the unified equation developed by Beaucage,25 which incorporates the Guinier region and associated power law decay for each particle phase. In addition, the unified equation can accurately model an agglomerate of particles by taking into account the mass fractal power law decay followed by the Guinier and Porod regions of the primary particles. The unified equation has the advantage of completely defining each phase of the system by separating each Guinier and associated power law scattering into separate levels,
 | (10) |
2. Materials and methods
MoO3 and Al powders were mixed to a composition that is slightly aluminum (fuel) rich, with an equivalence ratio of 1.3. These powders were then cold-pressed into pellets. The details of the preparation and pressing process have been discussed previously.2 Density depended on the force applied to compress the powders axially. Thermite bulk density is often expressed in terms of a percentage of the theoretical maximum density (% TMD) which is the ratio of the bulk density of the pellet to the theoretical maximum density (zero porosity), expressed as a percent. Table 1 shows the density and %TMD of the sample pellets evaluated in these experiments. MoO3 powder and 80 nm Al particles were donated by Nanotechnologies, Inc, (Austin, TX). The mean size of 80 nm Al nanoparticle was designated by the manufacturer. The compressed pellets were polished in water, with 500 grit sandpaper and a precision polishing tool, to thicknesses between 340 and 1200 μm, as shown in Table 1. Thicker samples were found to attenuate the beam excessively. The samples were exposed to a 17 keV, monochromated X-ray beam at the Advanced Photon Source, Argonne National Laboratory, beamline 33-ID, using a Bonse-Hart camera setup.27 After USAXS measurements, two of the samples, 36 and 66% TMD, were polished with 10 μm abrasive paper and imaged by SEM.| Sample | Thickness/μm | Density/g cm−3 | % TMD |
|---|---|---|---|
| 14 | Powder | 1.2 | 30 |
| 11 | Powder | 1.4 | 35 |
| 12 | 940 | 1.4 | 36 |
| 13 | 1190 | 1.4 | 36 |
| 2 | Powder | 1.7 | 43 |
| 3 | 340 | 1.7 | 42 |
| 4 | 340 | 1.8 | 45 |
| 5 | 620 | 1.9 | 48 |
| 6 | 600 | 1.9 | 49 |
| 7 | 500 | 2.0 | 54 |
| 8 | 600 | 2.3 | 59 |
| 9 | 400 | 2.4 | 62 |
| 15 | 350 | 2.5 | 64 |
| 10 | 400 | 2.6 | 66 |
The sample pellets were then reground to a fine powder using a mortar and pestle; approximately 2 to 5 drops of isopropanol was used while grinding the pellets. The dried powders were then placed in between Scotch Magic tape (3M) and taped to a sample holder. USAXS data for the pellets and for the associated reground powders are presented below.
3. Results
3.1 SEM images
In order to accurately evaluate the SAS data, an estimate of the geometry of the particles that make up the composite is needed. This information was obtained from SEM images of the pellet surface. Fig. 1 shows typical SEM images of the greatest and least dense sample pellets. The 36% TMD image shows aluminum particles as well as one of the smaller MoO3 plates. The smaller aluminum particles are slightly prolate rather than perfect spheres. SEM images indicate that most of the aluminum nanoparticles have a diameter between 40 and 150 nm. The MoO3platelets appear randomly oriented and display a broad thickness distribution, ranging from 10 nm to 1 μm. The planar dimension of the rectangular shaped disks was found to be on the order of several micrometers. SEM imaging suggests a large distribution in void size. Voids between the agglomerates were seen to be quite large. Additionally, the surface boundary of the pores is composed of Al particles and possibly MoO3 plates. If the voids dominate the scattering data it is likely that power law decay between −3 and −4 will be observed at high Q, corresponding to the surface fractal dimension of the void. Small voids within the agglomerates would result in a Guinier region at relatively high Q followed by the associated power law decay. Pores bounded by MoO3platelets would show stronger scattering than those bounded by Al because the MoO3 has higher contrast. However, most of the surface area and correspondingly most pores, are associated with the Al nanoparticles. | ||
| Fig. 1 SEM images of the 36 and 66% TMD samples. Agglomerates of aluminum nanoparticles can be seen, as well as the plate-like molybdenum particles. The plane of the images is perpendicular to the axis of compression. | ||
3.2 Scattering considerations
The SEM images suggest there would be a significant difference in the scattering of the Al and MoO3 and the voids within the pellets. Fig. 2 shows the raw scattering data obtained from the pellets run on the USAXS instrument. Starting at low Q, there are power law decays between −2 and −3, followed by a Guinier “knee” for all of the sample pellets at Q ranges between Q≈ 0.0001 to Q≈ 0.01; this Q region will be referred to as the first Guinier region. At Q ranges greater than the first Guinier region, there is another Guinier region at Q≈ 0.02, which remains constant for all of the pellets. A power law decay of −4 is also observed at Q greater than Q≈ 0.02. As indicated by the SEM images, the low Q power law decay and following Guinier region are representative of the agglomerated Al particles. The second Guinier region could represent a minimum Al particle radius, the thickness of the smaller MoO3 plates, Al2O3 shell thickness or small voids in the system. Scattering data above Q≥ 0.02 remain constant for all densities and is not discussed further. | ||
| Fig. 2 USAXS intensity versus Q for the compressed sample pellets. For clarity, four representative curves of the 11 scattering sets (Table 1) are shown. The intermediate curves showed scattering consistent with pellet density. | ||
As the density increases there is a shift in the first Guinier region from Q≈ 0.006 to Q≈ 0.01; this Q region is associated with scattering from the aluminum particles. For all the sample pellets, the power-law decay preceding the first Guinier region varies between 2.1 and 2.8 as the density of the pellets increases. Typically, at least one decade in Q is required to consider mass fractal scattering as the source of power-law decay,17 and this is present in all of the samples. Therefore, the power-law decay preceding the first Guinier region is considered representative of the structure of the majority of the agglomerated particles. The analysis indicates a decrease in both scattering particle size and volume fraction as the density of the pellets is increased.
3.3 Unified fit of the compressed pellets
The unified equation25 was used to fit all the SAS data. Representative curves are presented in Fig. 2. The Irena package, developed by Jan Ilavsky, was used to fit the data to the unified equation.20 Three levels were used in least squares fitting the unified model. The first level is the Guinier region, common to all of the samples at Q≈ 0.2 and thus held constant; this level corresponds to an Rg of 10.9 nm. The second level is assigned to the scattering from aluminum particles, which vary in size from 40 to 150 nm. To account for the agglomeration of the particles in the second level, a third level is associated with arbitrarily large agglomerates, which demonstrate mass fractal power-law scattering preceding the second level. Rg of the second level was allowed to vary with each density sample, along with the fractal dimension and pre-exponential factors, eqn (10). In this manner, the aluminum particle size, volume fraction and the mass fractal dimension of the agglomerate were determined for each pellet.The results of fitting the unified equation to each sample are shown in Fig. 3. As the density increases from 36 to 45% TMD, the Guinier region is associated with an aluminum particle diameter of 136 nm. Although the mean particle diameter is 80 nm, there are sufficient numbers of larger particles in the distribution26 to increase the Rg. The mass fractal dimension increases towards 3 until the density reaches 45% TMD. Between 45 and 54% TMD, the scattering diameter decreases to a value of 94.5 nm, while the mass fractal dimension drops from 2.7 to 2.5. From 54% TMD to 66% TMD the scattering diameter and mass fractal dimension decrease to 80 nm and 2.3, respectively. As the density increases above 54% there is a continual increase in the mass fractal dimension towards 3. Results from fitting the unified equation to the data indicate an increase in fractal dimension for a constant diameter. As the density of each sample is increased, the scattering diameter of the aluminum particles decreases, which results in a new lower mass fractal dimension.
 | ||
| Fig. 3 Summary of the Unified Fit.25 The asterisks are the fractal dimensions of the agglomerated particles (left axis) and the scattering particle diameter of each sample (right axis). The error bars calculated for each fractal dimension are at a 95% confidence interval over one decade of power law decay. The three regions delineated by the vertical dotted lines indicate (left) Al particles pack into dense agglomerates, but can still be individually resolved; (center) larger Al particles no longer scatter as individual particles, because the agglomerates become tightly compressed and began to form sintered aggregates; (right) some smaller Al particles in agglomerate phase become part of the sintered aggregates. | ||
3.4 Fit of the powdered pellets
After USAXS measurements of the compressed material, the pellets were reground as described in the Methods section. The USAXS data obtained from the reground powders is shown in Fig. 4. The same shift in the Guinier region that associated with the Al particles is maintained even after the pellets were reground. However, all powders have the same −3.5 power-law decay at low Q, rather than the varying power-law decay between −2 and −3 of the compressed pellet. This power-law decay is characteristic of surface fractal scattering from aggregates formed from the pellet compression. As the pellets were ground, the “aggregate phase” was broken into micron-sized pieces that could be resolved separate from the individual Al particles. Thus, the power-law scattering at the lowest Q is associated with aggregates rather than the individual Al particles. Fig. 4 can be interpreted as two different phases. One phase is composed of Al particle aggregates, in which the Al particles are packed together tightly and not resolved. The other phase would contain individual Al particles with sufficient contrast to be resolved separately. | ||
| Fig. 4 USAXS intensity versus Q for the reground pellets. Surface fractal scattering, from the agglomerates dominates the low Q region. The trend in the Guinier region is the same as that for the pellet data in Fig. 3. | ||
4. Discussion
The SAS curves obtained from USAXS experiments show that there is a shift to smaller scattering diameters and a change in fractal dimension as the density of the samples is increased. The focus of the discussion will be to qualitatively explain how the USAXS data obtained is applied to the decrease in burn rate of the thermite materials. The analysis is qualitative in nature, because little is known of the relationship between the void space and fractal dimension, and the size of the agglomerates can’t be resolved from the USAXS data.As the pellets are initially compressed, most of the Al nanoparticles begin to pack into dense agglomerates, as shown by the increase in fractal dimension from the 36% TMD to 45% TMD samples. During this compression, the scattering size remains approximately constant, indicating sufficient contrast to distinguish Al particles. As compression continues beyond 45% TMD, there is a sudden decrease in the scattering size. The decrease in scattering size in Fig. 3 is a result of the larger Al particles no longer scattering as individual particles, because the agglomerates are so tightly compressed. Therefore, the larger particles within the original distribution must be contained in very compact structures at densities higher than 45% TMD.
It is convenient to separate the Al particles into two phases. The “aggregate phase” is composed of Al particles that are packed too closely to be resolved by USAXS. The particles contained in this phase are effectively sintered together. The “agglomerate phase” is composed of Al particles that still have sufficient contrast to scatter as a mass fractal. It should be kept in mind that (within a pellet) the two phases do not have to be separate, but are considered as a separate phase of arbitrary shape too large to be resolved by USAXS. Therefore, in the region between 45 and 54% TMD, the larger particles are now part of the aggregate phase, while some of the smaller Al particles remain somewhat loose enough to significantly contribute to the scattering data in the agglomerate phase.
As the density increases beyond 54% TMD, the Al particle scattering diameter decreases to 80 nm and remains constant, while the mass fractal dimension increases as Al particles become closer to one another. Additionally, there is a small decrease in the volume fraction of the Al particles. Therefore, as compression increases, only some of the smaller Al particles in agglomerate phase become part of the aggregate phase. However, most of the particles appear to rearrange, within the agglomerate phase, to a more compact structure, as noticed by the increase in the mass fractal dimension in Fig. 3. In order for the particles to rearrange, they cannot be significantly sintered together, as the particles would not be resolved in the USAXS data. This picture accounts for the net decrease in volume fraction and the increase in mass fractal dimension of the Al particles.
We suggest the following process: as the pellets are compressed, the loosely agglomerated Al nanoparticles begin to sinter within an aggregate. However, compaction stresses are not uniform in the complex thermite composite, so transition is not homogeneous throughout the pellet. As the pellet is compressed, only some of the particles become part of the aggregate phase. The reground composite scattering shown in Fig. 4 confirms the existence of aggregate structures in the pellets. When the composite is reground to a powder, the volume fraction of the aggregate Al particles dominates the low Q region. The question then arises as to why the larger particles are associated with the aggregate phase at initial compression. This may be answered in terms of the difference between the initial environments of the larger and smaller Al particles.
Much of the theory of the kinetics of agglomeration has been obtained by computer simulation and discussed by Friedlander16 and Meakin.21–23 Diffusion limited agglomeration (DLA) requires only for a particle to come into contact with the agglomerated cluster. Kinetic limited aggregation (KLA) assigns a probability that the diffusing particle will “stick” to the cluster. Thus, the mechanism for diffusion-limited aggregation can be considered applicable to particles that have strong forces between them. In the case of Al particles, Van der Waals forces are the initial attractive forces between particles; van der Waals forces are generally considered weak and are most significant for small particles. Therefore, one might expect a transition from a DLA to KLA as the size of the particles increase.
It has been shown, from computer simulation that the fractal dimension of KLA is 2.1,19 which is in good agreement with the least dense 36%TMD sample pellet shown in Fig. 3. Because KLA produces more compact structures than DLA, agglomerates of larger particles are initially more compact than agglomerates of smaller Al particles; smaller particles, having relatively stronger forces between them, would be expected to have more of a DLA and a fractal dimension closer to 1.78.19 Therefore, an agglomerate of larger particles will have a higher probability of being compressed to a tightly-packed aggregate, since the initial structure is more compact and rearrangement is not hindered by strong interparticle forces.
The decrease in contrast with density suggests Al particles in the aggregate phase that are sintering. Although it is possible that the particles in the aggregate phase could simply be compact agglomerates held together by van der Waals forces, the decrease in burn rate with density,2 indicates the Al particles no longer diffuse as individual particles, assuming the reaction is diffusion controlled. If the structures in the aggregate phase were held together by weak van der Waals forces, the work necessary to separate the particles would be several orders of magnitude less than the thermal energy produced during combustion. The burn rate data suggest that the particles in the aggregate phase are more strongly bound than from just van der Waals forces. The burn rate is therefore dependent on the amount of Al in the aggregate phase, which will diffuse more slowly.
Understanding the processes required to sinter nanoparticles may be important as nanoparticle composites become incorporated into industrial applications. Sintering is typically accomplished at high pressures and temperatures; however, the pellets were compressed at room temperature. Although we cannot rule out local frictional heating at nanoparticle contacts, it does appear that in this system sintering occurs at a temperature far below melting.
Particles sinter in order to decrease the excess surface energy of the system.28 From the USAXS data, it was found that sintering particles depend on the size of the particles as well as the initial structure of the agglomerate (mass fractal dimension). Agglomerates with low mass fractal dimensions are affected less by compression than agglomerates with a higher initial mass fractal dimension. Computer simulations indicate that the mass fractal dimension depends on how strongly particles adhere to each other.16,21–23 Therefore, larger particles will have higher mass fractal dimension than the smaller ones, resulting in an initial compact agglomerate. However, from a thermodynamic standpoint, smaller particles would be more likely to sinter, to reduce the higher surface energy. Therefore, it seems likely that there will be an optimum size of particles that would minimize sintering upon compression. There are not enough data to develop a quantitative relationship between sintering and particle size; however, the USAXS measurements suggest such a relationship does exist.
5. Conclusion
As the thermite composites are compressed, the excess surface energy of the Al nanoparticles is lowered by sintering. This results in a tightly packed aggregated structure. The particles contained in this structure are less likely to diffuse as individual particles, resulting in a decrease in burn rate. Scattering data for all samples, pellets and powders, were described using the unified equation.25 Results from fitting the pellets to this model indicate that a fraction of the Al particles was effectively removed as the density of the pellet increased. This loss of Al particles appears to be the outcome of forming sintered aggregates, resulting in loss of contrast. The formation of an aggregate phase was determined by regrinding the samples, whereby the phase was broken up. Burn rate trend in the pellets also supports the conclusion that some of the particles are indeed sintered.From a thermodynamic standpoint, sintering is favored for smaller particles over larger ones. The USAXS data presented here suggest that the probability of particles sintering is a function of the initial mass fractal dimension of the agglomerate, as well as the particle size. The qualitative relationship presented states that agglomerates of a more compact structure are more likely to sinter than agglomerates that are less compact (lower mass fractal dimension). Van der Waals forces between clusters of relatively large and small particles result in an agglomerate, which is more compact (KLA) than agglomerates of only smaller particles (DLA). Smaller particles within the distribution are sintered to the larger particles within the compact aggregates. However, agglomerates of smaller particles can rearrange to a more compact structures upon compression, as shown by an increase in mass fractal dimension.
Acknowledgements
We gratefully acknowledge support from the National Science Foundation CREST-0420407 and from the NSF/DOE Faculty and Student Teams (FaST) Program. The use of the APS was supported by the US Department of Energy, Office of Science, Office of Basic Energy Sciences, under Contract No. DE-AC02-06CH11357.References
- L. L. Wang, Z. A. Munir and Y. M. Maximov, J. Mater. Sci., 2003, 28, 3693.
- M. L. Pantoya and J. J. Granier, Propell. Explos. Pyrotech., 2005, 30, 53 Search PubMed.
- J. Sun, M. L. Pantoya and S. L. Simon, Thermochim. Acta, 2006, 444, 117 CrossRef CAS.
- R. W. Armstrong, B. Baschung, D. W. Booth and M. Samirant, Nano Lett., 2003, 3, 253 CrossRef CAS.
- C. E. Aumann, G. L. Skofronick and J. A. Martin, J. Vac. Sci. Technol., B, 1995, 13, 1178 CrossRef CAS.
- D. D. Dlott, Mater. Sci. Technol., 2006, 22, 463 CrossRef CAS.
- J. D. Ferguson, K. J. Buechler, A. W. Weimer and S. M., Powder Technol., 2005, 156, 154 CrossRef CAS.
- K. Park, D. Lee, A. Rai, D. Mukherjee and M. R. Zachariah, J. Phys. Chem. B, 2005, 109, 7290 CrossRef CAS.
- S. C. Tjong and H. Chen, Mater. Sci. Engr. R, 2004, 45, 1 Search PubMed.
- O. Vasylkiv and Y. Sakka, Nano Lett., 2005, 5, 2598 CrossRef CAS.
- L. Liu, Bing Liang, W. Wang and Q. Leie, J. Composite Mater., 2006, 40, 2175 Search PubMed.
- R. Wengeler, F. Wolf, N. Dingenouts and H. Nirschl, Langmuir, 2007, 23, 4148 CrossRef CAS.
- R. Wengeler, A. Teleki, M. Vetter, S. E. Pratsinis and H. Nirschl, Langmuir, 2006, 22, 4928 CrossRef CAS.
- K. S. Suslick and G. J. Price, Annu. Rev. Mater. Sci., 1999, 29, 295 CrossRef CAS.
- A. Allen, J. Am. Ceram. Soc., 2005, 88, 1367l.
- S. K. Friedlander, Smoke, Dust, and Haze, Fundamentals of Aerosol Dynamics, New York, Oxford University Press, 2nd edn, 2000, pp. 223–232 Search PubMed.
- A. Guinier and G. Fournet, Small Angle Scattering of X-Rays, C. B. Wilson Trans., John Wiley & Sons, New York, 1955, p. 5 Search PubMed.
- Small Angle X-ray Scattering, ed, O. Glatter and O. Kratky, Academic Press, New York, 1982, pp. 18–19, 25–31, 35 Search PubMed.
- J. Martin and A. Hurd, J. Appl. Crystallogr., 1987, 20, 61 CrossRef CAS.
- Macros available at http://usaxs.xor.aps.anl.gov/staff/ilavsky/irena.html.
- P. Meakin and F. Family, Phys. Rev. A, 1988, 38, 2110 CrossRef CAS.
- P. Meakin, Annu. Rev. Phys. Chem., 1988, 28, 236.
- P. Meakin and A. J. Skjeltorp, Adv. Phys., 1993, 42, 1 CrossRef CAS.
- H. D. Bale and P. W. Schmidt, Phys. Rev. Lett., 1984, 53, 596 CrossRef CAS.
- G. Beaucage, J. Appl. Crystallogr., 1995, 28, 717 CrossRef CAS.
- M. A. Trunov, S. M. Umbrajkar, M. Schoenitz, J. T. Mang and E. L. Dreizin, J. Phys. Chem. B, 2006, 110, 13094 CrossRef CAS.
- G. G. Long, A. J. Allen, J. Ilavsky, P. R. Jemian and P. Zschack, in Eleventh US National Synchrotron Radiation Instrumentation Conference, AIP Conference Proceedings, ed. P. Pianetta, J. Arthur and S. Brennan, Stanford Linear Accelerator Center, Stanford CA, 2000, CP521, p. 183 Search PubMed.
- Y. M. Chiang, D. P. Birnie and W. D. Kingery, Physical Ceramics, John Wiley & Sons, Inc., New York, 1996, p. 392 Search PubMed.
| This journal is © the Owner Societies 2008 |