Niobium oxide-supported platinum ultra-low amount electrocatalysts for oxygen reduction†
K.
Sasaki
,
L.
Zhang
and
R. R.
Adzic
*
Department of Chemistry, Center for Functional Nanomaterials Brookhaven National Laboratory, Upton, NY 11973, USA
First published on 5th November 2007
Abstract
We demonstrate a new approach to synthesizing high-activity electrocatalysts for the O2reduction reaction with ultra low Pt content. The synthesis involves placing a small amount of Pt, the equivalent of a monolayer, on carbon-supported niobium oxide nanoparticles (NbO2 or Nb2O5). Rotating disk electrode measurements show that the Pt/NbO2/C electrocatalyst has three times higher Pt mass activity for the O2reduction reaction than a commercial Pt/C electrocatalyst. The observed high activity of the Pt deposit is attributed to the reduced OH adsorption caused by lateral repulsion between PtOH and oxide surface species. The new electrocatalyst also exhibits improved stability against Pt dissolution under a potential cycling regime (30![[thin space (1/6-em)]](https://www.rsc.org/images/entities/char_2009.gif) 000 cycles from 0.6 V to 1.1 V). These findings demonstrate that niobium-oxide (NbO2) nanoparticles can be adequate supports for Pt and facilitate further reducing the noble metal content in electrocatalysts for the oxygen reduction reaction.
000 cycles from 0.6 V to 1.1 V). These findings demonstrate that niobium-oxide (NbO2) nanoparticles can be adequate supports for Pt and facilitate further reducing the noble metal content in electrocatalysts for the oxygen reduction reaction.
Introduction
The proton exchange membrane fuel cell (PEMFC) is widely considered as a potential highly efficient and clean energy source.1 Despite considerable advances in recent years, technical- and economical-barriers still exist in developing electrocatalysts; they are postponing the widespread application of PEMFCs to portable electronic devices, automobile traction, and on-site power generation. A principal drawback in electrocatalysts for oxygen reduction reaction (ORR) is their slow kinetics; the onset potential of the ORR at practical current densities is 0.3 to 0.4 V below the reversible thermodynamic potential of 1.23 V. Part of the origin of this potential loss can be attributed to the inhibition of O2reduction caused by OH adsorption on Pt in the potential region between 0.75–1 V.2,3 This drawback results in the inadequate efficiency of the energy conversion in PEMFCs. Many reaction sites therefore are required to gain practical current densities, consequently leading to the high loading of Pt in oxygen cathodes.1,4,5 In addition to slow reaction kinetics, the considerable expense of the noble-metal electrocatalysts (in the cathode and the anode), and uncertain prospects for their future availability, is a primary obstacle to commercializing PEMFCs.The other notable problem is the dissolution of platinum metal from oxygen cathodes under potential excursions to high values (such as in the stop-and-go driving of electric vehicles), and at open-circuit potentials (OCP). Such dissolution, which is an anodic reaction, compounds the problem of the mixed potential formation at the cathode, thereby shifting the ORR reversible potential to lower values that, in turn, lowers the activity of ORR. Furthermore, the dissolution of Pt degrades the long-term stability of the fuel-cell’s performance. Others demonstrated that Pt cations diffuse into a membrane and form metal clusters after being reduced by H2 crossing over from the anode.6,7 Therefore, the loss of Pt is another problem that must be reduced drastically.
To alleviate these problems, we developed a new approach of synthesizing electrocatalysis for the ORR comprising a Pt monolayer deposited on suitable noble metal-, metal alloy-, or core-shell-substrates.8–10 A Pt monolayer was deposited on the surface of substrate metal by redox replacement of an underpotentially deposited (upd) Cu adlayer.11 Almost all Pt atoms are involved in the reaction, consequently greatly lowering Pt loading. The approach was successful since all these new electrocatalysts exhibited higher Pt mass activity in ORR compared with those of commercial Pt/C electrocatalysts.12 The results, including fuel-cell tests [MEA] indicated that, with a suitable substrate, Pt loading in electrocatalysts for the ORR can be reduced to one monolayer deposit.
Building further upon these achievements, we explored new electrocatalysts for the ORR comprising a low content of platinum (monolayer level) on metal-oxide nanoparticle surfaces. Few studies of metal oxide-supported Pt electrocatalysts for the ORR have been carried out,13–15 suggesting that these potentially important systems should be thoroughly investigated. Employing metal oxides instead of noble metals as substrate has an undoubted advantage; it can further reduce the total noble-metal loading in electrocatalysts. Moreover, we envisage that there must be some potential for increasing the electrocatalytic activity by choosing suitable metal oxides as substrates. The plausible factors may include the modification of Pt’s electronic structure, a decline in the OH adsorption on Pt by lateral repulsion from the OH or O on the oxide’s surface, and enhanced splitting of the O–O bond caused by the presence of oxygen-vacancy sites in the oxide. Dissolution of Pt from oxide surfaces may differ from the process on metal surfaces, and might help to suppress Pt dissolution on oxygen reduction cathodes at OCP. In addition, oxide substrates are not prone to oxidation and degradation, as are carbon supports.
In the present communication, we describe preliminary results of new electrocatalysts synthesized by depositing a small amount (monolayer-level) of Pt on carbon-supported niobium oxide nanoparticles (NbO2 or Nb2O5). We selected niobium oxides because of their excellent chemical stability in acid solutions, and their intrinsic catalytic activity observed in various applications.16,17 Niobia (Nb2O5) is known as a typical metal-support interaction (SMSI) oxide that often exhibits a pronounced effect as a support for metal–metal oxide catalysts for dehydrogenation reactions.18,19 There has been no attempt to employ it as a substrate for an electrocatalyst for the ORR, to the best of our knowledge. The present study demonstrates that the Pt/NbO2/C electrocatalyst has higher Pt mass activity for the ORR than a commercial Pt/C electrocatalyst. The results pave a new way for further lowering the noble metal content in cathode electrocatalysts for PEMFCs.
Experimental
We studied three different niobium oxide nanoparticles, viz.,1. Niobium dioxide (NbO2) nanoparticles prepared by pulverizing commercial NbO2 powders (CERAC, 200 mesh) by ball-milling. The NbO2 powders were placed in a tungsten-carbide (WC) vial containing WC balls in an Ar atmosphere. The milling was performed on a planetary ball mill for 2 h, using a ball-to-power mass ratio of 5.
2. Niobium peroxide (Nb2O5) nanoparticles were prepared following a published procedure.20 One gram of niobium chloride (NbCl3, Alfa Aesar) powder was added to 2 ml of ethanol, and left until a clear yellow solution was obtained. Then, 40 ml of 0.3 M NH3 solution was added to the yellow NbCl5 solution that gave a white precipitate of niobic acid (Nb2O5·nH2O). The precipitate was separated from the solution by centrifuging for 10 min. The solution then was drained and the remaining niobic-acid precipitate dispersed in distilled water and again centrifuged to separate it. This procedure was repeated five times to remove impurities from the precipitate. Following this, 5 ml of H2O2 solution (30 wt%) was added to the precipitate for peptization and the solution was stirred for 10 min. The transparent yellow sol is referred to as a “peroxo niobic acid sol”. This sol was sealed in a vial and heated at 80 °C for several days. Then, the final sol gel was dried in air at 80 °C for 3 h, and the resulting white powder further annealed in air, as described later.
3. The other NbO2nanoparticles were prepared by further annealing the Nb2O5nanoparticles at 900 °C for 30 min in a H2 atmosphere. To differentiate the two types of NbO2nanoparticles made by different routes, we designate NbO2(bm) for the one made by ball-milling, and NbO2(sg) for the other made by the sol–gel method.
The electrocatalysts were synthesized with an amount of Pt equivalent to a monolayer coverage on the niobium-oxide nanoparticles. It was calculated from the surface area of oxide nanoparticles estimated from their average size. Pt was deposited by reducing K2PtCl4 using NaBH4. The slurry containing the oxide and K2PtCl4 was stirred magnetically overnight before adding NaBH4. Carbon particles (Vulcan XC-72) were added to the slurry, and it was stirred for several hours. It is not likely that some Pt ions could remain unreduced in the presence of a strong reducing agent for an extended length of time. The electrode contained 5 μg cm−2 of Pt, amounting to 11% of the mass of NbO2.
A thin film of the electrocatalyst was prepared on a glassy carbon disk electrode for electrochemical measurements.21 The electrode was covered by a small amount of a Nafion solution (5 μL of 4 μg 10 μL−1) and dried in air before taking the rotating disk-ring electrode measurements. Solutions were prepared from Optima™ sulfuric acid obtained from Fisher and MilliQ UV-plus water (Millipore). An Ag/AgCl/KCl (3 M) electrode was used with a double-junction chamber as a reference and all potentials, E, are quoted with respect to the reversible hydrogen electrode (RHE).
Powder X-ray diffraction (XRD) patterns were obtained with a commercial diffractometer (Phillips 3100) using Cu Kα radiation (1.54056 Å). Samples for analyses were obtained by loading the slurries on to glass slides, and drying them in air. Diffraction patterns were collected from 20 to 80° at a scanning rate of 0.6° min−1, with a step size of 0.02°.
Transmission electron microscopy (TEM) observations were made using a JEOL 3000F TEM at the Brookhaven National Laboratory’s (BNL’s) Center for Functional Nanomaterials. In situX-ray absorption near-edge structure spectroscopy (XANES) measurements were carried out at BNL’s National Synchrotron Light Source (NSLS), using Beam Lines X19A and X-18B. The electrochemical cell was designed for XANES-data acquisition in transmission- and florescence-modes, although the present measurements employed the former mode at the Pt L3 edge (11![[thin space (1/6-em)]](https://www.rsc.org/images/entities/char_2009.gif) 564 eV) at different potentials at room temperature. The total amount of Pt in the Pt/NbO2/C or Pt/Nb2O5/C electrode was ca. 5 mg cm−2. The electrochemical cell was described in detail elsewhere.22,23 The Nb K edges (18
564 eV) at different potentials at room temperature. The total amount of Pt in the Pt/NbO2/C or Pt/Nb2O5/C electrode was ca. 5 mg cm−2. The electrochemical cell was described in detail elsewhere.22,23 The Nb K edges (18![[thin space (1/6-em)]](https://www.rsc.org/images/entities/char_2009.gif) 986 eV) for NbO2 and Nb2O5nanoparticles were also measured in the transmission mode in the absence of electrochemical controls. The data were processed by ATHENA software.24
986 eV) for NbO2 and Nb2O5nanoparticles were also measured in the transmission mode in the absence of electrochemical controls. The data were processed by ATHENA software.24
Results and discussion
Characterization of niobium-oxide nanoparticles
Fig. 1 displays voltammograms of a thin film of 0.48 μmol NbO2(bm) nanoparticles on a glassy carbon electrode (GCE, area: 0.196 cm2) in 0.1 M HClO4 purged by Ar and O2. The niobium-dioxide nanoparticles employed in obtaining the polarization curves were not mixed with XC-72 carbon particles. Under the Ar atmosphere (solid line), the potential was scanned between 0.05 and 1.285 V/RHE at a sweep rate of 20 mV s−1. No specific oxidation and reduction current peaks emerged on the curve (except for very minute ramps above 1.1 V on a forward sweep and around 0.77 V on a backward one that can be, respectively attributed to oxidation and reduction of the GCE). The observation demonstrated that the NbO2(bm) nanoparticles are quite stable in acid medium in the ORR potential range. Also, the dotted line in the figure represents the polarization curve of the same specimen under an O2 atmosphere in 0.1 M HClO4; a small increase in cathodic current at low potentials below 0.16 V is apparent. This negligibly small change may be due to the ORR; however, it may reflect the ORR taking place on the glassy carbon surface. We conclude that the NbO2(bm) nanoparticles have no electrocatalytic activity for the ORR. Such a conclusion also was reached from the voltammetry tests of the NbO2(sg) and the Nb2O5nanoparticles.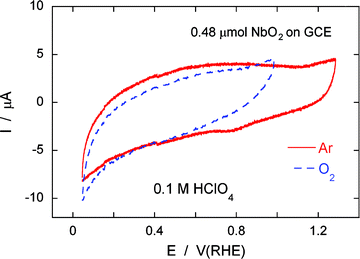 | ||
| Fig. 1 Cyclic voltammograms of 0.48 μmol NbO2(bm) nanoparticles on a glassy carbon electrode (GCE, area: 0.196 cm2) in 0.1 M HClO4 purged by Ar (solid line) and O2 (dotted line). Sweep rate: 20 mV s−1. | ||
Fig. 2(a) shows XRD patterns of the NbO2 powder as received and after ball-milling for 2 h. The sharp diffraction peaks from the former greatly weakened and broadened after the 2h ball-milling treatment, indicating that the particles’ size was significantly decreased, and/or that strain was introduced to the material during the mechanical deformation. To eliminate one of these possibilities, the particle’s size was determined by the Scherrer’s equation from the widths of the reflection peaks because the effect of internal strain on the widths of the diffraction peaks generally is insignificant.25,26 From the diffraction peaks at (400), (222), (440), and (402) planes, the average particle size of the ball-milled NbO2 sample was calculated as 12 nm. We note that the peak positions after the ball-milling shifted to slightly higher angles compared with those of the as-received sample, indicating that the small lattice contraction was induced as a consequence of mechanical deformation. Ball milling for longer times (e.g., 10 h) did not change the particles’ size.
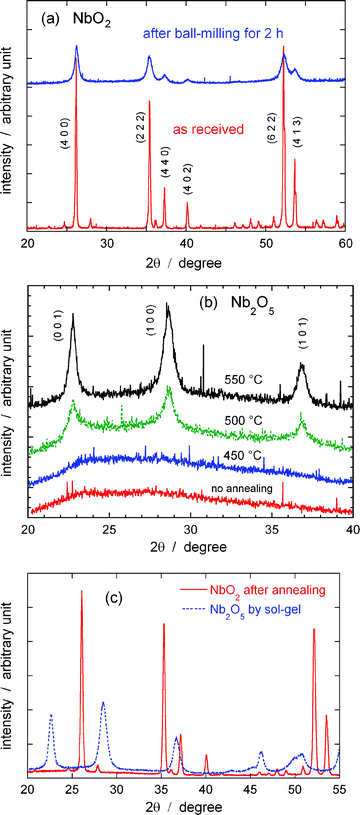 | ||
| Fig. 2 XRD patterns of (a) NbO2 particles as received and after ball-milling for 2 h, (b) Nb2O5 sol gel particles after annealing in air at different temperatures, and, (c) NbO2 particles prepared by further annealing the Nb2O5 particles at 900 °C for 30 min in a H2 atmosphere (the pattern before the thermal treatment is also shown). | ||
The niobium pentoxide (Nb2O5) nanoparticles obtained by the sol–gel method have an amorphous structure, and the nanoparticles were further annealed to obtain crystals. Fig. 2(b) shows a set of XRD patterns of the Nb2O5 powders after annealing in air at different temperatures. The patterns from Nb2O5nanoparticles, obtained by the sol–gel method and were not annealed, lacked discernible diffraction peaks suggesting that they are amorphous. Raising the annealing temperature above 500 °C, caused the oxide to crystallize, as indicated in the figure. From the diffraction peaks at (001), (100), and (101) planes, the average particle size of the Nb2O5 after annealing at 550 °C for 20 min was 13 nm.
The Nb2O5nanoparticles were further annealed at 900 °C for 30 min in a H2 atmosphere. The corresponding XRD pattern is presented in Fig. 2(c) (solid line), together with one of the powders before the treatment (dotted line). It is clearly demonstrated that Nb2O5 was reduced to NbO2 as indicated by the similarity of these peak positions with those shown in Fig. 2(a). Similarly, the average particle size of the obtained NbO2(sg) particles was calculated to be 33 nm.
Fig. 3 shows XANES spectra for the Nb K edges from NbO2(bm), NbO2(sg), and Nb2O5nanoparticles, together with a spectrum from Nb foil (2 μm thick). The XANES from niobium oxides significantly differ from that of Nb metal; they are shifted toward higher energies with an order of the increase in valence values (0 → +4 → +5). The shift in energy between the Nb2O5nanoparticles and Nb foil is ca. 8 eV. Both the NbO2 and Nb2O5nanoparticles exhibit two strong edge peaks at approximately 19![[thin space (1/6-em)]](https://www.rsc.org/images/entities/char_2009.gif) 005 and 19
005 and 19![[thin space (1/6-em)]](https://www.rsc.org/images/entities/char_2009.gif) 017 eV that reflect the low-energy scattering resonances of photoelectrons by neighboring atoms.27 The peak intensity at 19
017 eV that reflect the low-energy scattering resonances of photoelectrons by neighboring atoms.27 The peak intensity at 19![[thin space (1/6-em)]](https://www.rsc.org/images/entities/char_2009.gif) 005 eV is larger than that at 19
005 eV is larger than that at 19![[thin space (1/6-em)]](https://www.rsc.org/images/entities/char_2009.gif) 017 eV for the NbO2nanoparticles, while the opposite is true for the Nb2O5nanoparticles, in good agreement with literature.28 It is interesting that the spectrum from the NbO2(bm) nanoparticles differs slightly from that of the NbO2(sg) nanoparticles; both the peak heights at 19
017 eV for the NbO2nanoparticles, while the opposite is true for the Nb2O5nanoparticles, in good agreement with literature.28 It is interesting that the spectrum from the NbO2(bm) nanoparticles differs slightly from that of the NbO2(sg) nanoparticles; both the peak heights at 19![[thin space (1/6-em)]](https://www.rsc.org/images/entities/char_2009.gif) 005 and 19
005 and 19![[thin space (1/6-em)]](https://www.rsc.org/images/entities/char_2009.gif) 017 eV for the former are lower than those of the latter, implying that the electronic states and/or their localized atomic structures may differ in addition to their difference in particle size. The other marked feature is that the XANES from the Nb2O5nanoparticles shows a clear pre-edge peak at ca. 18
017 eV for the former are lower than those of the latter, implying that the electronic states and/or their localized atomic structures may differ in addition to their difference in particle size. The other marked feature is that the XANES from the Nb2O5nanoparticles shows a clear pre-edge peak at ca. 18![[thin space (1/6-em)]](https://www.rsc.org/images/entities/char_2009.gif) 887 eV that is known to be caused by an empty d-state in the electronic configuration of Nb2O5. The pre-edge peak for the NbO2(sg) is negligible. XANES studies on niobium oxides by Antonio et. al.28 revealed that the intensity of pre-edge peak observed at the Nb K edge increases with a ratio of Nb5+ to Nb4+ ions in Nb5+/Nb4+ mixed oxides and also in the density of empty d-states.28 The differences in electronic state may induce the different ORR activities of Pt on those oxides, as discussed later.
887 eV that is known to be caused by an empty d-state in the electronic configuration of Nb2O5. The pre-edge peak for the NbO2(sg) is negligible. XANES studies on niobium oxides by Antonio et. al.28 revealed that the intensity of pre-edge peak observed at the Nb K edge increases with a ratio of Nb5+ to Nb4+ ions in Nb5+/Nb4+ mixed oxides and also in the density of empty d-states.28 The differences in electronic state may induce the different ORR activities of Pt on those oxides, as discussed later.
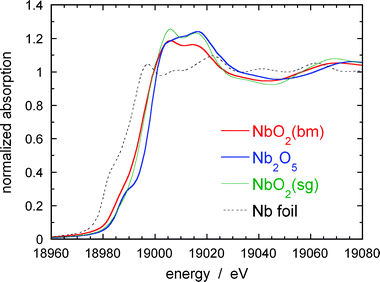 | ||
| Fig. 3 XANES for Nb K edges from NbO2(bm) , NbO2(sg), and Nb2O5nanoparticles, together with a spectrum from Nb metal foil (2 μm thick). | ||
Fig. 4 shows a high-resolution TEM image of the ball-milled NbO2nanoparticles without carbon particle supports. Atomically resolved lattice structures are apparent in most of them. Several large particles appear to be formed by agglomeration of several nanoparticles. The nanoparticle located at the top of the agglomerate has an interesting feature; its image reveals an ordered atomic structure that is distorted along the same direction, indicating plastic deformation occurring along the slip plane. We suggest that such defects in the atomic structure of ball-milled particles are introduced by shear stress during pulverization. The average particle size, determined from measurements of over 80 particles, is about 11 nm, agreeing well with that from the XRD measurements (Fig. 2(a)).
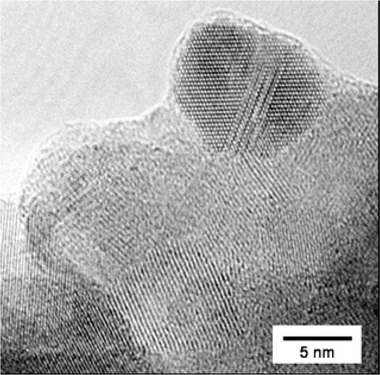 | ||
| Fig. 4 High-resolution TEM image of the ball-milled NbO2nanoparticles without carbon supports. | ||
Platinum deposits on NbO2nanoparticles
Fig. 5 displays a cyclic voltammogram from Pt/NbO2/C in a de-aerated 0.1 M HClO4 solution. Hydrogen adsorption/desorption peaks appear at a potential range between 0.05 and 0.365 V due to Pt deposition on the NbO2nanoparticle surfaces. The amount of Pt on the electrode was 5 nmol (5 μg cm−2), while that of NbO2 is 36 nmol (45 μg cm−2). Thus a Pt loading on NbO2 is 11% as indicated above. An X-ray diffraction peak of Pt (2 0 0) from the Pt/NbO2/C electrocatalyst is presented in the insert in Fig. 5. The calculated average size of the Pt deposits is 4 nm, implying that there are ca. 1.5 nmol of the surface Pt atoms calculated from the ratio of the surface to total number of atoms (Ns/Nt) equal to 0.3, as proposed in Benfield's calculation.29 The alternative way of calculating the active surface area is to integrate the charge associated with the H adsorption peaks. This procedure gives the charge associated with H adsorption on Pt of about 140 μC per electrode, which is equivalent to 1.45 nmol. Thus, the Ns/Nt ratio is 1.45/5 = 0.29 which is in good agreement with the above ratio of 0.3 calculated for the particle size of 4 nm. This means that the active Pt surface area of that electrode is about 0.66 cm2. In this calculation we assumed 210 μC cm−2 for H adsorption, as used for polycrystalline Pt. This area was used to plot the polarization curves as a function of the real surface area (Fig. 6).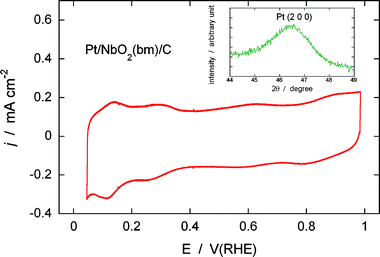 | ||
| Fig. 5 Cyclic voltammogram from the Pt/NbO2(bm)/C electrocatalyst in a de-aerated 0.1 M HClO4 solution. Sweep rate: 20 mV s−1. The insert shows the diffraction peak of Pt (2 0 0) from the same electrocatalyst. | ||
 | ||
| Fig. 6 Comparison of polarization curves for the ORR on Pt/NbO2(bm)/C, Pt/NbO2(sg)/C, Pt/Nb2O5/C, and commercial Pt/C electrocatalysts at a rotation rate of 1600 rpm. The Pt loadings of the Pt/NbO2(bm)/C, Pt/NbO2(sg)/C, Pt/Nb2O5/C electrocatalysts are 5 μg cm−2 (or 5 nmol), while that of the Pt/C electrocatalyst is 10 μg cm−2 (or 10 nmol), %. Electrolyte: O2 saturated 0.1 M HClO4. Sweep rate: 10 mV s−1. The right ordinate plots the specific current density (per real Pt surface area) for the Pt/NbO2(sg)/C, Pt/Nb2O5/C electrocatalyst. | ||
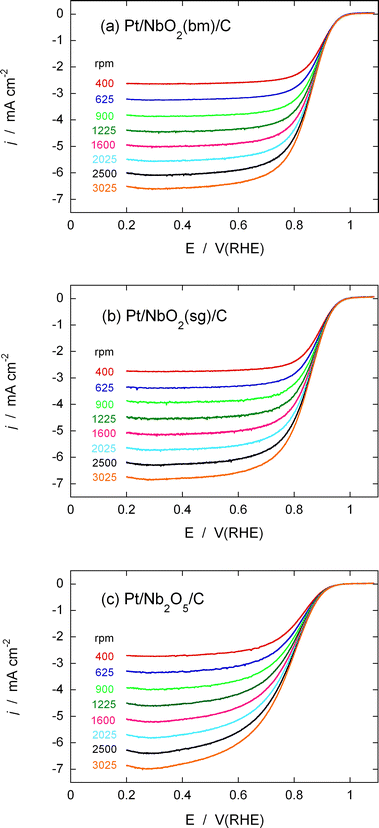
Fig. 7a illustrates the rotating disk electrode (RDE) measurements of the ORR on the Pt/NbO2(bm)/C electrocatalyst in a 0.1 M HClO4 solution purged by O2 at different rotation speeds (400 to 3025 rpm). The electrocatalysts’ considerable activity is indicated by the high onset potential of O2reduction (0.95–1.0 V), as well as by the high half-wave potentials. High ORR activity also was recorded for the Pt/NbO2(sg)/C electrocatalyst (Fig. 7b). On the other hand, the rate of the ORR from the Pt/Nb2O5/C electrocatalyst is not as high as those from the Pt/NbO2/C electrocatalysts, as inferred from the slower rise in the ORR current with increasing overpotentials, and from the half-wave potentials (Fig. 7c).
 | ||
| Fig. 7 Polarization curves obtained with a rotating disk electrode for the ORR on (a) Pt/NbO2(bm)/C, (b) Pt/NbO2(sg)/C, and Pt/Nb2O5/C. Electrolyte: O2-saturated 0.1 M HClO4. Sweep rate: 10 mV s−1. Disk electrode area: 0.196 cm2.Pt: 5 nmol. NbO2: 36 nmol. Nb2O5: 14 nmol. Platinum loading per oxide is 18%, while the Pt content is 5 μg cm−2. | ||
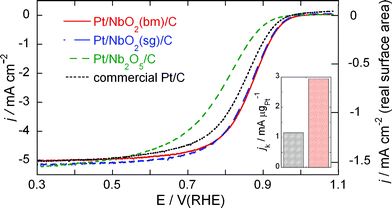
This tendency is more clearly demonstrated in Fig. 6 that plots the current densities for the ORR on the Pt/Nb2O5/C and Pt/NbO2/C electrocatalysts at a rotation rate of 1600 rpm. The right ordinate gives the current density on the basis of the Pt real surface area for the Pt/NbO2/C electrocatalyst. The data for a commercial Pt/C electrocatalyst are also shown in Fig. 6. This catalyst was obtained from E-TEK, having loading of 20% on XC-72 carbon and the average Pt particle size of about 3–5 nm. It is close to the size of the Pt particles on NbO2 (4 nm), which makes them suitable for comparing their catalytic activities. The activity of the Pt/NbO2/C electrocatalysts is higher than that of the commercial Pt/C electrocatalyst; the half-wave potentials for the Pt/NbO2(bm)/C, Pt/NbO2(sg)/C, Pt/Nb2O5/C, and Pt/C electrocatalysts are 0.865 V, 0.860 V, 0.787 V, and 0.840 V, respectively. The Pt loadings of the Pt/NbO2(bm)/C, Pt/NbO2(sg)/C, Pt/Nb2O5/C electrocatalysts are 5 μg cm−2 (or 5 nmol), while that of the Pt/C electrocatalyst is 10 μg cm−2 (or 10 nmol).
Table 1 shows the comparison of mass activities, im(0.9 V), and specific activities, is(0.9 V), at 0.9 V of the electrocatalysts in membrane electrode assemblies at 80 °C,30 and the Pt/NbO2/C and Pt/C commercial electrocatalysts from RDE measurements at room temperature in this work. Although the conditions these data were obtained at are different, the higher values of both variables for the Pt/NbO2/C electrocatalyst indicate its considerable potential (cf.Fig. 10).
The Koutecký–Levich equation,31
 | (1) |
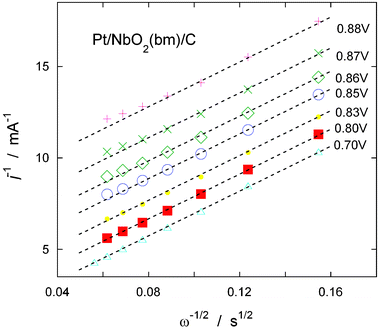 | ||
| Fig. 8 Koutecký-Levich plot at different potentials using the data obtained from the Pt/NbO2(bm)/C electrocatalyst (Fig. 7a). | ||

| (2) |
Fig. 9 contains the Tafel plots derived from the kinetic currents jk of the Pt/NbO2/C electrocatalysts. The white squares represent the Tafel slope from the commercial Pt/C electrocatalyst. The Tafel slopes for the Pt/NbO2(bm)/C and Pt/NbO2(sg)/C electrocatalysts are −114 and −109 mV dec−1 above 0.80 V, while that for the commercial Pt/C is −97 mV dec−1 in the same potential range. Wang et al.36 investigated the effect of adsorbed species (OH and bisulfate) on ORR kinetics, finding that the intrinsic Tafel slope in acid solution is −118 mV dec−1 in the absence of adsorbed anions, and the lower values of the slope are due to the blocking and/or electronic effects of the adsorbed species.36 The Tafel slopes obtained from the Pt/NbO2/C electrocatalysts indicate two features of this reaction: one is that the first electron-transfer step is the rate-determining one on the Pt/NbO2/C electrocatalyst surfaces, and the other is that OH adsorption may have little effect on the Pt surfaces on NbO2 oxides in the observed range of the potentials (0.8–0.9 V).
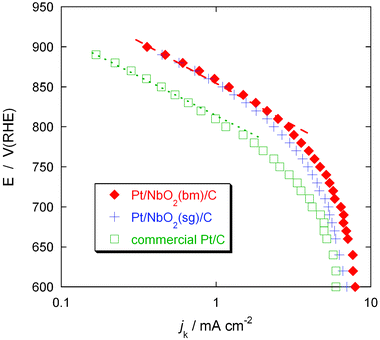 | ||
| Fig. 9 Tafel plots derived from the kinetic currents jk of the Pt/NbO2/C and commercial Pt/C electrocatalysts. | ||
Fig. 10 compares the Pt mass activities of the Pt/NbO2/C and Pt/Nb2O5/C electrocatalysts with that of the commercial Pt/C electrocatalyst. The activities were obtained from the kinetic currents divided by the Pt masses at potentials of 0.80 V and 0.85 V. The plot shows that the Pt mass activities of the Pt/NbO2/C electrocatalysts are 2.5–3 times higher than that of the commercial Pt/C electrocatalyst (1.15 mA μgPt−1). We note that the Pt/NbO2(sg)/C electrocatalyst exhibits slightly lower Pt mass activity (2.36 mA μgPt−1) than the Pt/NbO2(sg)/C electrocatalyst (2.95 mA μgPt−1), presumably due to the larger size of its particles and/or a more subtle difference in electronic state or local atomic structures as the XANES results implied (Fig. 3). On the other hand, the Pt mass activity of the Pt/Nb2O5/C electrocatalyst (0.88 mA μgPt−1) is somewhat lower than that of the commercial Pt/C electrocatalyst.
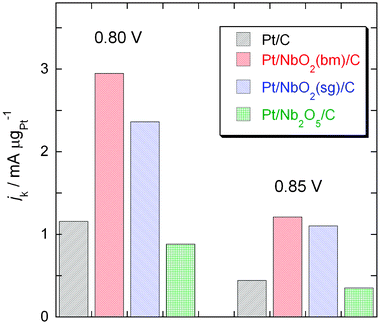 | ||
| Fig. 10 Pt mass activities of the Pt/NbO2/C and Pt/Nb2O5/C electrocatalysts and that of the commercial Pt/C electrocatalyst at potentials of 0.80 V and 0.85 V. | ||
To gain information on the stability of the Pt/NbO2(bm)/C catalyst under the potential cycling condition, we determined the ORR activity after applying 30![[thin space (1/6-em)]](https://www.rsc.org/images/entities/char_2009.gif) 000 potential cycles from 0.6 to 1.1 V to the sample in an O2 saturated solution at room temperature. The accelerated cycling test is designed to simulate conditions during the stop-and-go driving that causes dissolution of Pt, one of major impediments for vehicular -application of fuel cells. Fig. 11 has the polarization curves for O2reduction before and after the potential cycles. After the potential cycling tests, the half-wave potential decreased 23 mV. However, this shift is much smaller than that in a commercial Pt electrocatalyst, which showed a negative shift of 40 mV and an approximately 45% loss in Pt surface area.36 The insert in Fig. 11 for the Pt/NbO2(bm)/C electrocatalyst shows no significant surface loss in Pt, as was verified by small changes in H adsorption/desorption peaks in the voltammetry curve after the potential cycling test. The results demonstrate the improved stability of the Pt/NbO2/C electrocatalyst under a potential cycling regime.
000 potential cycles from 0.6 to 1.1 V to the sample in an O2 saturated solution at room temperature. The accelerated cycling test is designed to simulate conditions during the stop-and-go driving that causes dissolution of Pt, one of major impediments for vehicular -application of fuel cells. Fig. 11 has the polarization curves for O2reduction before and after the potential cycles. After the potential cycling tests, the half-wave potential decreased 23 mV. However, this shift is much smaller than that in a commercial Pt electrocatalyst, which showed a negative shift of 40 mV and an approximately 45% loss in Pt surface area.36 The insert in Fig. 11 for the Pt/NbO2(bm)/C electrocatalyst shows no significant surface loss in Pt, as was verified by small changes in H adsorption/desorption peaks in the voltammetry curve after the potential cycling test. The results demonstrate the improved stability of the Pt/NbO2/C electrocatalyst under a potential cycling regime.
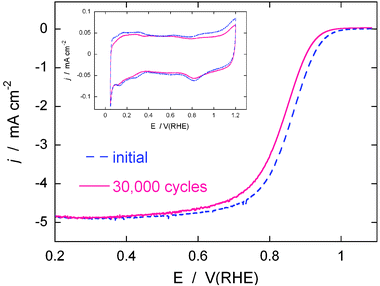 | ||
Fig. 11 Polarization curves for the O2reduction reaction on the Pt/NbO2(bm)/C electrocatalyst on a rotating disk electrode before and after 30![[thin space (1/6-em)]](https://www.rsc.org/images/entities/char_2009.gif) 000 potential cycles. Sweep rate: 10 mV s−1; rotation rate: 1600 rpm. The potential cycles were from 0.6 V to 1.1 V at a sweep rate of 50 mV s−1 in O2-saturated 0.1 M HClO4 at room temperature. The insert shows voltammetry curves for the Pt/NbO2/C electrocatalyst before and after the 30 000 potential cycles. Sweep rate: 10 mV s−1; rotation rate: 1600 rpm. The potential cycles were from 0.6 V to 1.1 V at a sweep rate of 50 mV s−1 in O2-saturated 0.1 M HClO4 at room temperature. The insert shows voltammetry curves for the Pt/NbO2/C electrocatalyst before and after the 30![[thin space (1/6-em)]](https://www.rsc.org/images/entities/char_2009.gif) 000 potential cycles at a sweep rate of 20 mV s−1 in a de-aerated 0.1 M HClO4 solution. 000 potential cycles at a sweep rate of 20 mV s−1 in a de-aerated 0.1 M HClO4 solution. | ||
As described in the Introduction, the inhibition effect of OH adsorption on Pt at very positive potentials is a major cause of a large potential loss of the ORR.1,2Fig. 12(a) depicts in situ XANES of Pt L3 edge obtained from the Pt/NbO2(bm)/C electrocatalyst in 0.1 M HClO4 at four different potentials. A XANES spectrum from a commercial Pt/C electrocatalyst at a potential of 1.12 V is also plotted for comparison. The insert illustrates the details of the data around the peaks of L3 edge from the Pt/NbO2(bm)/C. The spectra from this electrocatalyst do not show any eminent changes with an increase in potential; only at the highest one did we note a very slight increase in the intensity of white line, which is considered a consequence of the PtOH formation so depleting Pt’s d-band.37
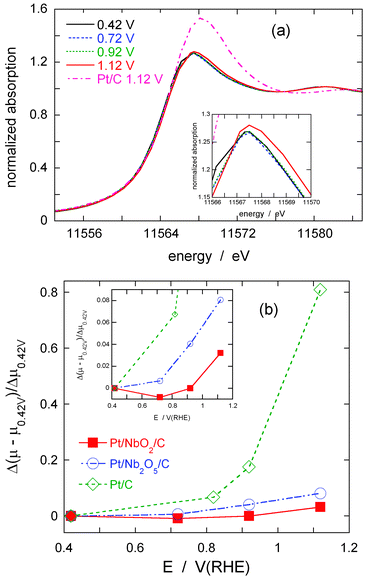 | ||
| Fig. 12 (a) XANES spectra of Pt L3 edge obtained from the Pt/NbO2(bm)/C in 1 M HClO4 at different potentials, and that from the commercial Pt/C at 1.12 V. (b) Comparison of the change in absorption peaks at Pt L3 edge for the Pt/NbO2(bm)/C, Pt/Nb2O5/C, and Pt/C electrocatalysts is plotted as a function of applied potentials. | ||
Fig. 12(b) presents a clear evidence of suppressed oxidation of Pt deposits on niobium-oxide nanoparticles compared with the oxidation of Pt nanoparticles; in the graph, the relative changes in the L3 peak intensity (Δ(μE−μ0.42 V)/Δμ0.42 V) from the Pt/NbO2(bm)/C are plotted as a function of potentials, together with those from the commercial Pt/C- and Pt/Nb2O5/C-electrocatalyst. The intensity of the white line for the Pt/C electrocatalyst increases sharply with potentials, while that for the Pt/NbO2(bm)/C does not change much and even at the highest potential only exhibits a tiny ramp (see the inset of Fig. 12(b)). This suggests that the oxidation of Pt on NbO2 substrates requires much higher potentials than that of platinum nanoparticles on carbon substrates, presumably by the lateral repulsion with OH or O of the oxide’s surface. The observed enhancement of the catalytic activity for the Pt/NbO2(bm)/C electrocatalyst compared with the commercial Pt/C appears partly to be caused by the suppressed formation of PtOH, an observation that is in line with those for the Pt monolayer electrocatalysts, such as PtML/Pd/C,8,9 mixed Pt–MML/Pd/C (M = Ir, Ru, Os, etc.),10PtML/AuNi/C,38 and Au-cluster/Pt/C39 that all showed significantly improved activity for the ORR. The high Tafel slopes between 0.8 and 0.9 V (Fig. 9) observed on the Pt/NbO2/C electrocatalysts can be easily explained by the reduced coverage of OH on Pt.36
Another remarkable point, illustrated in Fig. 12(b), is that the Nb2O5nanoparticle substrates also retard the formation of PtOH on Pt deposits at moderate/high potentials; the inhibiting effect is profound compared with that of the Pt/C (it is slightly less than that of the NbO2nanoparticles). As discussed above, it is most probable that one vital prerequisite for substrate materials intended to improve the ORR activity is that they should retard the adsorption of OH on Pt. Even though the Nb2O5nanoparticles possess this beneficial effect, the ORR activity for the Pt/Nb2O5 electrocatalyst is not particularly good compared with the commercial Pt/C (Fig. 10). Therefore, it is intriguing to envisage possible reasons for the difference in activity between two niobium oxide substrates, since this may lead to the identification of other constituents that control the ORR activity, other than retardation of PtOH formation.
NbO2 has a crystal structure closely related to the tetragonal rutile structure and is an n-type semiconductor at room temperature (ca. 15 S cm−1),40 although it becomes a conductor at high temperatures (>1125 K).41 On the other hand, Nb2O5 has an orthorhombic pseudohexagonal structure and is an insulator (ca. 10−4 S cm−1 at room temperature).42 The difference in electrical conductivity between the oxide substrates is likely to be one of plausible causes of the difference in ORR activity observed for Pt/Nb2O5/C and Pt/NbO2/C. Despite their small particle size (13 nm), the low conductivity of the Nb2O5nanoparticles could hamper electron flows between the Pt deposits and carbon particles, thereby lowering the system’s performance.
The electronic structure of substrates is an important factor because it can alter the catalytic activity of deposited Pt.43 The electronic configurations of NbO2 and Nb2O5 are [Kr]·4d1 and [Kr]·4d0, respectively. The clear presence of pre-edge peak on the Nb2O5spectrum in Fig. 3 reflects that there are no d-electrons in its electronic configuration, and that all of them have been transferred to the O 2p-band; consequently, there must be no electronic interference between the Pt and Nb2O5. On the other hand, the 4d1 electrons of NbO2nanoparticles can be either donated to or shared with Pt, such that the electronic interaction may improve the ORR activity of Pt on the NbO2nanoparticles. This can be another cause of the difference in activity between two niobium oxide substrates. (We note that the difference in electronic structure can explain the behavior of their electrical conductivities.) Strain in a Pt monolayer on a foreign substrate is known to change the monolayer’s electronic properties, causing significant changes in the surface reactivity.43 Such a strain-induced electronic effect may be involved in the present electrocatalysts, too. Further XAS experiments, such as Pt monolayer deposition on single crystal NbO2, as well as calculations using density function theory (DFT) will be vital in clarifying details of the electronic effect in the systems.
Surface defects, in particular oxygen vacancies, are considered a dominant factor for the surface activity of oxide catalysts. For example, oxygen vacancies act as active sites for water dissociation on rutile TiO2(110);40,44 Göpel et al. reported that H2 and CO molecules are preferentially chemisorbed at its surface oxygen-vacancies.45 Furthermore, Pacchioni argued that surface oxygen vacancies on TiO2 surfaces can modify the d-state of adjacent Ti atoms by transferring electrons associated with the O atom removed from the surface.46 Surface vacancies on the niobium oxides are also expected to play an important role for the ORR. Borgschulte et al.47 proposed that catalytic activity for hydrogen absorption on Nb2O5 originates from surface vacancies. However, we know of no studies on their role in electrocatalysis. One possibility for ORR is the splitting of O–O bonds as a consequence of the interaction between the Pt and oxygen vacancy if an O2 molecule adsorbs on a Pt-vacancy site. The O–O bond is expected to be stretched in that configuration, leading to a more facile splitting and enhancing the kinetics of O2reduction. If the concentrations of surface vacancy differ between NbO2 and Nb2O5, the activities of Pt on the oxides may differ. The notion however, is speculative, and further investigation is necessary to gain more information.
Conclusions
We synthesized new electrocatalysts by depositing a very small amount of Pt on carbon-supported niobium-oxide nanoparticles (NbO2 or Nb2O5). Nb2O5nanoparticles were prepared by heating a peroxo niobic acid sol obtained by peptization of a niobic-acid precipitate with hydroperoxides. NbO2nanoparticles were prepared by annealing the Nb2O5nanoparticles in a H2 atmosphere or by pulverizing commercial NbO2 particles by ball-milling. Rotating disk electrode tests demonstrated that the Pt/NbO2/C electrocatalysts showed approximately three times higher Pt mass activity for the ORR than those from a commercial Pt/C electrocatalyst. Similar enhancement is observed for the specific activity. The observed high activity of Pt deposit was attributed to the reduced OH adsorption caused by lateral repulsion between PtOH and oxide surface species. Under the oxidizing conditions of 30![[thin space (1/6-em)]](https://www.rsc.org/images/entities/char_2009.gif) 000 potential cycles from 0.6 V to 1.1 V, the Pt/NbO2/C electrocatalyst demonstrated improved activity compared with the commercial Pt/C electrocatalyst. Our results suggest that niobium oxide (NbO2) nanoparticles can be adequate supports for Pt, thereby further reducing the noble-metal contents of electrocatalysts for the ORR and avoiding the problems of the substrate oxidation and corrosion that plague the carbon supports.
000 potential cycles from 0.6 V to 1.1 V, the Pt/NbO2/C electrocatalyst demonstrated improved activity compared with the commercial Pt/C electrocatalyst. Our results suggest that niobium oxide (NbO2) nanoparticles can be adequate supports for Pt, thereby further reducing the noble-metal contents of electrocatalysts for the ORR and avoiding the problems of the substrate oxidation and corrosion that plague the carbon supports.
Acknowledgements
This work is supported by US Department of Energy, Divisions of Chemical and Material Sciences, under the Contract No. DE-AC02-98CH10886.References
-
S. Gottesfeld and T. A. Zawodzinski, in Advances in Electrochemical Science and Engineering, ed. R. C. Alkire and D. M. Kolb, Wiley-VCH, Weinheim, 1997, vol. 5, p. 195 Search PubMed
.
-
R. R. Adzic, in Frontiers in Electrochemistry, Vol. 5, Electrocatalysis, ed. J. Lipkowski and P. N. Ross, VCH Publishers, New York, 1998, p. 197 Search PubMed
.
- A. Anderson, Electrochim. Acta, 2002, 47, 3759 CrossRef CAS
.
- N. M. and P. N. Ross, Electrochim. Acta, 2000, 45, 4101 CrossRef
.
- T. E. Springer, T. Rockward, T. A. Zawodzinski and S. Gottesfeld, J. Electrochem. Soc., 2001, 148, A11 CrossRef CAS
.
- K. Yasuda, A. Taniguchi, T. Akita, T. Ioroi and Z. Shiroma, Phys. Chem. Chem. Phys., 2006, 8, 746 RSC
.
- P. J. Ferreira, G. J. la O’ GJ, Y. Shao-Horn, D. Morgan, R. Makharia, S. Kocha and H. A. Gasteuger, J. Electrochem. Soc., 2005, 152, A2256 CrossRef
.
- J. Zhang, Y. Mo, M. B. Vukmirovic, R. Klie, K. Sasaki and R. R. Adzic, J. Phys. Chem. B., 2004, 108, 10955 CrossRef CAS
.
- J. Zhang, M. B. Vukmirovic, K. Sasaki, F. Uribe and R. R. Adzic, J. Serb. Chem. Soc., 2005, 70, 513 CrossRef CAS
.
- J. Zhang, M. B. Vukmirovic, K. Sasaki, A. U. Nilekar, M. Mavrikakis and R. R. Adzic, J. Am. Chem. Soc., 2005, 127(36), 12480 CrossRef CAS
.
- S. R. Brankovic, J. McBreen and R. R. Adzic, J. Electroanal. Chem., 2001, 503, 99 CrossRef CAS
.
- R. R. Adzic, J. Zhang, K. Sasaki, M. B. Vukmirovic, M. Shao, J. X. Wang, A. U. Nilekar, Mavrikakis, J. A. Valerio and F. Uribe, Top. Catal. Search PubMed
, in press.
- J. Shim, C.-R. Lee, H.-K. Lee, J.-S. Lee and E. J. Cairns, J. Power Sources, 2001, 102, 172 CrossRef CAS
.
- Z. Sun, H. C. Chiu and A. C. C. Tseung, Electrochem. Solid-State Lett., 2001, 4(3), E9 CrossRef CAS
.
- T. Ioroi, Z. Siroma, N. Fujiwara, S. Yamazaki and K. Yasuda, Electrochem. Commun., 2005, 7, 183 CrossRef CAS
.
- W. S. Baker, J. J. Pietron, M. E. Teliska, P. J. Bouwman, D. E. Ramaker and K. E. Swider-Lyon, J. Electrochem. Soc., 2006, 153, A1702 CrossRef CAS
.
- T. Ushikubo, T. Iizuka, H. Hattori and K. Tanabe, Catal. Today, 1993, 16, 291 CrossRef CAS
.
- T. Uchijima, Catal. Today, 1996, 28, 105 CrossRef CAS
.
- D. A. G. Aranda and M. Schmal, J. Catal., 1997, 171, 398 CrossRef CAS
.
- N. Uekawa, T. Kudo, F. Mori, Y. J. Wu and K. Kakegawa, J. Colloid Interface Sci., 2003, 264, 378 CrossRef CAS
.
- J. X. Wang, S. R. Brankovic and R. R. Adzic, Electrochem. Solid-State Lett., 2001, 4(12), A217 CrossRef
.
- J. McBreen, W. E. O’Grady, K. I. Pandya, R. W. Hoffman and D. E. Sayers, Langmuir, 1987, 3, 428 CrossRef CAS
.
- S. Mukerjee, S. Srinivasan, M. Soriaga and J. McBreen, J. Electrochem. Soc., 1995, 142, 1409 CAS
.
- B. Ravel and M. Newville, J. Synchrotron Radiat., 2005, 12(4), 537 CrossRef CAS
.
- G. K. Williamson and W. H. Hall, Acta Metall., 1953, 1, 22 CrossRef CAS
.
- B. E. Warren and B. L. Averbach, J. Appl. Phys., 1949, 20, 885
.
- F. W. Lytle, R. B. Greegor and J. Panson, Phys. Rev. B, 1988, 37, 1550 CrossRef CAS
.
- M. R. Antonio, I. Song and H. Yamada, J. Solid State Chem., 1991, 93, 183 CrossRef CAS
.
- E. Benfield, J. Chem. Soc., Faraday Trans., 1992, 88, 1107 RSC
.
- H. A. Gasteiger, S. S. Kocha, B. Sompalli and F. T. Wagner, Appl. Catal. B, 2005, 56, 9 CrossRef CAS
.
-
V. G. Levich, Physicochemical Hydrodynamics, Prentice-Hall, Englewood Cliffs, NJ, 1962 Search PubMed
.
- N. A. Anastasijevic, V. B. Vesovic and R. R. Adzic, J. Electroanal. Chem., 1987, 229, 305 CrossRef CAS
.
-
A. C. Riddiford, in Advances in Electrochemistry and Electrochemical Engineering, ed. P. Delahay and C. W. Tobias, Interscience, New York, 1966, vol. IV Search PubMed
.
- N. M. Markovic, H. A. Gasteiger, B. N. Grgur and P. N. Ross, J. Electroanal. Chem., 1999, 467, 157 CrossRef CAS
.
-
D. R. Linde, CRC Handbook of Chemistry and Physics, CRC Press, Boca Raton, FL, 75th edn, 1995 Search PubMed
.
- J. X. Wang, N. M. Markovic and R. R. Adzic, J. Phys. Chem. B, 2004, 108, 4127 CrossRef CAS
.
- S. Mukerjee, S. Srinivasan, M. Soriaga and J. McBreen, J. Electrochem. Soc., 1995, 142, 1409 CAS
.
- J. Zhang, F. B. H. Lima, M. H. Shao, K. Sasaki, J. X. Wang, J. Hansen and R. R. Adzic, J. Phys. Chem. B., 2005, 109, 22701 CrossRef CAS
.
- J. Zhang, K. Sasaki, E. Sutter and R. R. Adzic, Science, 2007, 315, 220 CrossRef CAS
.
- R. Schaub, P. Thostrup, N. Lopez, E. Laegsgaard, I. Stensgaad, J. K. Nørskov and F. Besenbacher, Phys. Rev. Lett., 2001, 87, 266104 CrossRef CAS
.
-
J. B. Goodenough, in Progress in Solid state Chemistry, ed. H. Reiss, Pergamon Press, Oxford, 1971, vol. 5, p. 359 Search PubMed
.
- C. M. Reich, A. Kaiser and J. T. S. Irvine, Fuel Cells, 2001, 3–4, 1
.
- B. Hammer and J. K. Nørskov, Adv. Catal., 2000, 45, 71 CAS
.
- W. S. Epling, C. H. F. Peden, M. A. Henderson and U. Diebold, Surf. Sci., 1998, 412, 333 CrossRef
.
- W. Göpel, G. Rocker and R. Feierabend, Phys. Rev. B, 1983, 28, 3427 CrossRef CAS
.
- G. Pacchioni, ChemPhysChem, 2003, 4, 1041 CrossRef CAS
.
- A. Borgschulte, J. H. Rector, B. Dam, R. Griessen and A. Züttel, J. Catal., 2005, 235, 353 CrossRef CAS
.
Footnote |
| † The HTML version of this article has been enhanced with colour images. |
| This journal is © the Owner Societies 2008 |
