ESIPT-exhibiting protein probes: a sensitive method for rice proteins detection during starch extraction
Mateus Borba
Cardoso
a,
Dimitrios
Samios
a,
Nádya Pesce
da Silveira
*a,
Fabiano Severo
Rodembusch
*b and
Valter
Stefani
b
aUniversidade Federal do Rio Grande do Sul-Instituto de Química, Laboratório de Instrumentação e Dinâmica Molecular, Av. Bento Gonçalves, 9500. CP 15003 CEP 91501-970, Porto Alegre-RS, Brazil. E-mail: nadya@iq.ufrgs.br; Fax: +55 51 3316 7304; Tel: +55 51 3316 6291
bLaboratório de Novos Materiais Orgânicos, Av. Bento Gonçalves, 9500. CP 15003 CEP 91501-970, Porto Alegre-RS, Brazil. E-mail: rodembusch@iq.ufrgs.br; Tel: +55 51 3316 6285
First published on 2nd November 2006
Abstract
The 2-(4′-isothiocyanate-2′-hydroxyphenyl)benzoxazole dye was successfully applied as label of rice proteins during the alkaline extraction of starch. Direct fluorescence measurements were used to observe the presence of proteins labelled in different steps of rice starch extraction. The results were compared to those obtained with the well-known biuret colorimetric test. Whereas the colorimetric test indicates the absence of protein after the third extraction step, the fluorescence emission of the conjugate could be observed in all extraction steps. The separation of different rice proteins could also be observed.
Introduction
The increasing use of starch as an additive in the food industry1 has increased interest in its isolation as high purity granules having well-defined physical properties. Nowadays, the main procedures used to isolate the starch granules are divided in two steps: protein–starch separation and starch purification or washing.2–7 It is well known that rheological properties of industrial starch derivatives change in the presence of proteins, which are treated as contaminants. Hence, the detection of proteins during the protein–starch separation step becomes important in the starch isolation procedure.Rice grains contain four types of proteins in the endosperm: albumin, globulin, glutelin and prolamin. They are tightly associated to the surface of the starch granule making their removal and detection difficult.8 The four well known rice proteins are usually fractioned by selective solubility. Firstly the rice flour is extracted with water to obtain the albumin fraction. Next, a sequential extraction using dilute brine, dilute alkali and 70% ethanol solution allows one to obtain globulin, glutelin and prolamin fractions, respectively.9 However, since this procedure is not appropriate for industrial starch production, the alkaline extraction is usually applied as an effective method to obtain starches from rice.2–4,7,10 The final step of the alkaline extraction of rice starch involves the detection of proteins using the classical biuret colorimetric test.11,2 Starches isolated by the alkaline extraction represent between 0.07 and 0.42% of residual protein.3,4
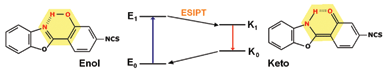
Organic fluorescent dyes have been used successfully to label biological systems with very good results, 12–16 due to their high sensitivity.16–18 A particular application of fluorescent dyes as protein probes was observed for some benzazole isothiocyanates.19 They present a high intensity of fluorescence with a large Stokes shift due to an intramolecular proton transfer phenomena in the excited state (ESIPT) (Fig. 1).20 The interaction between the isothiocyanate dyes and the proteins results in very stable conjugates, where the isothiocyanate moiety is covalently bound to the amino group of the proteins.
 | ||
| Fig. 1 ESIPT mechanism of the isothiocyanate benzoxazole dye. | ||
The main goal of this paper is to evaluate the presence of rice proteins during alkaline starch extraction by means of direct fluorescence detection from rice protein fluorescent probes using a ESIPT-exhibiting benzoxazolic isothiocyanate derivative. The results are compared to those obtained using the classical colorimetric biuret test.
Experimental
Materials and methods
Industrial indica rice (BR-IRGA 410) of Brazilian origin was supplied by Cooperativa Arrozeira Extremo Sul (Pelotas-Brazil), containing approximately 8% protein, 32% amylose, 58% amylopectin and 2% other components. Rice was milled until it had a size distribution between 0.10 and 0.42 mm. The 2-(4′-isothiocyanate-2′-hydroxyphenyl)benzoxazole dye was prepared and purified according to the methodology previously described.19 Analytical grade solvents (Merck) were used as received. Milli-Q water was used for the chemical tests. UV-Vis absorption was measured on a Shimadzu UV-1601PC spectrophotometer. Fluorescence spectra were obtained with a Hitachi spectrophotometer model F-4500. All experiments were performed at room temperature (25 °C).Starch–protein separation
The alkaline separation of the proteins from the rice starch was performed as described elsewhere.2 In order to soften the endosperm, 1.8 g of milled rice flour was steeped in 18 ml of sodium hydroxide (NaOH 0.25%) and allowed to settle for 24 h at room temperature (25 °C). The supernatant liquor (12 ml) was discarded and the remaining slurry was diluted to the original volume (18 ml) with the NaOH solution. The mixture was shaken for 10 min and centrifuged at 1250 rpm for 5 min. Finally, 12 ml of the aqueous solution containing the proteins were separated from the precipitated starch. This procedure was performed eight times giving eight solutions with different protein contents.Biuret colorimetric test
The biuret test was applied to all of the extraction steps following standard procedures.11 In this method, protein detection is based on the capacity of the cupric ion to form coordination compounds with nitrogen in the peptide bond of the proteins. Four different color graduations provide qualitative information about the presence of proteins, as follows: light blue, which indicates protein absence; dark blue, indicating the probable presence of protein; and light purple and dark violet, indicating the presence of protein.General procedure for protein labelling
The isothiocyanate was dissolved in DMSO to a final concentration of 1 mg ml−1. Small aliquots of this solution (400 µl) were added, slowly and with gentle stirring, to 5 ml of the solution. The protein–dye mixture was kept overnight at room temperature (25 °C). The rice proteins were labelled using an excess of fluorochrome in order to increase the maximum yield, since it is reasonable to assume that labelling will not occur for all protein residues. In addition, some residues may be unavailable due to protein folding. These labelled proteins could not be separated from free dyes by gel filtration chromatography on Sephadex® G-50, in contrast to what was observed in a previous work using the same dye.19 In the present work, the separation of the labelled protein from free fluorescent dye was achieved by washing the eight protein solutions five times with ethyl acetate, in which the dye is highly soluble.Results
Biuret colorimetric test
The results of the biuret test for the eight solutions are presented in Fig. 2 and summarized in Table 1.| Solution | Color graduation | Qualitative information |
|---|---|---|
| 1 | Deep violet | Presence of protein |
| 2 | Light purple | Presence of protein |
| 3 | Dark blue | Non-conclusive |
| 4 | Light blue | Absence of protein |
| 5 | Light blue | Absence of protein |
| 6 | Light blue | Absence of protein |
| 7 | Light blue | Absence of protein |
| 8 | Light blue | Absence of protein |

The colors obtained for solutions 1 and 2 clearly indicate the presence of proteins. The color of solution 3 was not conclusive and the following solutions exhibited a light blue color, which indicates the absence of protein.
Photophysical characterisation
Fig. 3 shows a set of fluorescence emission spectra obtained from the successive washing of solution 8 with ethyl acetate in order to remove free dye. It is worth mentioning that all solutions presented the same photophysical behaviour. | ||
| Fig. 3 Fluorescence emission spectra of the organic layers obtained from solution 8, which was washed five times with ethyl acetate. | ||
Since the fluorescence emission spectra was obtained from the organic layers, higher intensity located at higher wavelengths could be expected, due to the ESIPT mechanism. However, a main emission band (378 nm) ascribed to the normal emission, blue-shifted in relation to the ESIPT band (470 nm), was observed. This is due to the dye sensitivity, which indicates the presence of a small amount of aqueous NaOH in the organic layers. In a solution of freshly distilled AcOEt , the fluorescent dye presents one main band located at around 470 nm, as expected, in the absence of basic solution. As can also be seen in Fig. 3, the fluorescence intensity for the first organic layer is lower than the second one, indicating fluorescence quenching due to the large amount of free dye removed in the first washing. The following organic layers show a decrease in the fluorescence intensity due to lower dye contents. The absence of fluorescence emission can be observed in the fifth washing step, indicating that all free dyes were removed.
Fig. 4 depicts the fluorescence emission spectra of solutions 1–3 after free dye extraction. In solution 1, all proteins are expected to be present. Due to the different protein solubilities, the NaOH solution extracted all the albumin and globulin (water and brine soluble) and a partial amount of glutelin and prolamin (alkali and ethanol soluble) from the slurry. According to the biuret test, it was possible to observe the presence of a significant amount of protein in solution 1, leading to a high protein–dye conjugate concentration. This result corroborates with the low intensity emission band observed in Fig. 4, due to fluorescence quenching, which refers to a process that decreases the fluorescence intensity of the sample. The photophysical behaviour observed in Fig. 4 is probably a state quenching between the dye and the quencher, which is the protein that has the highest concentration in solution, and this complex is non-fluorescent. In addition, the fluorescent probe seems to be in a hydrophobic environment, since the main band located at 475 nm is attributed to the ESIPT mechanism.
 | ||
| Fig. 4 Fluorescence emission spectra of solutions 1–3. The inset represents the amplified fluorescence emission spectra of solution 1. | ||
In solution 2, due to the absence of albumin and globulin and the partial extraction of glutelin and prolamin in the first solution, the absence of fluorescence quenching gives a higher intensity.
Depending on the protein, the dye will be constrained into two different environments. These correspond to a hydrophobic environment, as in the glutelin–dye conjugate, related to the ESIPT band of the dye (465 nm) and a hydrophilic environment, as in the prolamin–dye conjugate, related to the blue-shifted band (405 nm). The latter is ascribed to the normal relaxation of the dye.20
In solution 3, a main band is observed at 402 nm, which is blue-shifted in relation to the ESIPT band (443 nm). It indicates the same hydrophilic and hydrophobic environments observed in the previous step.
The relative amount of glutelin and prolamin in solutions 2 and 3 may also be evaluated, taking the band intensities into account. In solution 2, where glutelin is expected to be present in a large amount compared to prolamin, a ratio IESIPT/Inormal of 2.03 was determined. Since glutelin is more soluble in NaOH solutions, most of the protein was removed in solutions 1 and 2. Solution 3 presents an inversion of the band intensities, giving an intensity ratio IESIPT/Inormal of 0.86.
Fig. 5 presents the fluorescence emission spectra of solutions 4–8. A main fluorescence emission band located between 394–412 nm is observed, related to the normal emission of the dye. The band located at 440 nm is not observed after solution 3, probably indicating that glutelin was totally removed at this point. Hence, contrary to the results of the biuret test, fluorescence emission indicates the presence of protein–dye conjugates even in the last solution from the alkaline extraction. It can be concluded that prolamin remains in solution, despite the alkaline treatment.
 | ||
| Fig. 5 Fluorescence emission spectra of solutions 4–8. | ||
Conclusions
An isothiocyanate benzazole derivative, highly fluorescent when irradiated with UV-light, was successfully used to label rice proteins. A complex photophysical behaviour was observed for protein–fluorescent dye conjugates in the different steps of protein alkaline extraction from starch, indicating that the environment plays a fundamental role in dye decay pathways. Due to the presence of different proteins in solution, constraint of the dye in hydrophobic and hydrophilic media was observed. With a reduced amount of protein in the solutions, the dye was shown to be exposed only to hydrophilic media. The isothiocyanate dye allows the detection of proteins in solution even in the last extraction step of the alkaline extraction of rice starch, proving to be more sensitive than the biuret colorimetric test.Acknowledgements
We are grateful for financial support from the Brazilian agencies CNPq, CAPES and FAPERGS. The authors thank the Cooperativa Arrozeira Extremo Sul for the rice sample.References
- B. O. Juliano, Rice starch: production, properties and uses, in Starch: Chemistry and Technology, ed. R. I. Whistler, J. N. BeMiller and E. F. Paschall,Academic Press, Inc.,New York, 1984 Search PubMed.
- N. S. Sodhi and N. Singh, Morphological, thermal and rheological properties of starches separated from rice cultivars grown in India, Food Chem., 2003, 80, 99–108 CrossRef.
- C. C. Yang, H. M. Lai and C. Y. Lii, The modified alkaline steeping method for the isolation of the rice starch, Food Sci. (Beijing, China), 1984, 11, 158–162 Search PubMed.
- N. Lumdubwong and P. A. Seib, Rice starch isolation by alkaline protease digestion of wet-milled rice flour, J. Cereal Sci., 2000, 3, 63–74 CrossRef.
- L. Wang and Y. J. Wang, Comparison of protease digestion at neutral pH with alkaline steeping method for rice starch isolation, Cereal Chem., 2001, 78, 690–692 Search PubMed.
- H. S. Guraya, C. James and E. T. Champagne, Physical basis for separation of rice starch using various density gradient systems and its effect on starch recovery, purity, and pasting properties, Starch, 2003, 55, 450–456 Search PubMed.
- H. Chiou, M. Martin and M. Fitzgerald, Effect of purification methods on rice starch structure, Starch, 2002, 54, 415–420 Search PubMed.
- Y. Tanaka, T. Sugimoto, M. Ogawa and Z. Kasai, Isolation and characterization of two types of protein bodies in the rice endosperm, Agr. Biol. Chem. Tokyo, 1980, 44, 1633–1639 Search PubMed.
- S. Agboola, D. Ng and D. Mills, Characterisation and functional properties of Australian rice protein isolates, J. Cereal Sci., 2005, 41, 283–290 CrossRef CAS.
- R. J. Dimler, H. A. Davis, C. E. Rist and G. E. Hilbert, Production of starch from wheat and other cereal flours, Cereal Chem., 1944, 21, 430–446 Search PubMed.
- AACC Method 46–15: Approved Methods of the American Association of Cereal Chemists (Approved Methods Committee), AACC International, St. Paul, MN, 10th edn, 2000 Search PubMed.
- W. C. Sun, K. R. Gee and R. P. Haugland, Synthesis of novel fluorinated coumarins: excellent UV-light excitable fluorescent dyes, Bioorg. Med. Chem. Lett., 1998, 8(22), 3107–3110 CrossRef CAS.
- E. Gök and S. Olgaz, Binding of fluorescein isothiocyanate to insulin: a fluorimetric labeling study, J. Fluoresc., 2004, 14(2), 203–206 CrossRef.
- G. Sartor, R. Pagani, E. Ferrari, R. T. Sorbi, A. Cavaggioni, P. Cavatorta and A. Spisni, Determining the binding capability of the mouse major urinary proteins using 2-naphthol as a fluorescent probe, Anal. Biochem., 2001, 292(1), 69–75 CrossRef CAS.
- N. Dicesare and J. R. Lakowicz, Evaluation of two synthetic glucose probes for fluorescence-lifetime-based sensing, Anal. Biochem., 2001, 294(2), 154–160 CrossRef CAS.
- R. P. Haughland, Molecular Probes, Handbook of Fluorescent Probes and Research Chemicals, Molecular Probes, Eugene, OR, 1992 Search PubMed.
- E. P. Diamandis, Fluorescence spectroscopy, Anal. Chem., 1993, 65(12), R454–R459.
- Fluorescent and Luminescent Probes for Biological Activity. A Practical Guide to Technology for Quantitative Real-Time Analysis, ed. W. Mason, Academic Press, New York, 2nd edn, 1999 Search PubMed.
- (a) F. S. Rodembusch, F. P. Leusin, L. F. C. Medina, A. Brandelli and V. Stefani, Synthesis and spectroscopic characterisation of new ESIPT fluorescent protein probes, Photochem. Photobiol. Sci., 2005, 4, 254–259 RSC; (b) M. G. Holler, L. F. Campo, A. Brandelli and V. Stefani, Synthesis and spectroscopic characterisation of 2-(2′-hydroxyphenyl)benzazole isothiocyanates as new fluorescent probes for proteins, J. Photochem. Photobiol., A, 2002, 149(1–3), 217–225 CrossRef CAS.
- (a) M. A. Ríos and M. C. Ríos, Ab initio study of the hydrogen bond and proton transfer in 2-(2′-hydroxyphenyl)benzothiazole and 2-(2′-hydroxyphenyl)benzimidazole, J. Phys. Chem. A, 1998, 102, 1560 CrossRef CAS; (b) F. Vollmer, W. Rettig and E. Birckner, Photochemical mechanisms producing large fluorescence Stokes shifts, J. Fluoresc., 1994, 4(1), 65–71 CAS; (c) F. S. Rodembusch, F. P. Leusin, L. B. Bordignon, M. R. Gallas and V. Stefani, New fluorescent monomers and polymers displaying an intramolecular proton-transfer mechanism in the electronically excited state (ESIPT). Part II. Synthesis, spectroscopic characterization and solvatochromism of new benzazolylvinylene derivatives, J. Photochem. Photobiol., A, 2005, 173, 81–92 CrossRef CAS.
| This journal is © The Royal Society of Chemistry and Owner Societies 2007 |