DOI:
10.1039/B606807C
(Tutorial Review)
Chem. Soc. Rev., 2007,
36, 31-45
The long and winding road to the structure of homo-DNA
Received
17th July 2006
First published on 3rd October 2006
Abstract
Homo-DNA ((4′→6′)-linked oligo-2′,3′-dideoxy-β-D-glucopyranose nucleic acid) constitutes the earliest synthetic model system whose pairing properties have been studied within an etiology of nucleic acid structure. Its conception as part of a program directed at a rationalization of Nature's selection of pentoses over other candidates as the carbohydrate building block in the genetic material was motivated by the question: why pentose and not hexose? Homo-DNA forms an autonomous pairing system and its duplexes are entropically stabilized relative to DNA duplexes. Moreover, the base pairing priorities in homo-DNA duplexes differ from those in DNA. A deeper understanding of the particular properties of homo-DNA requires knowledge of its structure. Although diffraction data for crystals of a homo-DNA octamer duplex were available to medium resolution in the mid-1990s, it took another decade for the structure to be solved. In this tutorial Review we describe the odyssey from the crystallization to the final structure determination with its many failures and disappointments and the development of selenium chemistry to derivatize nucleic acids for crystallographic phasing. More than fifty years after the discovery of the DNA double helix, the story of homo-DNA also provides a demonstration of the limits of theoretical models and offers a fresh view of fundamental issues in regard to the natural nucleic acids, such as the origins of antiparallel pairing and helicality.
 Martin Egli | Martin Egli is Professor of Biochemistry at Vanderbilt University School of Medicine. His research interests include the three-dimensional structures of DNA, RNA and chemically modified nucleic acids, interactions of nucleic acids with water and ions, the specificity and inhibition of Ser/Thr kinases, the structure and function of the cyanobacterial KaiABC circadian clock, and interactions between trans-lesion DNA polymerases and adducted DNA. |
 Paolo Lubini | Paolo Lubini is Professor of Chemistry at Liceo di Lugano 2 and teaches education of Chemistry at the Alta Scuola Pedagogica of Locarno. His research interests include modeling of uniform dynamical systems as well as developing new ways of teaching chemistry based upon the early introduction of the concepts of chemical potential and entropy. He worked on the homo-DNA project as a PhD student with Martin Egli between 1992 and 1995. |
 Pradeep S. Pallan | Pradeep S. Pallan is a post-doctoral fellow in the Department of Biochemistry, Vanderbilt University School of Medicine. He is conducting research on the physical and chemical properties of natural and synthetic nucleic acids, and the three-dimensional structures of nucleic acids and their complexes with proteins. He has been working on the homo-DNA project with Martin Egli for the past three years. |
1. Introduction
1.1. Why pentose and not hexose nucleic acids?
Reacting a glycolaldehyde phosphate precursor under a variety of conditions demonstrated that hexose- and pentose-sugar phosphates could be obtained in similar yields (reviewed in ref. 1). This led to the question why nature uses exclusively pentoses as the building blocks for the nucleic acids, but never hexoses? An investigation of the properties of alternative pairing systems based on hexose nucleic acids was expected to provide insight into the preference for 2′-deoxyribofuranose and ribofuranose over all other potential candidates. The 2′,3′-dideoxy analogue of D-allopyranose nucleic acid was selected as the initial model system. Straightforward access to oligo-2′,3′-dideoxyhexopyranosyl-nucleotides using standard phosphoramidite chemistry provided one of the motivations for choosing this particular model system.2,3 Artificial oligonucleotide systems whose pairing properties were studied during the last 10 years featured in their backbones allose, altrose and glucose (hexo-pyranoses),4 pento-pyranose,5–7 tetro-furanose8,9 and numerous other sugars (reviewed in refs. 1 and 10).
1.2. Qualitative conformational analysis of homo-DNA
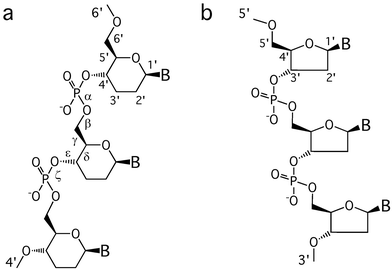
Oligonucleotides with the standard 2′-deoxyribofuranose replaced by the 2′,3′-dideoxyglucopyranose in their backbone differ from natural DNA solely by an additional methylene group between the C1′ and C2′ atoms (Fig. 1). Therefore, the hexose analogue can be considered a DNA homologue and hence the term homo-DNA.11
 |
| | Fig. 1 Structures of (a) homo-DNA and (b) DNA. | |
Replacing the 5-membered sugar moiety by a 6-membered one has a number of important conformational consequences. Compared with the ribofuranose, the pyranose is conformationally more restricted. Thus, in the pyranose, the conformation of the endocyclic torsion angle δ between C4′ and C5′ is fixed at ca. +60°. In the furanose 5-membered ring, the corresponding torsion angle varies between +80° (C3′-endo, A-type conformation) and 150° (C2′-endo, B-type conformation) (Fig. 2). The activation barrier between the two states is relatively low and is estimated to be ca. 0.6 kcal mol−1.12
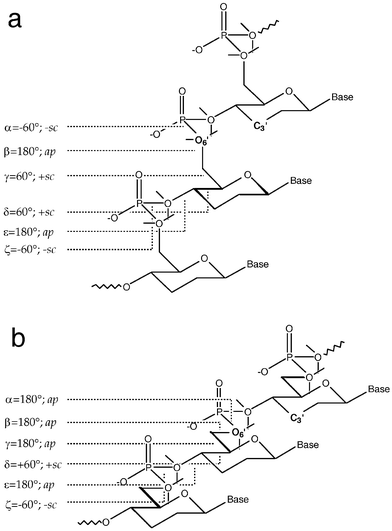 |
| | Fig. 2 Predicted conformations of the homo-DNA backbone based on a qualitative conformational analysis of the oligonucleotide single strand.11 Ideal values of the individual torsion angles are included, along with the conformational ranges. The directions of the lone pairs of 6′-oxygen atoms are drawn with thin lines. (a) Backbone variant with a conformation of the phosphodiester group that is in accordance with the anomeric effect (α and ζ adopt −sc conformation). (b) Backbone variant with an extended conformation and α and ζ lying in the ap and −sc ranges, respectively. Note the linear “ladder-like” arrangement of the backbone, lacking helicality, and the resulting obligatory 1,5-repulsion between O6′ and C3′ in both structural models. For a value of −120° of χ, the resulting normal distances between adjacent base pairs in models a and b are 5 and 6 Å, respectively. | |
A qualitative conformational analysis of the sugar–phosphate backbone in homo-DNA was performed,11 based on the following steric and stereoelectronic criteria: (i) All torsions around single bonds adopt ideally staggered conformation; (ii) if constitutionally possible at all, 1,5-type repulsions between 1,3-substituents are to be avoided; (iii) phosphate groups display gauche arrangements (torsion angles α and ζ are either +sc/+sc or −sc/−sc), consistent with the anomeric effect; (iv) the nucleotide conformation must generate a repetitive arrangement at the oligomer level. Of all 486 possible conformations, only three were found to fulfil these four criteria. Only one of the three is repetitive, potentially constituting a structural model for a homo-DNA strand that allows duplex formation via base pairing. An idealized representation of this conformational genus is depicted in Fig. 2a. If the stereoelectronic criterion for the conformation of the phosphodiester group is applied less stringently, one can envision a second type of backbone geometry. In this case, torsion angle α alters its conformation from −sc to ap and torsion angle γ switches from +sc to ap (Fig. 2b).
1.3. Pairing stability and selectivity of homo-DNA
The thermodynamic stabilities of dozens of homo-DNA duplexes of varying sequence and length were determined using standard UV-melting techniques.3,4 The results can be summarized as follows. (i) Homo-DNA duplexes form antiparallel duplexes with purine–pyrimidine base pairs; G–C and A–T base pairs are of the Watson–Crick type and the glycosidic torsion angles χ adopt anti conformation. (ii) Homo-DNA duplexes are thermodynamically more stable than the corresponding DNA duplexes and the higher stability is entropy-based; for example, the melting temperature of the homo-DNA duplex with sequence CGCGAATTCGCG lies 30 °C above that of the corresponding DNA duplex. (iii) In homo-DNA duplexes, adenine and guanine show strong self-pairing and the base pairs are of the reverse-Hoogsteen type (Fig. 3a); the base-pairing selectivity rules for homo-DNA differ from those for natural DNA (Fig. 3b). (iv) Guanine/isoguanine and xanthine/2,6-diaminopurine, respectively, form base pairs in homo-DNA duplexes and their stabilities resemble that of the G–C base pair; oligo-G and oligo-isoG do not pair in the case of DNA. (v) Complementary sequences of homo-DNA and DNA do not pair.
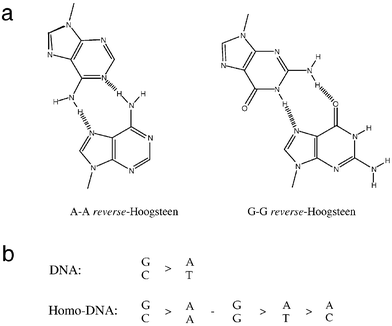 |
| | Fig. 3 (a) Reverse-Hoogsteen type A–A and G–G base pairs in homo-DNA duplexes. (b) Relative stabilities of base pairs in DNA and homo-DNA duplexes. | |
2. Preliminary analyses of the structure of homo-DNA
2.1. Molecular dynamics simulation of a homo-DNA duplex
Attempts to build models of double-stranded homo-DNA molecules based on the derived ideal conformations were met by several problems: (i) Both ideal conformations (Fig. 2) result in a short contact of ca. 2.5 Å between O6′ and C3′; (ii) proper geometry of base pairing requires subtle adjustments of the individual torsion angles; and (iii) even with ideal base-pair geometries and a repetitive overall conformation, the separation between adjacent base pairs in homo-DNA duplexes exceeds the standard stacking distance of 3.4 Å by far. Thus, neighboring base pairs in homo-DNA are not in van der Waals contact, unlike those in natural A- and B-DNA (Fig. 4).
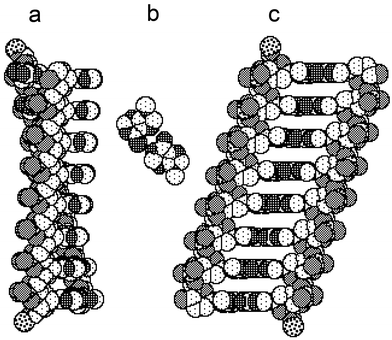 |
| | Fig. 4 Space filling representations of homo-DNA duplexes with sequence dd(A)8. (a) Ideal conformation of octamers, as discussed in chapter 2.2. (α/ζ = −sc/−sc and χ = −120°), leads to divergent arrangements of strands, precluding base pairing interactions. (b) An A–A reverse-Hoogsteen base pair. (c) In order to allow pairing of strands via formation of reverse-Hoogsteen base pairs, specific backbone and glycosidic torsion angles were altered within their ideal conformational ranges (in the present case, χ was adjusted to −110°). Note the resulting large separation between adjacent base pairs (ca. 5 Å), visible as empty spaces between neighboring base pairs. 6′-termini are marked by phosphorus atoms. Atom coding:  | |
In order to assess the conformational consequences of the strain introduced by the short contacts between O6′ and C3′, several molecular mechanics (data not shown) and dynamics simulations were performed. Not surprisingly, an MD simulation of the model duplex [dd(A)8]2 (dd = dideoxy) led to the formation of domains of stacked bases with partial disruption of pairing. These sections were interrupted by gaps with water molecules inserted between base pairs of individual domains (Fig. 5, see figure text for details concerning the MD simulations).
![Result of the molecular dynamics simulation of the homo-DNA duplex [dd(A8)]2.38 Stereo figure representing the averaged structure over the course of 4 ps (between 4 and 8 ps, with a time step of 0.04 ps). The simulation was performed with program GROMOS8739 and the applied parameters were similar to those used in earlier simulations of oligonucleotides in an aqueous environment.40,41 The duplex was immersed in a water box of dimension 22 × 47 × 64 Å (the minimal distances between oligonucleotide atoms and water and box wall were 2.3 Å and 6.7 Å, respectively; 1955 water molecules total). Solvent and homo-DNA duplex (382 atoms) were energy-minimized prior to the MD simulations. Electrostatic interactions were treated with a cut-off radius of 8 Å and periodic boundary conditions were applied. During the integration (step size 0.002 s) the system was coupled to a temperature bath of 300 K at a pressure of 1 atm. The simulation was carried out over the course of 8 ps and the geometry of base pairs was constrained during the initial 2 ps. The most notable features of the duplex are the partial disruption of base stacking and the near-linearity of the backbone with the typical chair conformation of the individual 2′,3′-dideoxyglucopyranose moieties.](/image/article/2007/CS/b606807c/b606807c-f5.gif) |
| | Fig. 5 Result of the molecular dynamics simulation of the homo-DNA duplex [dd(A8)]2.38 Stereo figure representing the averaged structure over the course of 4 ps (between 4 and 8 ps, with a time step of 0.04 ps). The simulation was performed with program GROMOS8739 and the applied parameters were similar to those used in earlier simulations of oligonucleotides in an aqueous environment.40,41 The duplex was immersed in a water box of dimension 22 × 47 × 64 Å (the minimal distances between oligonucleotide atoms and water and box wall were 2.3 Å and 6.7 Å, respectively; 1955 water molecules total). Solvent and homo-DNA duplex (382 atoms) were energy-minimized prior to the MD simulations. Electrostatic interactions were treated with a cut-off radius of 8 Å and periodic boundary conditions were applied. During the integration (step size 0.002 s) the system was coupled to a temperature bath of 300 K at a pressure of 1 atm. The simulation was carried out over the course of 8 ps and the geometry of base pairs was constrained during the initial 2 ps. The most notable features of the duplex are the partial disruption of base stacking and the near-linearity of the backbone with the typical chair conformation of the individual 2′,3′-dideoxyglucopyranose moieties. | |
2.2. NMR solution experiments
The structure of the homo-DNA duplex [dd(A)8]2 in solution was studied by NMR.13 The resulting models show separations of neighboring base pairs that are considerably larger than 3.4 Å. The NMR data are consistent with the existence of two backbone variants, the first with a −sc/−sc conformation of the phosphodiester group, the second with an ap/−sc conformation (see Fig. 2). The structures of both duplexes featured nearly linear backbones. However, it should be pointed out that the applied methods were usually reliable only for determining short range interactions. Thus, the NMR-derived overall helical twists of the homo-DNA duplex models need to be treated with great caution.
2.3. Crystal structures of hexopyranosyl nucleosides
Only very limited information can be gained from the structures of mono-nucleosides with regard to the structure of a double-stranded oligo-glucopyranosylnucleotide fragment. Still, analysis of selected nucleosides with hexopyranosyl sugar moieties has confirmed the conformational rigidity of the six-membered ring. In all studied structures, the sugar features the expected chair conformation. Thus, the endocyclic torsion angle δ lies in the +sc range in all cases, while torsion angle γ adopts either a +sc or an ap conformation (Fig. 6).
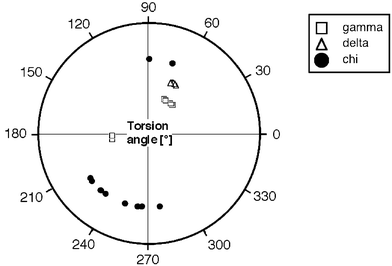 |
| | Fig. 6 Comparison of “backbone” and glycosidic torsion angles in 10 crystal structures of purine and pyrimidine hexapyranosyl nucleosides.38 Note the existence of two γ variants, corresponding to the two types of backbone geometries predicted on the basis of a qualitative conformational analysis of the homo-DNA backbone. | |
2.4. The need for a crystallographic model
Let us return to the original question: “Why pentose and not hexose nucleic acids?”—Does homo-DNA and the analysis of its pairing and conformational properties using modeling and NMR, among other methods, provide an answer? Indeed, one intriguing finding is the fact that replacement of 2′-deoxyriboses by 2′,3′-dideoxyglucopyranoses leads to an alteration of the pairing selectivity rules: Purine–purine base pairs are only slightly less stable than G–C base pairs (Fig. 3b), while the former are not observed for natural DNA. Therefore, the selectivity rules of pairing in natural DNA, G–C > A–T, are not simply a consequence of the base tautomers, but are also related to the nature of the sugar moiety in the nucleic acid backbone. Further, it appears that the familiar helicality of DNA double helices is lost upon replacement of the conformationally flexible pentose–phosphate by a hexose–phosphate backbone. Simple modeling studies as well as solution NMR experiments appear to confirm this more or less linear backbone conformation with rigid hexose chairs. However, this linearity seems to preclude ideal stacking of base pairs. The simple answer to the above question might thus be: “Because of too many atoms in the latter!”11 However, over four decades of work on the structure and function of the natural double helices have taught us that a rough structural model of a molecule and a detailed understanding of its function are not to be confused. Homo-DNA, although initially constituting only a simple model system for attempting to rationalize Nature's choice of pentose sugars for building the genetic material has generated a number of questions concerning its stability and structure on its own. Thus, we arrived at the conclusion that only a crystallographic model of a homo-DNA duplex would provide us with meaningful answers as to its structure and the origins of its pairing stability and selectivity.
3. Hurdles on the way to a crystal structure of homo-DNA
The 2′,3′-dideoxyglucopyranose phosphoramidite G, A, C, T and I (iso-guanine) building blocks were prepared according to published procedures.2 All oligonucleotides were synthesized following standard phosphoramidite protocols using CPG-supports and solid phase synthesizers (Pharmacia Gene Assembler or Applied Biosystems Inc. 381). The detritylated homo-DNA strands were deprotected in conc. NH4OH and HPLC-purified (RP-C4 column Rainin-Dynamax, 0.1 M TEAA pH 7.0, acetonitrile gradient). After desalting (Sep-Pak or ion exchange chromatography), oligonucleotide solutions were micro-filtered and the concentrations of stock solutions were adjusted to between 5 and 15 mM. The following oligomers were synthesized on scales between 2.5 and 20 µmol: dd(AT), dd(GIGI), dd(IGIG), dd(IIGIGG), dd(CGAAAACG), dd(CGAATTCG), dd(CGAAAAAACG) and d(CGCGAATTCGCG).
All crystallizations were performed with the vapor diffusion method, using either hanging or sitting drops. In most cases crystallization was attempted at room temperature and 4 °C. In addition to more standard conditions for nucleic acid crystallization, namely sodium or potassium cacodylate buffer, magnesium chloride, spermine, 2-methyl-2,4-pentanediol (MPD) precipitant, a range of commercial sparse matrix crystallization screens (Hampton Research Inc., Aliso Viejo, CA) was also tested. Diffraction quality crystals could only be grown for the octamer duplex [dd(CGAATTCG)]2 (Fig. 7).
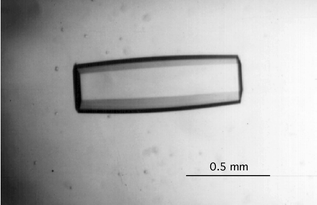 |
| | Fig. 7 Single crystal of dd(CGAATTCG). The crystals were grown by the sitting drop vapor diffusion method: A 20 µL droplet containing 1.5 mM homo-DNA, 6.25 mM sodium cacodylate, pH 7.0, 4 mM magnesium chloride and 12% MPD was equilibrated against a reservoir of 25 mL 30% MPD. Crystals grew over the course of 1.5 to 3 months and to a typical size of 1 × 0.25 × 0.25 mm3. | |
3.2. Precession photography of dd(CGAATTCG) crystals
A homo-DNA octamer crystal was mounted in a glass capillary together with a droplet of mother liquor and precession photographs were recorded using a Huber camera mounted on a rotating anode X-ray generator (Fig. 8). Symmetry and absences (only the [00l] reflections with l = 6n, n = 1, 2 etc. are present; see Fig. 8c) in the photographs of zero and higher layers are consistent with Laue group 6/mmm. Thus, the space group of the crystals is either hexagonal P6122 or P6522. A notable feature of the hk0 layer is the diamond-shaped groups of reflections at a resolution of ca. 4 Å (Fig. 8A). The (8 0 1) reflection at a resolution of 4.2 Å represents the strongest reflection.
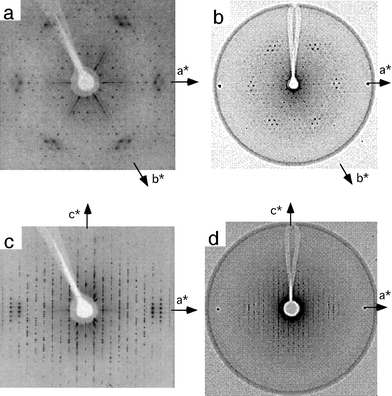 |
| | Fig. 8 Precession photographs of a homo-DNA crystal (CuKα, λ = 1.54 Å, Ni filter, 45 kV and 40 mA). The cell constants are a = b = 39 Å and c = 133 Å. The nominal resolution is 2.8 Å. (a) hk0, (b) hk1, (c) h0l, and (d) h1l. | |
While the information gained from precession photographs does not allow a differentiation between the enantiomorphic space group pair P6122 and P6522, an interesting observation with older or slightly dried out crystals may provide some insight in this respect (Fig. 9). Such crystals, some of them mounted in capillaries, often displayed a left-handed helical hairline fracture. Since 65 screw axes are left-handed by definition, the above macroscopic observation could be taken as a manifestation of a microscopic property of the homo-DNA octamer crystals. For now, we note that there was some (non-conventional) evidence pointing to space group P6522.
![A slightly dried out [dd(CGAATTCG)]2 crystal displaying a left-handed helical hairline fracture along its entire length.](/image/article/2007/CS/b606807c/b606807c-f9.gif) |
| | Fig. 9 A slightly dried out [dd(CGAATTCG)]2 crystal displaying a left-handed helical hairline fracture along its entire length. | |
3.3. Density of crystals and unit cell content
The density of octamer crystals was determined by the floating point method (CCl4, o-xylene, 23 °C, three individual measurements) and was 1.26 g cm−3. Without knowledge of the solvent content this number allows no conclusions as to the number of octamer strands per asymmetric unit in the hexagonal cell. However, previously analyzed crystal structures of double helical DNA fragments can provide some guidance concerning the volume per base pair. In addition, crystal density and diffraction data resolution are correlated. Thus, tightly packed crystals with low solvent content typically diffract to higher resolution. The densities (DNA only) and volumes per base pair for different unit cell contents are listed in Table 1.
Table 1 Hypothetical values of volume per base pair (Vbp, homo-DNA atoms only) and density dx for asymmetric units (a.u.) comprising either one, two, three or four homo-DNA single strands. The column Ref. lists average values based on 73 X-ray crystal structures of oligodeoxynucleotides with resolutions between 2.1 and 3.0 Å. Assuming two strands per asymmetric unit, the solvent content of homo-DNA crystals is ca. 55%
| Single strands/a.u. |
1 |
2 |
3 |
4 |
Ref. |
|
d
x/g cm−3 |
0.28 |
0.57 |
0.85 |
1.14 |
0.71 ± 0.08 |
|
V
bp/Å3 |
3,716 |
1,858 |
1,238 |
928 |
1,438 ± 151 |
The presence of three single strands per asymmetric unit would require a relatively dense packing and it is worth noting that crystals with dx values higher than 0.8 are the exception rather than the rule. Thus, Z-DNA crystals with resolution limits of up to 0.9 Å and a volume per base pair of ca. 1,100 Å3 are practically the only examples among all DNA crystals investigated thus far. Therefore, it seemed likely that the asymmetric unit consists of two dd(CGAATTCG) strands. However, this comparison between DNA and homo-DNA ignored the fact that the homo-DNA base pair features two atoms more than the standard DNA base pair, with the six-membered ring of homo-DNA being more bulky and conformationally more rigid than the ribofuranose. More importantly, the packing arrangement of the homo-DNA duplex may differ significantly from those of double helical A- or B-form duplexes.
3.4. Collection of diffraction data for native crystals
The best data available at the time (ca. 1995) were collected to 2.2 Å resolution at the DESY synchrotron (EMBL outstation, Hamburg, Germany), using a single crystal mounted in a capillary (Fig. 10).
![Completeness of the [dd(CGAATTCG)]2 diffraction data. Crystal size 0.6 × 0.15 × 0.15 mm3; λ = 0.92 Å; room temperature; cell constants a = b = 39.30 Å, c = 133.34 Å; 3,472 unique reflections; 3,287 reflections with F > 2σ(F); Rmerge = 6.3%. The data are 89% complete to 2.2 Å resolution.](/image/article/2007/CS/b606807c/b606807c-f10.gif) |
| | Fig. 10 Completeness of the [dd(CGAATTCG)]2 diffraction data. Crystal size 0.6 × 0.15 × 0.15 mm3; λ = 0.92 Å; room temperature; cell constants a = b = 39.30 Å, c = 133.34 Å; 3,472 unique reflections; 3,287 reflections with F > 2σ(F); Rmerge = 6.3%. The data are 89% complete to 2.2 Å resolution. | |
3.5. Patterson function
Interpretation of the Patterson function (a three-dimensional map of intra- and intermolecular vectors between atoms) of oligonucleotide crystals can yield information, for example about stacking direction and stacking distance, that is crucial for structure determination. After good models became available for the different duplex forms of DNA and RNA, Molecular Replacement entailing Patterson search routines proved to be the method of choice for solving oligonucleotide crystal structures. Patterson maps for the [dd(CGAATTCG)]2 crystal are depicted in Fig. 11.
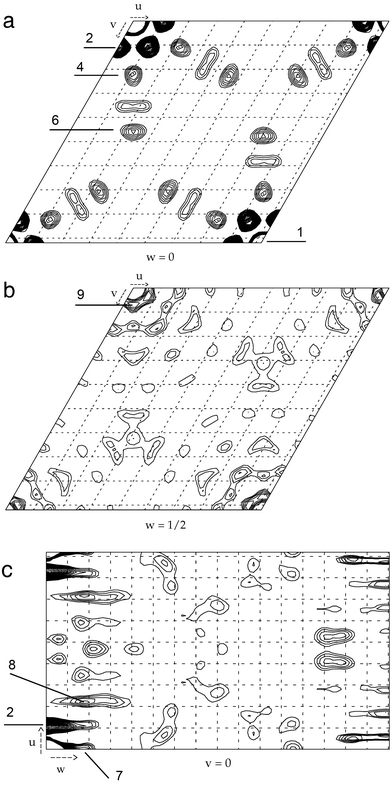 |
| | Fig. 11 Sections through the Patterson map (note the 6/mmm symmetry) of the homo-DNA octamer dd(CGAATTCG): (a) uv0 layer; (b) Harker section at w = 1/2; (c) Harker section at v = 0, with w cut off at 1/2. The raster is 4.2 Å. The Patterson function was calculated with F2-coefficients (program FFT in the CCP suite42) using reflections in the 20 to 2.2 Å range. The lowest contour lines connect points which lie a single standard deviation (1σ) above average. Further contour lines are then drawn at σ/2 steps. Peaks are ordered by magnitude, with 1 designating the highest peak. No significant maxima were observed in the Harker sections at w = 1/3 and w = 1/6. | |
An interesting property of the homo-DNA Patterson function is the strong peaks on the axes and at a distance of 4.2 Å from the origin in the uv0 section (Fig. 11a). These peaks are elongated along the w-direction (Fig. 11c). A further characteristic is the series of peaks along the normals to the axes. Peak No. 4 lies at a distance of 8.5 Å from the origin and the vector to peak No. 6 has a length of 16.7 Å. A further peak that is more elongated along the u-direction is located between these two peaks. Such a pattern could arise from bases that are stacked along the normals to the crystallographic a- or b-directions (Fig. 11a). Although peak No. 2 does not lie in the direction of the normal, one can imagine that it is generated by two strong symmetry-related peaks located 4.2 Å from the origin and on the normals to the a- and b-axis, respectively. This is demonstrated for the structure of the complex between a B-DNA hexamer duplex and the drug nogalamycin in space group P6122 (Fig. 12).14
![Base stacking peaks in the Patterson function of the crystal structure of the complex between [d(CGTACG)]2 and nogalamycin (two drug molecules per duplex): space group P6122, a = b = 26.3 Å, c = 100.01 Å, 3.4 Å raster. (a–c) Simulated Patterson functions (uv0 section) for hypothetical orientations of the DNA molecule in space group P1. The orientations of the molecule along a, b, and the diagonal are depicted on the left-hand side. (d) Experimental Patterson function, representing a superposition of the functions shown in panels a to c. Note the strong peaks near the origin that are the result of overlapping stacking peaks, themselves generated by duplexes lying along the directions of the crystallographic axes (see also Fig. 11a).](/image/article/2007/CS/b606807c/b606807c-f12.gif) |
| | Fig. 12 Base stacking peaks in the Patterson function of the crystal structure of the complex between [d(CGTACG)]2 and nogalamycin (two drug molecules per duplex): space group P6122, a = b = 26.3 Å, c = 100.01 Å, 3.4 Å raster. (a–c) Simulated Patterson functions (uv0 section) for hypothetical orientations of the DNA molecule in space group P1. The orientations of the molecule along a, b, and the diagonal are depicted on the left-hand side. (d) Experimental Patterson function, representing a superposition of the functions shown in panels a to c. Note the strong peaks near the origin that are the result of overlapping stacking peaks, themselves generated by duplexes lying along the directions of the crystallographic axes (see also Fig. 11a). | |
A possible conclusion from the comparison between the DNA and homo-DNA Patterson functions was that the homo-DNA octamer duplex is also oriented along the hexagonal x- and y-axes, with the helix axis normal to the z-direction. However, the relative orientations of base planes and helix axis are probably considerably different in B-DNA and homo-DNA. In B-DNA the helix axis is normal to the best planes through bases and the interpretation of the Patterson function is relatively straight forward. From the observed distance of ca. 4.2 Å between adjacent peaks (if they indeed represent stacking) we cannot conclude that the separation between bases along their normal (the stacking distance) is 4.2 Å. By comparison, peak separation and stacking distance are one and the same in the case of B-DNA. One is reminded of the situation in A-form duplexes where the slide between adjacent base pairs obscures the stacking pattern in Patterson functions. Thus, in B-DNA duplexes helical rise and vertical base separation are both 3.4 Å on average, but in A-form duplexes the helical rise ranges from 2.5 to 2.8 Å, whereas the distance between adjacent bases along their normal is still 3.4 Å. In summary, we have no knowledge of the degree of shearing, or in other words the inclination between base planes and backbone in the homo-DNA duplex. The interpretation of the Patterson function in this respect is not trivial!
3.6. Self-rotation function
In order to potentially establish the presence of non-crystallographic symmetry in [dd(CGAATTCG)]2 crystals, the self-rotation function was computed (Fig. 13). The Kappa angle sections at 60°, 120° and 180° did not reveal any non-crystallographic symmetry. In cases where a non-crystallographic twofold rotation axis runs parallel to a crystallographic 6-fold screw axis, whereby the former penetrates the x,y-plane at (X,Y,0), one would expect a maxima in the uv1/2 Harker section at (2X,2Y,1/2). No unusually high peaks were observed in this section and hence this possibility can be excluded as well. Together, these observations suggested that the homo-DNA duplex (two strands per asymmetric unit, see chapter 3.3.) did not assume a general orientation in the hexagonal unit cell. Rather, the molecular twofold rotation axis of the duplex might coincide with a crystallographic one. More precisely, we assumed that the asymmetric unit was composed of two single strands contributed by two duplexes, both located on crystallographic dyads.
![Self-rotation function based on the crystallographic data of the homo-DNA octamer [dd(CGAATTCG)]2. The function was calculated with the program POLARRFN42 using reflections with F > 1σ(F) in the 10 to 2.5 Å resolution range. Orthogonalization: X along and Z along , pol Z, reference axis X. The integration radius was 15 Å. In the κ = 180° section the three maxima at Ψ = 0°
ϕ = 0°, Ψ = 90°
ϕ = 0°, and Ψ = 90°
ϕ = 30° correspond to the three crystallographic twofold rotation axes; the other maxima are generated by the 6/mmm symmetry. In the κ = 60° section the maximum at Ψ = 0°
ϕ = 0° represents the crystallographic sixfold axis and in the κ = 120° section the maximum at Ψ = 0°
ϕ = 0° represents the crystallographic threefold axis. Thus, no peak can be attributed to a non-crystallographic symmetry relation, neither in the three depicted sections nor in all other κ sections that were calculated (not shown).](/image/article/2007/CS/b606807c/b606807c-f13.gif) |
| | Fig. 13 Self-rotation function based on the crystallographic data of the homo-DNA octamer [dd(CGAATTCG)]2. The function was calculated with the program POLARRFN42 using reflections with F > 1σ(F) in the 10 to 2.5 Å resolution range. Orthogonalization: X along  and Z along and Z along  , pol Z, reference axis X. The integration radius was 15 Å. In the κ = 180° section the three maxima at Ψ = 0°
ϕ = 0°, Ψ = 90°
ϕ = 0°, and Ψ = 90°
ϕ = 30° correspond to the three crystallographic twofold rotation axes; the other maxima are generated by the 6/mmm symmetry. In the κ = 60° section the maximum at Ψ = 0°
ϕ = 0° represents the crystallographic sixfold axis and in the κ = 120° section the maximum at Ψ = 0°
ϕ = 0° represents the crystallographic threefold axis. Thus, no peak can be attributed to a non-crystallographic symmetry relation, neither in the three depicted sections nor in all other κ sections that were calculated (not shown). , pol Z, reference axis X. The integration radius was 15 Å. In the κ = 180° section the three maxima at Ψ = 0°
ϕ = 0°, Ψ = 90°
ϕ = 0°, and Ψ = 90°
ϕ = 30° correspond to the three crystallographic twofold rotation axes; the other maxima are generated by the 6/mmm symmetry. In the κ = 60° section the maximum at Ψ = 0°
ϕ = 0° represents the crystallographic sixfold axis and in the κ = 120° section the maximum at Ψ = 0°
ϕ = 0° represents the crystallographic threefold axis. Thus, no peak can be attributed to a non-crystallographic symmetry relation, neither in the three depicted sections nor in all other κ sections that were calculated (not shown). | |
There remained the possibility that the homo-DNA duplex adopted a general orientation, with the molecular twofold nearly coinciding with a crystallographic one. A peak resulting from crystallographic symmetry could obscure the presence of the non-crystallographic twofold axis. The apparent lack of non-crystallographic symmetry might also stem from a distorted geometry of the homo-DNA duplex in the crystal which would break the molecular symmetry. However, this was considered rather unlikely and without precedence among crystal structures of oligonucleotide duplexes. It is noteworthy that in all reported crystal structures of oligonucleotides with space groups P6122 or P6522 (based on a search in 1995 of the nucleic acid database15), the molecular dyad of the duplex coincided with a crystallographic one (Table 2).
Table 2 Oligonucleotides that crystallize in either space group P6122 (1–7) or P6522 (8,9), with the duplex adopting crystallographic twofold symmetry
| Sequence |
N
a
|
a/Å |
c/Å |
d
b/Å |
R factor |
V
bp
c/Å3 |
Z
d
|
Helix type |
|
Number of nucleosides per strand.
Resolution; 2 represents a complex between the hexamer duplex and two nogalamycin molecules.
Volume per base pair.
Number of single strands per asymmetric unit.
|
|
1 d(GTGTACAC) |
8 |
32.18 |
78.51 |
1.4 |
19.8 |
1,460 |
1 |
A |
|
2 d(Me5CGTsAMe5CG) |
6 + 2 |
26.3 |
100.01 |
2.0 |
20.6 |
1,248 |
1 |
B |
|
3 d(ACCGGCCGGT) |
10 |
39.23 |
78.0 |
2.0 |
18.0 |
1,732 |
1 |
A |
|
4 d(GCGGGCCCGC) |
10 |
39.11 |
79.23 |
1.8 |
18.3 |
1,749 |
1 |
A |
|
5 d(CCGTACGTACGG) |
12 |
46.2 |
71.5 |
2.5 |
15.0 |
1,835 |
1 |
A |
|
6 d(GCGTACGTACGC) |
12 |
46.2 |
71.5 |
2.55 |
14.2 |
1,835 |
1 |
A |
|
7 r(CCCCGGGG) |
8 |
39.74 |
58.54 |
2.5 |
— |
1,667 |
1 |
A |
|
8 (araC-dG)3 |
6 |
17.96 |
43.22 |
1.3 |
28.7 |
1,006 |
1/3 |
Z |
|
9 d(CGCICICG) |
8 |
31.0 |
43.7 |
1.5 |
22.5 |
1,515 |
1 |
Z |
3.7. Molecular replacement
Numerous rotation and translation searches were conducted with the programs X-PLOR16 and AMORE17 and a variety of duplex models in order to try to solve the homo-DNA crystal structure. Moreover, we used an approach that had previously been successfully used to determine the crystal structures of oligonucleotide duplexes with twofold crystallographic symmetry.14,18 A duplex with C2-symmetry was shifted along the twofold rotation axis in 1 Å steps and at each translation step, the duplex was rotated around the axis in 5° steps. For each of the orientations the R factor and correlation coefficient were then calculated and tabulated. In the space groups P6122 and P6522, there are two classes of twofold rotation axes and various constellations were tested: Both duplexes on the same twofold, a single duplex on either class etc. A selection of the models used is depicted in Fig. 14. The fact that none of the calculations resulted in a promising correlation coefficient should not surprise. The determination of an unknown crystal structure (of a duplex that is certainly different from the known nucleic acid duplex forms) with the molecular replacement method has a very low probability of success. If the geometry of a model differs by more than 1.5 to 2.0 Å (rms deviation) from the correct solution, the molecular replacement method usually fails.
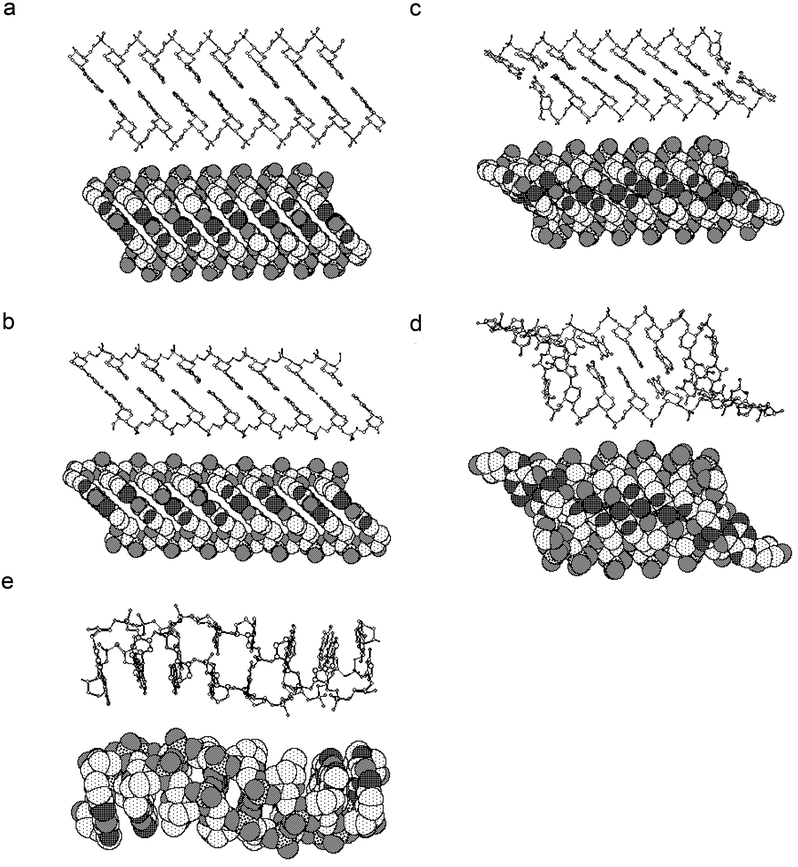 |
| | Fig. 14 Ball-and-stick (top) and space filling (bottom) representations of homo-DNA duplex models used for molecular replacement searches. Models a to d feature a chair conformation of the hexose sugars and in model e the sugars adopt a boat conformation. Other parameters that were varied include inclination (relative orientation of helix axis or backbone and base pairs), the backbone torsion angles α and ζ as well as the glycosidic torsion angle χ. Models d and e were subjected to molecular dynamics simulations. The models are oriented with their molecular twofold rotation axis running normal to the plane of projection. Atoms are coded in the following way:  . . | |
3.8. Bromination of homo-DNA for phasing via multi-wavelength anomalous dispersion (MAD)
The 5-brominated U and C homo-DNA phosphoramidites were synthesized and incorporated either at positions 1 and 7 in the sequence CGAATTCG; (BrC, 2 oligonucleotides) or positions 5 and 6 (BrU, 2 oligonucleotides; 5 µmol synthesis scale in each case). Unfortunately, none of the four derivative strands produced crystals under the native conditions or under conditions which were slightly varied (oligonucleotide and Mg2+ conc., pH, % MPD). Thus, the method of choice for ab initio determination of crystal structures of nucleic acid and protein–nucleic acid complexes failed in the case of homo-DNA.
3.9. Soaking and co-crystallization with heavy atom salts
We also resorted to a tool that is more commonly used for determining the structures of proteins: Heavy atom soaking.19,20 Crystals of oligonucleotides normally lack the large solvent channels that are a hallmark of most protein crystals and allow diffusion of metal ions into the crystals. In addition, the variety of binding sites for ion coordination in DNA is relatively limited: phosphates in the backbone and oxygen and nitrogen acceptors on the bases. Together, these properties account for the relatively small number of oligonucleotide structures that were determined with the help of heavy-atom derivatives (other than brominated or iodinated bases). Examples are the B-DNA dodecamer [d(CGCGAATTCGCG)]221 and the Z-DNA hexamer [d(CGCGCG)]2.22 The transfer RNAs23–25 and many other larger RNA molecules for which structures have recently been reported (e.g. the P4–P6 domain of the Intron Group I ribozyme26 and the Hepatitis Delta Virus ribozyme27) adopt more globular folds and their crystals are more similar to protein crystals in terms of derivative preparation.
Numerous attempts were made to crystallize the homo-DNA duplex in the presence of heavy atom salts of varying concentration or to soak native crystals in heavy atom solutions. The tested salts represented a balanced choice in terms of ionic radius and coordination preference and several of them belong to the most commonly cited heavy-atom derivatizing reagents.19,20,24,25 Thus, Pt(II) can coordinate guanine N7, and a similar preference was observed for Os(IV)-, Mn(II)- und Co(II)-derivatives. Hg(II) binds to O4 of thymine or uracil and Pt(IV) has been shown to coordinate to N7 of adenine. Lanthanide derivates can be expected to bridge adjacent phosphate groups. The Os(III) and Ir(III) hexamines on the other hand have coordination preferences that are very similar to those of Co(III) hexamine.
Homo-DNA crystals were typically stabilized in a solution containing (X = 0): 100 µL 50 mM sodium cacodylate, pH 7, 16 µL 125 mM MgCl2, 84 µL H2O, X
µL 50% MPD heavy atom salt solution and (800 −
X) µL 50% MPD. In this solution, crystals were stable over a long period of time. X was then varied for a selection of heavy atom salts, along with the soaking time, and prior to data collection at low temperature, the crystals were back-soaked in the above stabilizing solution. Heavy-atom salts that were screened included (CH3)HgIICl, cis-(NH3)2PtIVCl4, cis-(NH3)2PtIICl2, CoIII(NH3)6Cl3, ErIII(OAc)3, IrIII(NH3)6Cl3, K2PtIICl4, K2PtIVCl6, OsIII(NH3)6Cl3, PbII(OAc)2, RhII(Cl)2, SmIII(OAc)3, and ZnII(OAc)2. Unfortunately, no viable derivative resulted from these attempts; in many cases crystal turned opaque or were found to diffract X-rays to only very limited resolution. Small hexagonal plates could also be grown by using the original crystallization conditions supplemented by 1 mM SmCl3. However, a MAD data set collected to 2.6 Å resolution did not reveal any anomalous effect. Similarly, the use of alkaline (Rb+, Cs+) and alkali earth metal ions (Sr2+, Ba2+) for phasing28 was unsuccessful in the case of homo-DNA and exposure of native crystals to xenon in a pressure cell failed to produce a derivative as well.
3.10. Conclusions
By the late 1990's we had accumulated a considerable amount of preliminary data for [dd(CGAATTCG)]2 homo-DNA crystals, but the structure remained elusive. All attempts to phase the diffraction data either by the molecular replacement (MR), multiple isomorphous replacement (MIR) or multi-wavelength anomalous dispersion (MAD) methods had failed. MR was unsuccessful due to the lack of suitable models and no crystals were obtained for brominated strands, thus precluding the application of MAD. Clearly, a new approach was needed to crack the problem.
4. Selenium modification of nucleic acids
The use of selenium-modified proteins in combination with MAD phasing has revolutionized protein X-ray crystallography. Incorporation of Se-Met in place of Met into proteins is easily accomplished at least in the case of E. coli expression systems and crystals of Se-Met proteins are normally highly isomorphous with those of the corresponding wild-type species. It is estimated that about two thirds of all new crystal structures of proteins are now determined by Se-Met MAD.29 The approach has proven critical in the advancement of high-throughput structure determination efforts as part of currently on-going structural genomics projects in the USA, Europe and Japan. Selenium has a theoretical K absorption edge of 0.979 Å and the anomalous effect on scattering is similar in magnitude to that of bromine (K-edge 0.920 Å).
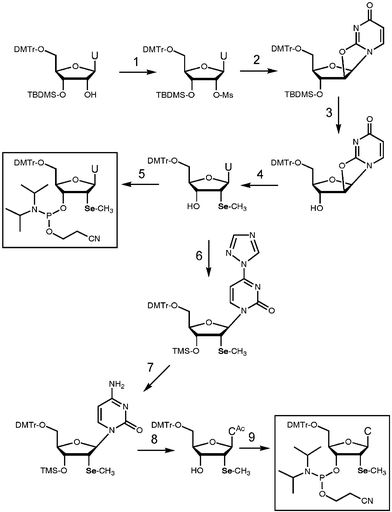
DNA and RNA offer a number of sites for incorporating selenium but syntheses of analogues with either phosphate, sugar or base oxygen atoms replaced by Se may encounter various levels of difficulty. Initially, we turned to the 2′-position of 2′-deoxyribose as a possible site for introducing selenium. In collaboration with Zhen Huang's laboratory at Georgia State University (Atlanta, GA), we prepared the 2′-methylseleno-uridine (2′-SeMe-U) phosphoramidite building block (Fig. 15).30 Subsequently, a synthetic route to the 2′-SeMe-C phosphoramidite was also developed.31 2′-SeMe-U was incorporated into several DNA and RNA oligonucleotides and we carried out a MAD structure analysis of a DNA decamer containing a single 2′-SeMe-U residue.32 In terms of the derivatization of double helical fragments, the use of 2′-SeMe-U is limited to A-form DNA and RNA. This is due to the preference for a C3′-endo conformation by 2′-modified analogues. However, 2′-SeMe-modification offers an attractive alternative to 5-bromo pyrimidines for derivatizing RNA. For example, the crystal structure of a Diels–Alder ribozyme was recently determined by 2′-SeMe-U MAD phasing.33 The 2′-SeMe-U phosphoramidite is now commercially available from Glen Research Corporation (Sterling, VA).
5. Phasing of the homo-DNA structure with a single phosphoroselenoate derivative
Although phasing of the A-form DNA with 2′-SeMe-U/MAD provided a proof of principle, the lack of a 2′-functionality precluded application of this approach for solving the homo-DNA structure. The phosphate group offers an alternative site for replacement of oxygen by selenium. Phosphoroselenoate (PSe) modification has the advantage that no specialized nucleoside building blocks are required for incorporating selenium into the nucleic acid fragment of interest. Moreover, any phosphate group can potentially be converted to a PSe moiety and this increases the chances for identifying a viable derivative. PSe-DNA had been tested for potential applications in antisense research,34 but was considered too unstable in serum due to swift conversion to the parent phosphate (PO) oligonucleotide. Nevertheless we set out to explore whether PSe-DNA could serve as a useful derivative for crystallographic phasing. As a prelude we synthesized all 10 d(CGCGCG) hexamers with a single phosphorothioate (PS) group and separated pairs of diastereomers by strong anion exchange (SAX) chromatography. Crystals could be grown for all of them, but the anomalous scattering contribution of sulfur turned out to be too weak for MAD phasing. Instead, we soaked PS-d(CGCGCG) crystals in Tl+, Mn2+ and various Hg(I) salts to assay binding of these metal ions to the PS moiety. Unfortunately, crystals cracked in most cases and diffraction frames of others exhibited streaks that made impossible the collection of high-quality diffraction data.
Encouraged by the successful crystallization of PS-modified Z-DNA hexamers we produced all 10 PSe-d(CGCGCG) strands using standard procedures35 and SAX chromatography for separation of diastereomers. The structure of the [d(CPSeGCGCG)]2 duplex was determined by MAD.36 Because synthesis of all seven diastereomeric pairs of the homo-DNA dd(CGAATTCG) with single PSe moieties would have required unreasonable amounts of the four phosphoramidite building blocks (the yields are low as the oxidation step with iodine during oligonucleotide synthesis results in a significant loss of the PSe function), we assessed the chances for growing crystals of PSe-modified homo-DNAs by conducting crystallization experiments with the corresponding PS-modified octamers. Surprisingly, only two of the 14 PS homo-DNAs yielded crystals. The corresponding PSe-oligonucleotide for one of them, the octamer d(CGAPSeATTCG) with a single SP PSe-moiety, was subsequently prepared and crystallized (Fig. 16). Somewhat surprisingly, given the aforementioned left-handed helical hairline fracture observed with some homo-DNA crystals (Fig. 9), the space group turned out to be P6122 (featuring right-handed 6-fold screw axes). However, inspection of the crystal packing revealed that symmetry-related homo-DNA duplexes form a left-handed (super-) double helix around the right-handed 6-fold screw axis! We will report details of the homo-DNA crystal packing elsewhere. The successful MAD structure determination based on this derivative demonstrates that PSe-oligonucleotides are stable on a crystallographic time scale (several weeks in crystallization droplets; Fig 16). The crystal structure of the homo-DNA dd(CGAATTCG) represents the first example of an unknown structure to be solved using this approach.37
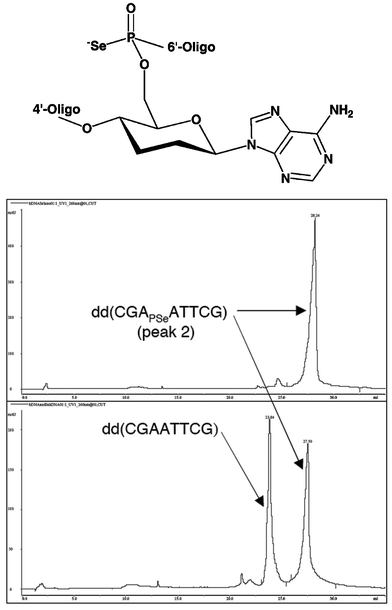 |
| | Fig. 16 Structure and chemical stability of phosphoroselenoate homo-DNA. (top) Structure. (middle) Strong anion exchange (SAX) chromatogram of the crystallization mother liquor one month after setups with peak 2-diastereomer dd(CGAPSeATTCG) containing a single phosphoroselenoate moiety. (bottom) SAX trace of a co-injection of the all-phosphate homo-DNA dd(CGAATTCG) and the above phosphoroselenoate dd(CGAPSeATTCG) immediately after purification. | |
6. The homo-DNA duplex and its implications
6.1. The homo-DNA duplex is not linear
Before the veil was finally lifted from the structure much of the information gathered for homo-DNA crystals over the years had remained enigmatic. The structure finally provided a solution to the puzzle.37 For example, electron density maps reveal a single duplex in a general position, consistent with a solvent content of >50% (Table 1). The duplex exhibits a strong non-crystallographic twofold rotational symmetry, but the molecular dyad is virtually parallel to a crystallographic one, thus obscuring the non-crystallographic symmetry in the κ = 180° section of the self-rotation function (Fig. 13). An interpretation of the Patterson map was not straightforward; although the spacing of peaks that were thought to originate from base stacking showed that the average rise could not be much above 4 Å (Fig. 11), it was impossible to deduce the actual value as the angle between backbone direction and base planes was unknown. And with regard to the local and global twists associated with the hexose backbone, the crystal structure shows that the homo-DNA duplex resembles neither a quasi-linear, inclined ladder nor the familiar, tightly wound double helix adopted by DNA (Fig. 17). The unexpected looping out of two adenosines renders the failure of all structure solution attempts by molecular replacement even less surprising. On the other hand, inspection of the final structure does not explain why crystals could be grown for only two of the 14 possible PS (PSe) homo-DNA octamers, as replacement of either the O1P or O2P oxygen by selenium does not result in short contacts in the majority of cases.
![The homo-DNA duplex [dd(CGAATTCG)]2 viewed (a) roughly along the molecular dyad and perpendicular to the convex surface, (b) across convex surface (right) and minor groove (left), and (c) roughly along the helical axis. The resolution of the structure is 1.75 Å.](/image/article/2007/CS/b606807c/b606807c-f17.gif) |
| | Fig. 17 The homo-DNA duplex [dd(CGAATTCG)]2 viewed (a) roughly along the molecular dyad and perpendicular to the convex surface, (b) across convex surface (right) and minor groove (left), and (c) roughly along the helical axis. The resolution of the structure is 1.75 Å. | |
The strong inclination between backbone direction and base-pair planes is one of the hallmarks of the right-handed homo-DNA duplex (Fig. 17a). Bases from adjacent pairs show sliding along their long axes that exceeds 4 Å on average, resulting almost exclusively in stacking interactions between bases from opposite strands. This phenomenon is particularly obvious at the 6′-and 4′-terminal CpG and the central ApT steps. Therefore, the prevalence of cross-strand stacking does not appear to be dependent on the sequence. Cytosines from paired strands overlap at terminal base-pair steps whereas the cross-strand stacking involves adenines in the center of the duplex (Fig. 17a). A second hallmark of the duplex is its irregular geometry. The average values for helical rise and twist and base roll are 3.8 Å, 14° and 5°, respectively. But values for rise range between just below 3 Å and 5.1 Å, those for twist between −47° and 95° (the third adenosine in both strands is extruded from the duplex), and the rolls vary all the way from −7° to +21° (Fig. 17). Although there can be considerable deviations between the geometries of B-DNAs compared with that of a canonical B-form double helix, the irregularity seen here in a short stretch of homo-DNA is striking. Another somewhat unexpected feature is the relatively short distance between adjacent intra-strand phosphorus atoms that amounts to just 5.8 Å on average. This figure is closer to the distance associated with RNA duplexes than the typical distance of ca. 6.5 Å encountered in B-DNA. Because of the bulkier hexose sugar compared to DNA or RNA and earlier models that had all suggested a wider spacing between adjacent base pairs, one would perhaps have expected an increased P⋯P distance relative to B-DNA or at least an average separation that was closer to 6.5 Å. The conformation of the 2′,3′-dideoxyglucopyranosyl moieties offers no surprise, however; all sugars adopt the expected chair conformation. The backbone around the second T in strand 2 was modeled with two alternative conformations, whereby one involves the hexose in a boat conformation (Fig. 18; lower right-hand corner).
 |
| | Fig. 18 (a) Dimerization of homo-DNA duplexes in the crystal involving swapping of adenosines and formation of reverse-Hoogsteen A–T base pairs. (b) The tight crossing of homo-DNA duplexes around a crystallographic dyad (solid black line) manifests itself in the morphology of homo-DNA crystals. | |
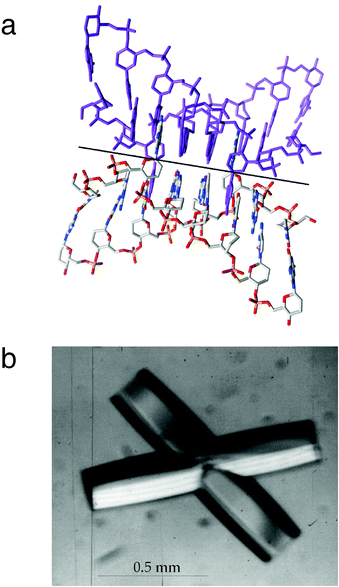
6.2. Base swapping and formation of a tetraplex
The extrusion of adenosines from the duplex was not anticipated and is the result of a tight crossing between two adjacent homo-DNA duplexes in the hexagonal unit cell.37 However, the two adenines are not arranged extra-helically; rather they are inserted into the gaps left by adenines from the duplex mate, the latter's adenines pairing with orphaned Ts from the first duplex (Fig. 18a). This base swapping between pairs of duplexes generates a homo-DNA tetraplex whereby in four places As and Ts from crossed duplexes engage in reverse-Hoogsteen pairs. The relative orientation of strands that contribute a base to the individual pairs is antiparallel. Homo-DNA was previously found to form stable duplexes featuring A–A and G–G pairs of the reverse-Hoogsteen type.4 To our knowledge this intricate packing mode is unique; it avoids a potential clash between base atoms as a result of tightly packed duplexes and instead creates stabilizing stacking, and direct and water-mediated hydrogen bonding interactions. Occasionally, homo-DNA crystals grew in the shape of crossed hexagonal rods (Fig. 18b), undoubtedly a macroscopic manifestation of the molecular packing in the crystal.
6.3. Backbone inclination and cross-pairing
Besides providing a rationale for the absence of pairing by fully hydroxylated allo-, altro- and glucopyranosyl-based oligonucleotides,10,37 the homo-DNA structure has implications with regard to three fundamental issues. These are the origins of (i) the helicality of nucleic acid duplexes, (ii) the ability of different nucleic acid systems to cross-pair (i.e. DNA and RNA), or, alternatively, their inability to do so (i.e. DNA and homo-DNA), and (iii) the preferred antiparallel pairing mode of DNA and RNA (although DNA can form stable parallel-stranded duplexes). The helical twist of homo-DNA is significantly smaller than the twists in A- and B-form duplexes. Based on the average twist observed in the crystal structure 26 residues are required for a full turn. Thus, the extent of twisting is clearly related to the nature of the sugar, and the same is true for the base-pairing priorities exhibited by individual pairing systems.11 Homo-DNA appears to be devoid of the conformational polymorphism characteristic for DNA and, based on all we know now it is unable to adopt a left-handed helical conformation.
However, all this does not explain why DNA and homo-DNA do not pair with each other. The inability to do so may have its origin in a geometric parameter which we will refer to as base-backbone inclination angle. The virtual absence of intra-strand base stacking and the high degree of inter-strand stacking in homo-DNA is the result of a strongly inclined backbone relative to the base-pair axes (Fig. 17a). The drawings in Fig. 19 illustrate that the base-backbone inclination angles for DNA, RNA and homo-DNA deviate, although the actual definition of the angle is somewhat more complicated.37 Although DNA (B-form) and RNA (A-form) have different inclinations they pair because the former can adopt an A-form geometry. However, the differences in the inclinations of DNA and homo-DNA (ca. 45°) and RNA and homo-DNA (ca. 75°) prevent them from cross-pairing. A strong inclination between backbone and bases also precludes a parallel orientation of strands in a duplex (under formation of reverse Watson–Crick base pairs), because the two strands would simply run away from each other. Therefore, neither RNA nor homo-DNA will form parallel-stranded duplexes. On the other hand, the DNA backbone assumes a direction that is more or less normal to the planes defined by bases, enabling it to form duplexes with either parallel or antiparallel orientation of paired strands that exhibit similar stabilities for sequences consisting entirely of A and T residues.
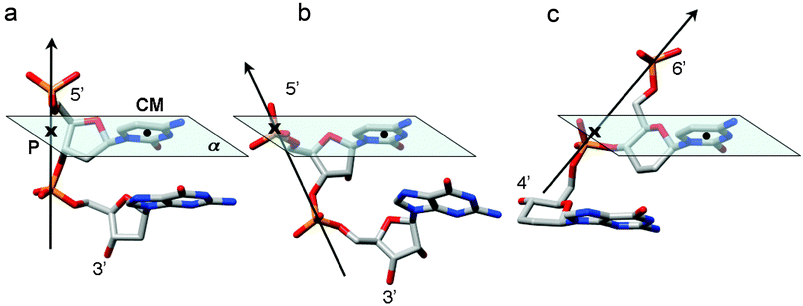 |
| | Fig. 19 Schematic illustration of the varying degrees of backbone-base inclination in (a) DNA (ca. 0°), (b) RNA (ca. −30°), and (c) homo-DNA (ca. +45°). The vectors connect adjacent intra-strand phosphorus atoms, the solid dot corresponds to the center of mass (CM) of the cytosine base, and the cross marks the point (P) where the P→P vector pierces through the plane (α) defined by nucleobase atoms. | |
References
- A. Eschenmoser, Chem. Commun., 2004, 1247–1252 RSC.
- M. Böhringer, H. J. Roth, J. Hunziker, M. Göbel, R. Krishnan, A. Giger, B. Schweizer, J. Schreiber, C. Leumann and A. Eschenmoser, Helv. Chim. Acta, 1992, 75, 1416–1477 CrossRef.
- J. Hunziker, H.-J. Roth, M. Böhringer, A. Giger, U. Diederichsen, M. Göbel, R. Krishnan, B. Jaun, C. Leumann and A. Eschenmoser, Helv. Chim. Acta, 1993, 76, 259–352 CrossRef CAS.
- A. Eschenmoser and E. Loewenthal, Chem. Soc. Rev., 1993, 21, 1–16 RSC.
- S. Pitsch, S. Wendeborn, B. Jaun and A. Eschenmoser, Helv. Chim. Acta, 1993, 76, 2161–2183 CrossRef CAS.
- R. Krishnamurthy, S. Pitsch, M. Minton, C. Miculka, N. Windhab and A. Eschenmoser, Angew. Chem., Int. Ed. Engl., 1996, 35, 1537–1541 CrossRef CAS.
- M. Bolli, R. Micura and A. Eschenmoser, Chem. Biol., 1997, 4, 309–320 CrossRef CAS.
- K. U. Schöning, P. Scholz, S. Guntha, X. Wu, R. Krishnamurthy and A. Eschenmoser, Science, 2000, 290, 1347–1351 CrossRef CAS.
- P. S. Pallan, C. J. Wilds, Z. Wawrzak, R. Krishnamurthy, A. Eschenmoser and M. Egli, Angew. Chem., Int. Ed., 2003, 115, 5893–5895 CrossRef.
- A. Eschenmoser, Science, 1999, 284, 2118–2124 CrossRef CAS.
- A. Eschenmoser and M. Dobler, Helv. Chim. Acta, 1992, 75, 218–259 CAS.
-
W. Saenger, Principles of nucleic acid structure, 1984, Springer Verlag, New York, NY Search PubMed.
- G. Otting, M. Billeter, K. Wüthrich, H.-J. Roth, C. Leumann and A. Eschenmoser, Helv. Chim. Acta, 1993, 76, 2701–2756 CrossRef CAS.
- M. Egli, L. D. Williams, C. A. Frederick and A. Rich, Biochemistry, 1991, 30, 1364–1372 CrossRef CAS.
- H. M. Berman, W. K. Olson, D. L. Beveridge, J. Westbrook, A. Gelbin, T. Demeny, S.-H. Hsieh, A. R. Srinivasan and B. Schneider, Biophys. J., 1992, 63, 751–759 CrossRef CAS.
-
A. T. Brünger, Crystallography & NMR System (CNS), Version 0.3, 1998, Yale University, New Haven, CT Search PubMed.
- J. Navaza, Acta Crystallogr., Sect. A: Fundam. Crystallogr., 1994, 50, 157–163 CrossRef.
- M. Egli, S. Portmann, D. Tracz, C. Workman and N. Usman, Acta Crystallogr., Sect. D: Biol. Crystallogr., 1995, 51, 1065–1070 CrossRef CAS.
- G. A. Petsko, Methods Enzymol., 1985, 114, 147–156 CAS.
- M. A. Rould, Methods Enzymol., 1997, 276, 461–472 CAS.
- R. Wing, H. Drew, T. Takano, C. Broka, S. Tanaka, K. Itakura and R. E. Dickerson, Nature, 1980, 287, 755–758 CrossRef CAS.
- A. H.-J. Wang, G. J. Quigley, F. J. Kolpak, J. L. Crawford, J. H. van Boom, G. A. van der Marel and A. Rich, Nature, 1979, 282, 680–686 CAS.
- A. Rich and U. L. RajBhandary, Annu. Rev. Biochem., 1976, 45, 805–860 CrossRef CAS.
- S.-H. Kim, W.-C. Shin and R. Warrant, Methods Ezymol., 1985, 114, 156–167 Search PubMed.
- S. R. Hoolbrook and S.-H. Kim, Methods Enzymol., 1985, 114, 167–176.
- J. H. Cate, A. R. Gooding, E. Podell, K. Zhou, B. L. Golden, C. E. Kundrot, T. R. Cech and J. A. Doudna, Science, 1996, 273, 1678–1685 CrossRef CAS.
- A. R. Ferré-D'Amaré, K. Zhou and J. A. Doudna, Nature, 1998, 395, 567–574 CrossRef CAS.
- V. Tereshko, C. J. Wilds, G. Minasov, T. P. Prakash, M. A. Maier, A. Howard, Z. Wawrzak, M. Manoharan and M. Egli, Nucleic Acids Res., 2001, 29, 1208–1215 CrossRef CAS.
- W. A. Hendrickson, Trends Biochem. Sci., 2001, 25, 637–643.
- Q. Du, N. Carasco, M. Teplova, C. J. Wilds, X. Kong, M. Egli and Z. Huang, J. Am. Chem. Soc., 2002, 124, 24–25 CrossRef CAS.
- Y. Buzin, N. Carrasco and Z. Huang, Org. Lett., 2004, 6, 1099–1102 CrossRef CAS.
- M. Teplova, C. J. Wilds, Z. Wawrzak, V. Tereshko, Q. Du, N. Carrasco, Z. Huang and M. Egli, Biochimie, 2002, 84, 849–858 CrossRef CAS.
- A. Serganov, S. Keiper, L. Malinina, V. Tereshko, E. Skripkin, C. Hobartner, A. Polonskaia, A. T. Phan, R. Wombacher, R. Micura, Z. Dauter, A. Jäschke and D. J. Patel, Nat. Struct. Mol. Biol., 2005, 12, 218–224 CrossRef CAS.
- K. Mori, C. Boiziau, C. Cazenave, M. Matsukura, C. Subasighe, J. Cohen, S. Broder, J. J. Toulme and C. A. Stein, Nucleic Acids Res., 1989, 17, 8207–8219 CAS.
- M. Koziolkiewicz, B. Uznanski, W. J. Stec and G. Zon, Chem. Scr., 1986, 26, 251–260 CAS.
- C. J. Wilds, R. Pattanayek, C. Pan, Z. Wawrzak and M. Egli, J. Am. Chem. Soc., 2002, 124, 14910–14916 CrossRef CAS.
- M. Egli, P. S. Pallan, R. Pattanayek, C. J. Wilds, P. Lubini, G. Minasov, M. Dobler, C. Leumann and A. Eschenmoser, J. Am. Chem. Soc., 2006, 128, 10847–10856 CrossRef CAS.
-
P. Lubini, Ph.D. Thesis No. 10950, 1995, ETH-Zürich, Zürich, Switzerland.
-
W. F. Van Gunsteren and H. J. C. Berendsen, GROningen Molecular Simulation (GROMOS) library manual, BIOMOS Biomolecular Software Laboratory of Physical Chemistry, 1987, University of Groningen: Groningen, The Netherlands Search PubMed.
- W. F. Van Gunsteren, H. J. C. Berendsen, R. G. Guersten and H. R. J. Zwinderman, Ann. N. Y. Acad. Sci., 1986, 482, 287–303 CAS.
- J. De Vlieg, H. J. C. Berendsen and W. F. van Gunsteren, Proteins, 1989, 6, 104–127 CAS.
- CCP4, Acta Cryst., Sect. D: Biol. Crystallogr., 1994, 50, 760–763 Search PubMed.
|
| This journal is © The Royal Society of Chemistry 2007 |
Click here to see how this site uses Cookies. View our privacy policy here.