Compositional analysis of copper–silica precipitation tubes†
Jason J.
Pagano
,
Stephanie
Thouvenel-Romans
and
Oliver
Steinbock
*
Department of Chemistry and Biochemistry, Florida State University, Tallahassee, FL 32306–4390, USA. E-mail: steinbck@chem.fsu.edu; Fax: +1 850 644 8281; Tel: +1 850 644 4824
First published on 6th November 2006
Abstract
Silica gardens consist of hollow tubular structures that form from salt crystals seeded into silicate solution. We investigate the structure and elemental composition of these tubes in the context of a recently developed experimental model that allows quantitative analyses based on predetermined reactant concentrations and flow rates. In these experiments, cupric sulfate solution is injected into large volumes of waterglass. The walls of the resulting tubular structures have a typical width of 10 µm and are gradient materials. Micro-Raman spectroscopy along with energy dispersive X-ray fluorescence data identify amorphous silica and copper(II) hydroxide as the main compounds within the inner and outer tube surfaces, respectively. Upon heating the blueish precipitate s to approximately 150 °C, the material turns black as copper(II) hydroxide decomposes to copper(II) oxide. Moreover, we present high resolution transmission electron micrographs that reveal polycrystalline morphologies.
1. Introduction
Nature provides us with numerous examples of reaction precipitation processes that cause the formation of permanent tubular structures. For instance, this intriguing type of self-organization gives rise to the huge black “smokers” that grow up to 30 m tall at hydrothermal vents on the ocean’s floor.1 At smaller length scales, it causes the growth of beautiful soda-straw stalactites in caverns2–4 as well as tubular rust in certain corrosion systems5–8 and other electrochemical systems.9 Also on the micrometer scale, one finds many manifestations of hollow fibers such as silica tubes in setting Portland cement10–12 and micro-tubes in the mineralized shells of marine algae.13,14This surprisingly wide spectrum of tubular structures raises the question whether the underlying processes share dynamic similarities such as common features in the driving reaction-transport processes. Alternatively, one might speculate whether they can be assigned to distinct classes such as systems involving amorphous precipitation , crystallization or transient colloidal scaffolds. Unfortunately, many systems do not lend themselves easily to quantitative laboratory studies as they involve inconvenient length and timescales or other complications. An exception is the precipitation tubes found in “chemical gardens” that form millimeter scale precipitation tubes from readily available seeds, such copper salt crystals, and various solutions, including waterglass, within seconds to hours.15–24
Chemical gardens have been mentioned as early as the 17th century25,26 and their life-like appearance piqued the interest of 19th century scientists in search of the origins of life.27 Evidently, advances in biochemistry have dismissed the relevance of chemical gardens as paradigms of pre-biotic life forms. Today they are known primarily as a popular demonstration experiment in young chemist sets.28–31 Nonetheless, recent advances have contributed to a revived scientific interest in these poorly understood structures. Specifically, Collins et al. showed that tubes produced from aluminosilicate gardens are hierarchical nanostructures and powerful Brønsted acid catalysts .32–34
The growth mechanism of chemical gardens is based on the formation of a semipermeable, colloidal membrane around the dissolving seed crystal.35 As the concentration of the metal ion increases, osmotic pressure builds up and inflow of water across the membrane causes it to yield and rupture. The resulting release of typically buoyant solution into the surrounding waterglass creates hollow, vertical structures. The growth speed of these tubes can vary from mm day–1 to mm s–1 and seems to depend crucially on the employed salt seed.
Over the past decades, the major obstacle for quantitative investigations has been the erratic nature of tube growth and its insufficient reproducibility. The underlying mechanisms include the continuous, and hence transient, dissolution of the crystal, the blistering of the membrane at multiple sites, the presence of air bubbles at the growth points,36 and the interaction of neighboring tubes. A recent method developed by Thouvenel-Romans et al. circumvents these problems and allows the collection of quantitative data from reproducible experiments. The key idea behind this method is to replace the seed crystal by a “seed solution” which is injected at constant flow rates into a large volume of silicate solution.37–39 This approach allowed the identification of three distinct growth regimes for which examples are shown in Fig. 1. In the following, we briefly characterize these regimes to aid the discussion of the results presented in this article. Note that the presence of a particular growth regime critically depends on the density difference between the waterglass in the reservoir and the injected cupric sulfate solution. In the following, the silicate concentration is kept constant at 1 M and the waterglass is always denser than the injected, and hence buoyant, solution.
 | ||
| Fig. 1 Image sequences of tubular growth in the jetting (a)–(h), popping (i)–(p) and budding regime (q)–(x). In all experiments, aqueous cupric sulfate solution is injected into 1 M sodium silicate solution at a constant flow rate of 7.0 mL h–1. The time intervals between frames and the image areas are 4.0 s, 14.0 × 4.10 mm2 (a)–(h), 1.0 s, 10.2 × 21.4 mm2 (i)–(p) and 8.0 s, 29.1 × 7.70 mm2 (q)–(x). The concentrations of cupric sulfate are 0.075 M (a)–(h), 0.25 M (i)–(p), and 0.55 M (q)–(x), respectively. | ||
For low cupric sulfate concentrations and therefore high density differences, hydrodynamics dominate the formation of the reaction precipitation tubes that steadily grow around a stable jet of buoyant seed solution. The tube radii are described quantitatively by the Poiseuille-flow characteristics of the buoyant jet of injected solution (Fig. 1, a–h). When the seed concentration is increased to 0.1 M, the jetting regime switches to oscillatory, popping dynamics that involve the periodic formation and detachment of a solution-filled, colloidal gel envelope at the growth point (Fig. 1, i–p). At 0.4 M the popping behavior changes to budding growth in which the droplet is not released but bursts to nucleate a new expanding bulge at the site of the breach, namely, the budding regime (Fig. 1, q–x). It is important to specify that jetting, popping and budding regimes have been typically studied for flow rates of the range 2-15 mL h–1 grown in 1 M sodium silicate.
In this paper, we examine the composition of reaction precipitation tubes produced from our flow-injection system using various experimental methodologies including SEM /TEM and Raman spectroscopy. The results presented provide information on the chemical composition and morphology of the tube walls. They aim to complement earlier studies of the system’s different dynamics and radii selection mechanisms.
Experimental
Synthesis
Solutions of cupric sulfate ([CuSO4·5H2O] ≤ 0.55 M, Fisher) are prepared and then injected into a vessel containing a large volume of sodium silicate solution ([Na2SiO3·5H2O] = 1.0 M, Fisher). The injection is carried out in an upward direction through a glass capillary (length = 4.9 cm, inner diameter ≈ 0.8 mm) using a syringe pump (KD Scientific 200). In this study, the pump rate is kept constant at 7 mL h–1. A cylindrical glass vessel (height ≈ 25 cm; inner diameter = 2.2 cm) serves as the container for the silicate solution. All solutions are prepared in nanopure water (18 MΩ cm; EASYpure® UV, Barnstead). Optical micrographs are acquired with a monochrome charged-coupled device camera (CCD; COHU 2122) connected to a PC via a frame grabber board (Data Translation DT3155, 640 × 480 pixels at 8 bit pixel–1). Image sequences are captured using HLImage++97 software at a typical rate of 1 frame s–1. All experiments are carried out at 25 ± 1 °C.Microscopy
Tubular precipitates are synthesized for [CuSO4] = 0.25 M and [Na2SiO3] = 1.0 M. The tubes are collected in a Petri dish filled with nanopure water. The tubes and tube fragments are then rinsed three times. Excess water is removed and the samples are dried at 45 °C overnight. Higher temperatures can induce unwanted reactions of the material. The specimens are placed in a vacuum desiccator to remove remaining moisture. In the following, they are either carbon coated or gold sputtered prior to elemental analysis/micrograph acquisition. The latter analyses employ a JEOL JSM-5900 scanning electron microscope (SEM ) with an energy-dispersive X-ray (EDS ) attachment operating at 200 kV. For high resolution transmission electron microscopy (HRTEM ), the dry specimens are deposited on a copper grid with a holey carbon film and are then transferred to a JEOL 2010 electron microscope operating at 200 kV.Vibrational spectroscopy
Raman spectra are recorded for 785 nm laser excitation using a micro Raman system which couples an optical microscope to a Jobin Yvon Horiba LabRam high-resolution spectrometer with a CCD detector. The laser spot size is approximately 500 µm. The power at the sample is about 80 mW and the spectral width of the spectrometer is 7.4 cm–1.Measurements of infrared spectra are carried out with a Thermo-Nicolet Avatar 360 Fourier transform infrared spectrometer (FT-IR) and employ KBr pellets. The compounds used as standards are: Cu(OH)2, CuO, and Na2SiO3·5H2O. The first two are purchased from Aldrich Chemical Company and the third from Fisher.
Elemental analysis
Elemental quantifications are collected with an Oxford Instruments ED2000 high resolution energy dispersive X-ray fluorescence analyzer (EDXRF ). No elemental standards are used.Results and discussion
We begin our characterization of the tube material with the description of a set of qualitative experiments and observations. The in situprecipitation tubes as well as the dried precipitation tubes are light blue in color. No marked color differences are observed between tubes formed under the three growth regimes described in the Introduction. Typical tubes synthesized under popping conditions are shown in Fig. 2a. Upon heating the samples to about 140 °C, the material changes color from blue to black while the tube shape is essentially unchanged (see Fig. 2b). Further heating of the material up to 1000 °C yields a red solid, but the tube shape was destroyed in all runs. Furthermore, we carried out thermogravimetric and differential thermogravimetric analyses of the powdered tube material obtained under budding conditions. The corresponding TGA and DTGA plots are deposited in the ESI.† These measurements reveal a significant mass loss around 800 °C in addition to a more continuous mass loss that is likely to stem from the desorption of water. The latter results suggest that the blue color of the original tube material is caused by the presence of Cu(OH)2 which has characteristics that are in agreement with our observations. Specifically, this blue compound is known to decompose to black CuO at about 150 °C and then to red Cu2O at 820 °C under loss of water and oxygen, respectively.40![Two photographs illustrating a striking color change of the precipitation tubes in response to heating. (a) Blue, room temperature samples prior to heating; (b) black product tubes obtained at about 140 °C. The scale bar is 2 mm. Experimental parameters employed during tube growth: [CuSO4] = 0.25 M, [Na2SiO3] = 1 M and Q = 7 ml h–1.](/image/article/2007/CP/b612982j/b612982j-f2.gif) | ||
| Fig. 2 Two photographs illustrating a striking color change of the precipitation tubes in response to heating. (a) Blue, room temperature samples prior to heating; (b) black product tubes obtained at about 140 °C. The scale bar is 2 mm. Experimental parameters employed during tube growth: [CuSO4] = 0.25 M, [Na2SiO3] = 1 M and Q = 7 ml h–1. | ||
To further validate this hypothesis, we perform qualitative experiments in which dried tubes are immersed into small volumes of 15.0 M NH4OH. Under these conditions, Cu(OH)2 is readily soluble as the metal ion forms a tetraamine complex. Fig. 3a shows a typical example of a tube at the onset of its exposure to the ammonia solution. Note the faint jet of blueish liquid flowing out of the lower end of the tube. As expected, the resulting sample color is a less intense, translucent blue (see Fig. 3b), which is in agreement with the suspected presence of Cu(OH)2 in the original tube material. Note that under the given conditions, we did not succeed in dissolving the entire tube material which indicates the presence of one or more additional compounds. Perhaps more surprisingly, the ammonia treatment conserves the overall tube shape, although the resulting structures are more fragile than the initial samples. The fragility of ammonia-treated tubular structures is also apparent in images obtained by scanning electron microscopy (SEM ). Fig. 3c shows a representative micrograph of an ammonia-treated specimen. The structure has an average diameter of about 0.6 mm and its wall is extremely thin with a width of only a few micrometers. Moreover, SEM measurements at higher magnification, such as Fig. 3d, reveal a characteristic honeycomb-like, spongy patterning of the tube wall.
 | ||
| Fig. 3 (a) Optical micrograph of a precipitation tube submerged into 15.0 M ammonium hydroxide solution. (b) Optical micrograph of the same tube after 44 min. Field of view: 5 × 11 mm2. (c,d) SEM micrographs of an ammonia-treated tube revealing a honeycomb-like wall structure. Samples are synthesized under the conditions specified in Fig. 2. | ||
Additional information regarding the chemical nature of the tube material can be obtained spectroscopically. Fig. 4 shows the Raman spectra of the blue tube material, dried at room temperature as well as the heat-treated, black precipitation tubes. Note that the material is collected from tubes formed in the popping regime according to the procedures described in the context of Fig. 2. These measurements are complemented by reference spectra of commerical Cu(OH)2 and CuO. All four Raman spectra are obtained from samples in powder form.
 | ||
| Fig. 4 Raman spectra of (a) powder of popping tube dried at room temperature, (b) copper(II) hydroxide standard, (c) powder of popping tube heated to 140 °C and (d) copper(II) oxide standard. | ||
In Fig. 4, trace (a) is the Raman spectrum of the blue tube material. It has a large peak at a wavenumber of 488 cm–1. The same feature is found in the spectrum of the Cu(OH)2 reference (trace (b)), but the latter signal also has a peak at 292 cm–1. Nonetheless, a comparison of spectra (a) and (b) is in good agreement with the presence of large amounts of Cu(OH)2 in the tube sample.
The black tube material yields the Raman spectrum (c) which has a pronounced intensity signal around 598 cm–1 and a smaller peak at about 300 cm–1. The latter signal is indicative for CuO as illustrated by the reference spectrum (trace (d)). The CuO standard has one large peak located at a wavenumber of 295 cm–1. A smaller peak is found at 346 cm–1 and a broader one around 598 cm–1. These values are in agreement with published Raman spectra of CuO that report peaks at 250, 300, 347 and 635 cm–1.41 We note that the minor deviations between spectra (a) and (b) as well as (c) and (d) may be attributed to size effects and the complex physical properties of the tubular specimens.42
Fig. 5 presents infrared (IR) spectra of blue popping tubes (trace (a)), a Cu(OH)2 standard (b), a sodium silicate standard (c), black, heat-treated popping tubes (d), and a CuO standard (e). These IR spectra provide useful information regarding the non-copper phase that we indirectly found in the ammonia dissolution experiments (cf., Fig. 3). The IR spectrum of our sodium silicate reference (trace (c)) shows absorption bands between 800 and 1200 cm–1. This absorption is caused by Si–O–Si network vibrations that for amorphous silica are typically observed at 820 and 1100 cm–1. Note that neither Cu(OH)2 nor CuO (traces (b) and (e)) show absorption bands in this frequency range. However, the IR spectra of the tubular precipitates (see (a) and (d)) indicate strong absorption around a wavenumber of 1000 cm–1. This result indicates that precipitation tubes contain a measurable amount of silica. This finding is also supported by similarities in spectra (a), (c) and (d) around 3600 cm–1 that are caused by stretching vibrations of hydroxyl groups in the silica phase.43,44
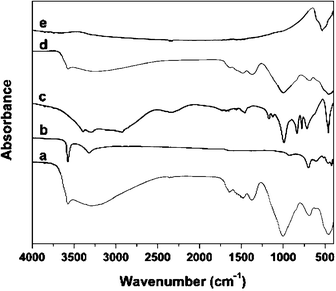 | ||
| Fig. 5 Solid state FT-IR spectra of (a) powder of precipitation tube dried at room temperature, (b) copper(II) hydroxide standard, (c) sodium silicate standard, (d) powder of precipitation tube heated to 140 °C and (e) copper(II) oxide standard. | ||
The qualitative and spectroscopic results presented so far suggest that the tube walls have a radial composition gradient with the outer layers rich in silica and the inner layers rich in metal hydroxide. To test this hypothesis, we carry out SEM -EDS and micro-Raman measurements. More specifically, we aim to differentiate compositional features between the exterior and interior surfaces of the copper–silicaprecipitation tubes. The inset of Fig. 6a shows an SEM micrograph of the exterior surface of a popping tube. This frame is complemented by an EDS spectrum obtained from the small rectangular area marked by the white box in the inset. The elemental analysis provides a weight percent ratio of mCu/mSi = 1.58 or 57% Cu : 36% Si, thus indicating that the exterior of the tube is rich in silica. Furthermore, the SEM -EDS of the interior surface of the same tube (Fig. 6b) yield a ratio of mCu/mSi = 12.0 or 91% Cu : 7% Si. This value indicates that the interior surface is rich in copper but nearly free of silicon. Both findings confirm our initial hypothesis of a compositional gradient across the tube wall.
 | ||
| Fig. 6 EDS spectra of the outside (a) and inside surface (b) of a popping tube. SEM micrographs of the corresponding surfaces are shown in the insets with white boxes indicating the regions of analysis. Synthesis parameters are specified in Fig. 2. | ||
Fig. 7 summarizes our micro-Raman results for tubular precipitates synthesized under popping conditions. Starting from the bottom, the five spectra are obtained from a copper hydroxide standard (a), the interior surface of a tubular structure formed under popping conditions (b), a sodium silicate standard (c), and the exterior surface of a tubular structure (d). Overall, the results are qualitatively similar to the Raman data shown in Fig. 4. However, the characteristic Cu(OH)2 signal around 490 cm–1 (trace (a)) can only be discerned in the spectrum of the interior surface (b), while it is essentially absent or not resolved for the tube exterior (d). The sodium silicate standard (c) shows a typical broad band signal below 500 cm–1 indicating a rocking-type motion of the bridging oxygen atoms and stretching motions in the Si–O–Si backbone.45–48 This feature is present in the spectra of both the inside and outside surfaces, but it is more pronounced for the exterior tube material. Accordingly, these micro-Raman data provide additional support for our hypothesis of a silica-rich exterior and Cu(OH)2 dominated interior surface.
 | ||
| Fig. 7 Micro-Raman spectra of (a) copper(II) hydroxide standard, (b) the interior surface of a dried precipitation tube, (c) sodium silicate standard and (d) the outside surface of the same tube as in (b). | ||
The spectroscopic results presented so far do not capture the rich and surprising patterning of the tube wall. Some of these surface structures can be discerned by optical microscopy of the undried tubes, but more detailed features are revealed by SEM . The latter technique yields micrographs that are well represented by the images shown in Fig. 8. Micrograph (a) is a low magnification overview of a tube synthesized under popping conditions. The right side of the tube is partially broken, thus revealing a view onto the darker inside surface. The interior and exterior tube surfaces have significantly different textures. On the outside we find closely stacked bands of ripples that are spaced at approximately 15 µm. They are not simply horizontal circles but typically show cusp-like deformations. We emphasize that the spacing of these bands is significantly smaller than the average tube growth during one popping event. For example, the latter value is approximately 300 µm for the experiment in Fig. 8 and, hence, 20 times larger than the average band spacing. Furthermore, the band structure is usually absent or unresolved on the tube inside where the surface texture is rather grainy and nodule-like.
 | ||
| Fig. 8 SEM micrographs of a precipitation tube. (a) Low magnification view showing the striped, outer surface and a small part of the inner surface in the lower, right corner. (b) High magnification image of the tube wall with the exterior surface on the right and the interior on the left. (c) Micrograph of the interior surface showing micro-nodules of densely packed nano-rods. | ||
Fig. 8b shows an interesting view of the tube wall. The wall spans the frame in a vertical direction. The left and right sides of the wall correspond to the interior and exterior surface, respectively. The wall thickness is about 10 µm. One can clearly distinguish a glassy-looking, bright phase on the right (i.e., the exterior layers) from a coarser, darker one on the left (the interior). Based on our spectroscopic findings, it seems reasonable to identify the inner and outer phase as predominantly copper(II) hydroxide and amorphous silica, respectively.
Also note that the interior surface in Fig. 8b is extremely rough with attached nodules that are several micrometers in height. The latter side view of these nodules is complemented by a top view of the interior surface at the same magnification (Fig. 8c). This representative micrograph illustrates that the nodules are about 10 µm in height and their shape tends to be half-spherical. They can be covered by a thin skin-like layer or be exposed revealing an interior that is loosely filled with nano-rod structures. Higher magnification micrographs of the nodules unfortunately fail to reveal additional details.
The structure of the nodules shown in Fig. 8 raises the question whether certain regions of the tubes are crystalline. Powder X-ray diffraction data (not shown) indicate that the material is largely amorphous but contains trace amounts of crystalline material. We also attempted to measure electron diffraction patterns of our samples and inspected the material using HRTEM.
Fig. 9a shows a small tube fragment (approximate width 50 nm). The inset is the corresponding selected area electron diffraction (SAED) pattern. The pattern indicates the presence of a crystalline phase with a d-spacing of 2.45 Å and a cubic crystal structure. Note that we cannot assign this pattern reliably to a specific compound. Additional evidence for the presence of small crystalloids is provided by HRTEM . A typical example is shown in Fig. 9b where lattice fringes can be easily discerned. The wavelength of the fringes in Fig. 9b is about 2.5 nm.
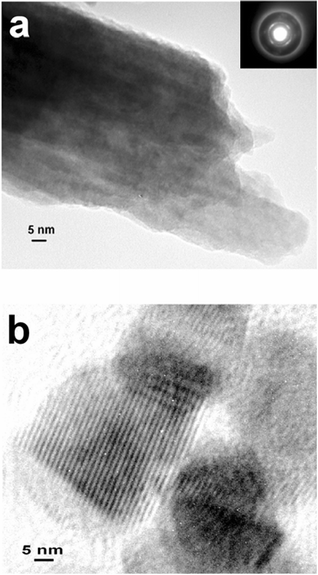 | ||
| Fig. 9 (a,b) HRTEM images of tube fragments. The inset in (a) is the corresponding SAED pattern. The micrograph in (b) reveals a pronounced fringe pattern with a spacing of 2.5 nm. | ||
All of the examples presented so far involve reactant concentrations and flow rates that give rise to oscillatory, popping growth. Preliminary data, however, indicate that the main compositional features of the tubes, i.e. amorphous silica and copper hydroxide constituting the exterior and interior wall, are independent of the growth conditions. To obtain more qualitative insights, we carried out X-ray fluorescence measurements of tube material synthesized for different concentrations of copper sulfate. Fig. 10 shows the mass ratio of copper to silicon (mCu/mSi) as a function of the “seed” concentration [CuSO4]. The concentration of sodium silicate and the rate of copper sulfate injection are kept constant at 1.0 mol L–1 and 7.0 mL h–1, respectively. Each measurement is carried out using 0.7–1.0 g of powdered tube material. This mass corresponds to several meters of tubular precipitate . Consequently, it requires numerous experimental runs to harvest sufficient amounts of material, especially for the rather flimsy and narrow structures formed under jetting conditions.
 | ||
| Fig. 10 Copper-to-silicon mass ratio of the tube material as a function of seed concentration. Each data point is an average of several X-ray fluorescence measurements. The concentration range of the injected CuSO4 solution spans the three growth regimes. | ||
The data in Fig. 10 reveal that the mCu/mSi ratio decreases significantly with increasing seed concentration. Although the concentration range spans all three growth regimes, we find no evidence for pronounced discontinuities but rather a nearly linear dependence. Linear regression of the data yields mCu/mSi = –(18 L mol–1) [CuSO4] + 16 (solid line in Fig. 10). It is surprising that the copper content of the tube material decreases with increasing concentration of the copper sulfate solution. This counterintuitive finding might be attributed to the pH of the seed solution that decreases with increasing concentration to about 3.75 at [CuSO4] = 0.5 mol L–1. This increase in acidity is likely to cause faster precipitation of silica and also delay the formation of copper hydroxide. However, additional experiments are needed to support this explanation.
Conclusions
This study characterizes the composition and morphological features of tubular precipitates synthesized by flow injection of cupric sulfate solution into waterglass. Our results reveal that the 10 µm thick tube walls are a complex composite material. Its exterior consists mainly of amorphous silica while its interior is made of copper hydroxide. Moreover, SEM data show that wall is more complex than a simple two-layer structure. In particular, we find that the outside surface has a texture with stripes of unknown origin. Furthermore, we observe micrometer-size nodules consisting of intricate nano-rod structures.The dominant component of the wall material is copper hydroxide which can be chemically modified without loss of the overall tube geometry. Specifically, we have shown that it can be reacted to form copper(II) oxide. It will be interesting to explore what other derivatives can be obtained without compromising the integrity of the macroscopic structure. Furthermore, there is a need for studies that extend our results toward other metals. Such systematic investigations will help us to evaluate the potential of our flow-controlled precipitation method for technical applications and the possible production of speciality materials.
Specific applications can be envisioned in the context of microfluidic-like devices. We stress that, in an earlier study, we have demonstrated the synthesis of highly linear tubes via gas bubble guidance and templating. The latter study suggests that one can create intricate geometries such as helical structures if the trajectory of the bubble is externally controlled. Such tube structures are of particular interest since, in comparison to conventional lithography,49 their walls can be made from a greater variety of materials. For such applications, however, it will be important to increase the tube strength either by enhancing the exterior silica layer or by embedding the entire structure into a rigid three-dimensional matrix. Note that we have carried out successful preliminary experiments in which our precipitation tubes are mechanically stabilized by embedding them into the elastomer polydimethylsiloxane.
Lastly, we re-emphasize that tubular precipitation structures are not only of potential value for technical applications but also of fundamental interest. In this context, many questions remain unanswered regarding the growth dynamics as well as the morphological features of the tube wall material.
Acknowledgements
This work was supported by the American Chemical Society Petroleum Research Fund (grant no. 42798-AC10). Raman spectra were recorded at FSU’s Chemistry and Biochemistry Department Laser Laboratory. Scanning electron microscopy was carried out at FSU’s Center for Materials Research and Technology (MARTECH) and FSU’s Biological Science Imaging Resource facility (BSIR). Transmission electron micrographs were measured at the National High Magnetic Field Laboratory (NHMFL). We thank John Ekman, Kim Riddle, Bert van de Burgt and Yan Xin for technical assistance.References
- J. B. Corliss, J. Dymond, L. I. Gordon, J. M. Edmond, R. P. Von Herzen, R. D. Ballard, K. Green, D. Williams, A. Bainbridge, K. Crane and T. H. van Andel, Science, 1979, 293, 1073.
- W. B. White, in Cave Minerals and Spelotherms. The Science of Speology, ed. T. D. Ford and C. H. D. Cullingford, Academic Press, London, 1976, p. 267 Search PubMed.
- M. B. Short, J. C. Baygents and R. E. Goldstein, Phys. Fluids, 2005, 17, 083101 Search PubMed.
- M. B. Short, J. C. Baygents, J. W. Beck, D. A. Stone, R. S. Toomey and R. E. Goldstein, Phys. Rev. Lett., 2005, 94, 018501 CrossRef.
- A. Ackermann, Kolloid–Z, 1921, 28, 270 CrossRef CAS.
- A. Ackermann, Kolloid–Z, 1932, 59, 49 CrossRef CAS.
- M. G. Fontana, Corrosion Engineering, McGraw-Hill, New York, 1986 Search PubMed.
- D. Coatman, N. L. Thomas and D. D. Double, J. Mater. Sci., 1980, 15, 2017 CAS.
- D. A. Stone and R. E. Goldstein, Proc. Natl. Acad. Sci. U. S. A., 2004, 101, 11537 CrossRef CAS.
- D. D. Double, A. Hellawell and S. J. Perry, Proc. R. Soc. London, Ser. A, 1978, 359, 435 CrossRef CAS.
- T. S. Sørensen, J. Colloid Interface Sci., 1981, 79, 192 CrossRef.
- D. D. Double, Philos. Trans. R. Soc. London, A, 1983, 310, 55.
- S. Mann, Biomineralization: Principles and Concepts in Bioinorganic Materials Chemistry, Oxford University Press, Oxford, 2001 Search PubMed.
- J. M. Garciá-Ruiz, S. T. Hyde, A. M. Carnerup, A. G. Christy, M. J. Van Kranendonk and N. J. Welham, Science, 2003, 302, 1194 CrossRef CAS.
- J. Maselko and P. Strizhak, J. Phys. Chem. B, 2004, 108, 4937 CrossRef CAS.
- L. S. Dent Glasser, Chem. Britain, 1982, 18, 33 Search PubMed.
- D. E. H. Jones and U. Walter, J. Colloid Interface Sci., 1998, 203, 286 CrossRef CAS.
- C. Collins, W. Zhou and J. Klinowski, Chem. Phys. Lett., 1999, 306, 145 CrossRef.
- D. E. H. Jones, Am. Sci., 2002, 90, 454 Search PubMed.
- D. Balköse, F. Özkan, U. Köktürk, S. Ulutan, S. Ülkü and G. Nişli, J. Sol-Gel Sci. Technol., 2002, 23, 253 CrossRef CAS.
- J. Maselko, A. Geldenhuys, J. Miller and D. Atwood, Chem. Phys. Lett., 2003, 373, 563 CrossRef CAS.
- D. A. Stone, B. Lewellyn, J. C. Baygents and R. E. Goldstein, Langmuir, 2005, 21, 10916 CrossRef CAS.
- E. Bormashenko, Y. Bormashenko, O. Stanevsky and R. Pogreb, Chem. Phys. Lett., 2006, 417, 341 CrossRef CAS.
- E. Bormashenko, Y. Bormashenko, O. Stanevsky, R. Pogreb, G. Whyman, T. Stein and Z. Barkay, Colloids Surf., A, 2006, 289, 245 CrossRef CAS.
- J. R. Glauber, Furni Novi Philiosophici, Amsterdam, 1646 Search PubMed.
- J. Keir, Philos. Trans. R. Soc. London, 1790, 80, 359 CrossRef.
- S. Leduc, The Mechanism of Life, Rebman, London, 1911 Search PubMed.
- V. R. Damerell and H. Brock, J. Chem. Educ., 1949, 26, 148 CrossRef CAS.
- B. Stockwell and A. Williams, School Sci. Rev., 1994, 76, 7 Search PubMed.
- H. W. Roesky and K. Möckel, Chemical Curiosities, VCH, Weinheim, 1996 Search PubMed.
- M. Webster, Educ. Chem., 1998, 35, 126 Search PubMed.
- C. Collins, W. Zhou, A. L. Mackay and J. Klinowski, Chem. Phys. Lett., 1998, 286, 88 CrossRef CAS.
- C. Collins, G. Mann, E. Hoppe, T. Duggal, T. L. Barr and J. Klinowski, Phys. Chem. Chem. Phys., 1999, 1, 3685 RSC.
- C. Collins, R. Makoya and J. Klinowski, Phys. Chem. Chem. Phys., 1999, 1, 4669 RSC.
- J. H. E. Cartwright, J. M. Garciá-Ruiz, M. L. Novella and F. Otálora, J. Colloid Interface Sci., 2002, 256, 351 CrossRef CAS.
- T. H. Hazelhurst, J. Chem. Educ., 1941, 18, 286 Search PubMed.
- S. Thouvenel-Romans and O. Steinbock, J. Am. Chem. Soc., 2003, 125, 4338 CrossRef CAS.
- S. Thouvenel-Romans, W. van Saarloos and O. Steinbock, Europhys. Lett., 2004, 67, 42 CAS.
- S. Thouvenel-Romans, J. J. Pagano and O. Steinbock, Phys. Chem. Chem. Phys., 2005, 7, 2610 RSC.
- Y. Cudennec and A. Lecerf, Solid State Sci., 2003, 5, 1471 CrossRef CAS.
- J. C. Hamilton, J. C. Farmer and R. J. Anderson, J. Electrochem. Soc., 1986, 133, 739 CAS.
- J. F. Xu, W. Ji, Z. X. Shen, W. S. Li, S. H. Tang, X. R. Ye, D. Z. Jia and X. Q. Xin, J. Raman Spectrosc., 1999, 30, 413 CrossRef CAS.
- B. Smith, Infrared Spectral Interpretation: A Systematic Approach, CRC, Boca Raton, FL, 1999 Search PubMed.
- L. Shen, W. Zhong, H. Wang, Q. Du and Y. Yang, J. Appl. Polym. Sci., 2004, 93, 2289 CrossRef CAS.
- J. Björnström, A. Martinelli, J. R. T. Johnson, A. Matic and I. Panas, Chem. Phys. Lett., 2003, 380, 165 CrossRef.
- P. McMillan, Am. Mineral., 1984, 69, 622 CAS.
- S. A. Brawer and W. B. White, J. Chem. Phys., 1975, 63, 2421 CrossRef CAS.
- T. Furukawa, K. E. Fox and W. B. White, J. Chem. Phys., 1981, 75, 3226 CrossRef CAS.
- J. C. McDonald and G. M. Whitesides, Acc. Chem. Res., 2002, 35, 491 CrossRef CAS.
Footnote |
| † Electronic supplementary information (ESI) available: TGA and DTGA data. See DOI: 10.1039/b612982j |
| This journal is © the Owner Societies 2007 |