Rapid ambient mass spectrometric profiling of intact, untreated bacteria using desorption electrospray ionization†
Yishu
Song
a,
Nari
Talaty
a,
W. Andy
Tao
b,
Zhengzheng
Pan
a and
R. Graham
Cooks
*a
aDepartment of Chemistry, 560 Oval Drive, Purdue University, West Lafayette, IN 47906, USA. E-mail: cooks@purdue.edu; Fax: (+1 765) 494-9421; Tel: (+1 765) 494-5263
bDepartment of Biochemistry, 175 South University Street, Purdue University, West Lafayette, IN 47906, USA
First published on 27th November 2006
Abstract
Desorption electrospray ionization (DESI) allows the rapid acquisition of highly reproducible mass spectra from intact microorganisms under ambient conditions; application of principal component analysis to the data allows sub-species differentiation.
Rapid identification of intact microorganisms is a significant analytical challenge with implications in a wide range of disciplines/practices. Important problems of interest include the rapid detection of bio-warfare agents1,2 and the identification of sources of infection.3 A major difficulty associated with this task is that most microorganisms cannot be identified without significant sample preparation, often involving tedious and lengthy steps. The ideal of real-time detection and identification has until recently seemed distant.
Mass spectrometric identification of microorganisms already displays inherent sensitivity, specificity and speed in the analysis step, features which have long made it attractive. Different ionization methods have been used to produce mass spectra rich in information, allowing differentiation of microorganisms either by selective monitoring for specific biomarkers or by fingerprint pattern recognition . In the past, pyrolysis has been applied for the identification of whole cell bacteria4,5 and has proven especially useful for differentiation between gram positive and negative bacteria. Typically, lyophilized bacteria are introduced into an electron impact (EI) ionization source via a heated probe (300–350 °C). Ionization of the pyrolysis products generates mass spectra which show low molecular weight fatty acids and phospholipids as major contributors. While primarily used for the analysis of cell lysates, electrospray ionization (ESI) mass spectrometry has also been applied to the direct characterization of whole cell bacteria. In these experiments, suspensions of whole cell bacteria are pneumatically sprayed while applying a high voltage to the spray tip.6–8 Although both higher mass biomacromolecules and small intracellular metabolites are observed, ESI of whole cell bacterial suspensions is better suited to profiling the lower mass compounds. At present, matrix-assisted laser desorption ionization (MALDI) is the most widely utilized ionization/sampling technique for whole cell microorganism characterization.9–14 In a typical MALDI bacterial analysis experiment, bacterial cells are deposited together with matrix solution onto a loading plate (sometimes a small amount of acid is co-deposited to facilitate cell lysis during sample preparation). Low molecular weight materials such as phospholipids can be detected in such experiments and MALDI is particularly valuable for the identification of peptides.
All the above mass spectrometric methods involve more or less extensive sample preparation and none of them allows direct characterization of fresh microorganisms under ambient conditions. The recent advent of the ambient ionization technique known as desorption electrospray ionization (DESI)15–17 makes possible the direct analysis of microorganisms in the ambient environment. A preliminary indication of the applicability of DESI to microbiological samples15 is shown by a mass spectrum recorded for freshly harvested E. coli.
DESI involves spraying untreated samples with ionized solvent droplets from a pneumatically-assisted electrospray. Desorption and ionization of the analytes occur through interactions with the charged droplets or, under some operating conditions, with impacting gas-phase ions generated by the primary electrospray. This technique allows direct and rapid analysis of condensed phase samples without any sample preparation or the need to introduce the sample into the vacuum system of the mass spectrometer . DESI has been employed for the analysis of a wide range of compounds, from small organics to biopolymers in a wide range of materials including pharmaceutical tablets, environmental surfaces, plant materials, animal tissue, etc.15–23
Three strains of Escherichia coli (E. coli DH10B, JM109 and XL1-Blue) and two strains of Salmonella typhimurium (S. typhimurium TL212 and LT1) were examined as 1 µL suspensions of freshly harvested cells evenly deposited onto a glass slide over an area about 0.5 cm2. Analysis using a Thermo Finnigan LTQ mass spectrometer (San Jose, CA) equipped with a desorption electrospray ion source (prototype OmniSpray Ion Source, Prosolia Inc., Indianapolis, IN) occurred after a brief period (1–2 minutes at room temperature) following evaporation of the water used to suspend the cells. No further treatment of the samples was used. Positive ion DESI-MS analysis of the bacteria was performed by directing electrosprayed solvent CH3OH : H2O (1 ∶ 1 v/v, 3 µL min–1, 5 kV) at an incident angle of about 55° onto the glass slide. (Please refer to supplementary materials for the experimental details.)
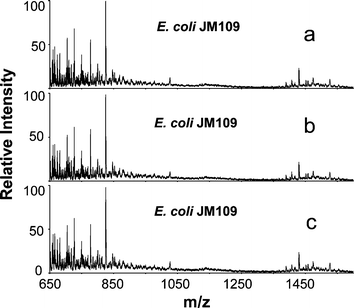
The ability to generate reproducible spectra is vital for pattern recognition based mass spectrometric profiling of microorganisms. Fig. 1 displays a set of DESI mass spectra recorded for different cultures of a single E. coli strain, JM109, using identical analysis conditions. Fig. 1a and 1b show the spectra recorded from two samples of the same culture analyzed at times differing by 5 minutes. Fig. 1c was recorded for another culture grown and analyzed on another day. The similarity of these three spectra indicates that DESI mass spectra of microorganisms are highly reproducible. Because mass spectra were recorded directly from freshly harvested microorganisms and no chemical reagent or other processing step was used to disrupt the cells before MS analysis, variations in the final spectra associated with sample pretreatment are eliminated.
 | ||
| Fig. 1 DESI mass spectra of E. coli JM109 obtained from different samples a) and b) of the same culture, c) another culture. | ||
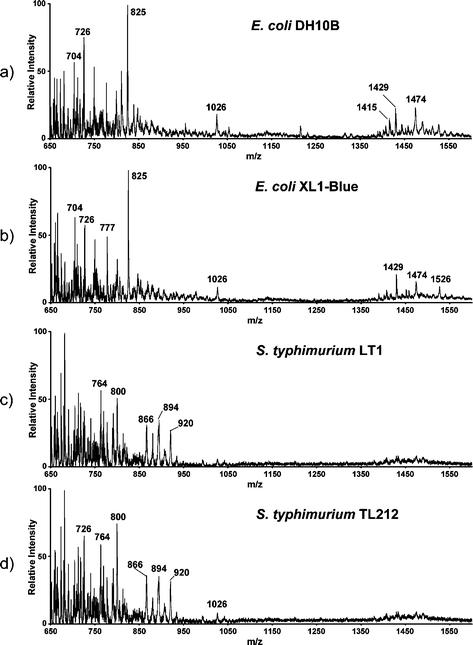
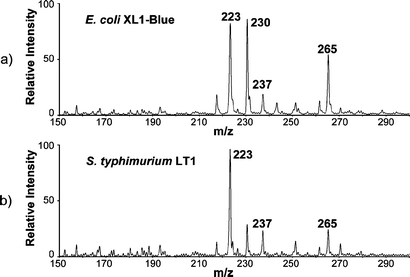
Fig. 2 displays typical DESI mass spectra of E. coli and S. typhimurium strains grown, harvested and analyzed under identical conditions. Previous ESI and fast atom bombardment spectra of E. coli lipids showed that the dominant species is protonated phosphatidylethanolamine (PE(33∶1)) at m/z 704.7,24 In the DESI spectra of E. coli, both protonated and sodium cation adducts of PE(33∶1) are observed (at m/z 704 and 726, respectively). Dimers of phospholipids are observed in the range m/z 1400–1600 and verified by tandem mass spectrometry (MS/MS). Fig. 3a displays the fragmentation pattern of [2PE(33∶1) + H]+ (m/z 1407), which mainly loses a PE neutral producing [PE + H]+ at m/z 704. This product ion further loses neutral phosphoethanolamine (141 mass units) to yield the fragment ion at m/z 563.25 The sodium cation dimer [2PE(33∶1) + Na]+ dissociates by eliminating neutral PE(33∶1), producing [PE(33∶1) + Na]+ at m/z 726 (Fig. 3b). For S. typhimurium, the prononated and sodium cation adducts of PE(33∶1) are also observed at m/z 704 and 726, and they dissociate identically to those observed from E. coli. Unlike the case for E. coli, dimers of phospholipids are observed in S. typhimurium with much reduced intensities. Another characteristic of the DESI mass spectra of S. typhimurium is a set of peaks at m/z 866, 894, 920, which are observed with relatively high intensity. These two features allow discrimination between S. typhimurium and E. coli by visual comparison of the corresponding mass spectra. Various other cellular components give rise to signals in the spectra recorded by DESI and they contribute to the complex mass spectral profile, especially in the lower mass range. Fig. 4 displays the low mass portions of typical DESI mass spectra of E. coli and S. typhimurium strains. Two major species common to the spectra, m/z 265 and 237, are ascribed as the acylium (RCO+) ions from octadecenoic acid (C18∶1) and hexadecenoic acid (C16∶1), respectively. Conventional characterization of the fatty acid composition of E. coli shows that octadecenoic acid and hexadecenoic acid account for 35% and 23% of total fatty acids.26 The RCO+ ions, also observed in pyrolysis experiments,4 are estimated to arise from 0.1–0.2 ng of the fatty acid precursors in this complex sample.
 | ||
| Fig. 2 Typical DESI mass spectra of a) E. coli DH10B, b) E. coli XL1-Blue, c) S. typhimurium LT1 and d) S. typhimurium TL212. | ||
![MS/MS product ion spectra of a) [2PE(33∶1) + H]+ and b) [2PE(33∶1) + Na]+.](/image/article/2007/CC/b615724f/b615724f-f3.gif) | ||
| Fig. 3 MS/MS product ion spectra of a) [2PE(33∶1) + H]+ and b) [2PE(33∶1) + Na]+. | ||
 | ||
| Fig. 4 Typical low mass range DESI mass spectra of a) E. coli XL1-Blue and b) S. typhimurium LT1. | ||
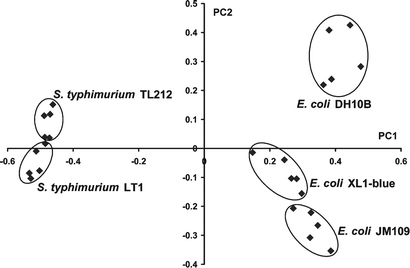
Owing to their high concentration in all living cells and the variety of possible combinations of different acyl arms and head groups, lipids can be highly species specific. Reported studies have employed the use of lipid fingerprints for the taxonomic classification of bacteria.24–27 In the present study, principal component analysis (PCA)7,27–29 was performed on the DESI mass spectral data to differentiate the bacteria studied. As an unsupervised statistical method, PCA does not require categorical information on the samples. Each mass spectrum was exported as a set of raw intensities and normalized before being used to construct the data matrix for PCA. The analysis results are presented as a score plot of the first principal component (PC1) against the second. Fig. 5 displays the score plot of the PCA on a set of mass spectra obtained from these five strains of gram negative bacteria cultivated using identical protocols and analyzed on the same day. In this plot, two well separated groups can be identified along the first principal component (PC1), which corresponds to the differentiation between E. coli and S. typhimurium. In each group, clusters corresponding to sub-species discrimination of individual strains are also distinguishable. There is a much larger separation between E. coli and S. typhimurium species than between different strains of the same species. The small separation between E. coli JM109 and XL1-Blue compared to that separating both from E. coli DH10B is rationalized by the fact that these two strains have the same genotype .
 | ||
| Fig. 5 PCA score plot of five strains of bacteria cultivated and analyzed under identical conditions. | ||
In conclusion, DESI can be used to generate characteristic, reproducible mass spectra directly from whole cell bacteria. The characteristic constituents of bacteria were observed without chemical derivatization. In particular, acylium ions of fatty acids were observed directly, not as the usual methyl esters.30 This study demonstrates the possibility of performing in situ identification, including sub-species differentiation, of microbiological agents by using DESI-MS. The lack of sample treatment and the known sensitivity of the DESI experiment represent progress toward rapid in situ mass spectrometric identification of biological threats.31
This work was supported by NSWC/DTRA grant W912HZ-04-2-0001 and NSF grant CHE-0412782.
Notes and references
- T. Krishnamurthy and P. L. Ross, Rapid Commun. Mass Spectrom., 1996, 10, 1992 CrossRef CAS.
- S. Farrell, H. B. Halsall and W. R. Heineman, Anal. Chem., 2005, 77, 549 CrossRef CAS.
- B. Elsholz, R. Worl, L. Blohm, J. Albers, H. Feucht, T. Grunwald, B. Jurgen, T. Schweder and R. Hintsche, Anal. Chem., 2006, 78, 4794 CrossRef CAS.
- J. P. Anhalt and C. Fenselau, Anal. Chem., 1975, 47, 219 CrossRef CAS.
- S. DeLuca, E. W. Sarver, P. B. Harrington and K. J. Voorhees, Anal. Chem., 1990, 62, 1465 CrossRef CAS.
- F. Basile, I. Ferrer, E. T. Furlong and K. J. Voorhees, Anal. Chem., 2002, 75, 1628.
- P. B. W. Smith, A. P. Snyder and C. S. Harden, Anal. Chem., 1995, 67, 1824 CrossRef CAS.
- S. Vaidyanathan, J. J. Rowland, D. B. Kell and R. Goodacre, Anal. Chem., 2001, 73, 4134 CrossRef CAS.
- M. A. Meetani and K. J. Voorhees, J. Am. Soc. Mass Spectrom., 2005, 16, 1422 CrossRef CAS.
- R. J. Arnold and J. P. Reilly, Rapid Commun. Mass Spectrom., 1998, 12, 630 CrossRef CAS.
- J. Bundy and C. Fenselau, Anal. Chem., 1999, 71, 1460 CrossRef CAS.
- A. J. Madonna, K. J. Voorhees, N. I. Taranenko, V. V. Laiko and V. M. Doroshenko, Anal. Chem., 2003, 75, 1628 CrossRef CAS.
- B. M. L. van Baar, FEMS Microbiol. Rev., 2000, 24, 193 CrossRef CAS.
- C. Fenselau and P. A. Demirev, Mass Spectrom. Rev., 2001, 20, 157 CrossRef CAS.
- Z. Takats, J. Wiseman, B. Gologan and R. G. Cooks, Science, 2004, 306, 471 CrossRef CAS.
- Z. Takats, J. Wiseman and R. G. Cooks, J. Mass Spectrom., 2005, 40, 1261 CrossRef CAS.
- R. G. Cooks, Z. Ouyang, Z. Takats and J. Wiseman, Science, 2006, 311, 1566 CrossRef CAS.
- N. Talaty, Z. Takats and R. G. Cooks, Analyst, 2005, 12, 1624 RSC.
- A. T. Jackson, J. P. Williams and J. H. Scrivens, Rapid Commun. Mass Spectrom., 2006, 20, 2717 CrossRef CAS.
- G. J. Van Berkel and V. Kertesz, Anal. Chem., 2006, 78, 4938 CrossRef CAS.
- J. Wiseman, D. R. Ifa, Q. Song and R. G. Cooks, Angew. Chem., Int. Ed., 2006, 45, 1 CrossRef.
- J. P. Williams, R. Lock, V. J. Patel and J. H. Scrivens, Anal. Chem., 2006, 78, 7440 CrossRef CAS.
- I. Cotte-Rodriguez and R. G. Cooks, Chem. Commun., 2006, 2968 RSC.
- D. N. Heller, R. J. Cotter, C. Fenselau and O. M. Uy, Anal. Chem., 1987, 59, 2806 CrossRef CAS.
- M. J. Cole and C. G. Enke, Anal. Chem., 1991, 63, 1032 CrossRef CAS.
- A. G. Marr and J. L. Ingraham, J. Bacteriol., 1962, 84, 1260 CAS.
- P. B. Harrington, T. E. Street, K. J. Voorhees, F. R. Brozoo and R. W. Odom, Anal. Chem., 1989, 61, 715 CrossRef CAS.
- P. B. Harrington and K. J. Voorhees, Anal. Chem., 1990, 62, 729 CrossRef CAS.
- J. C. Lindon, E. Holmes and J. K. Nicholson, Pharm. Res., 2006, 23, 1075 CrossRef CAS.
- A. Fox, J. Clin. Microbiol., 2006, 14, 2677 CrossRef.
- D. R. Walt and D. R. Franz, Anal. Chem., 2000, 72, 738A CAS.
Footnote |
| † Electronic supplementary information (ESI) available: Additional information regarding bacteria preparation, mass spectrometric analysis and PCA. See DOI: 10.1039/b615724f |
| This journal is © The Royal Society of Chemistry 2007 |
