Sensitive detection of protein by an aptamer-based label-free fluorescing molecular switch†
Bingling
Li
ab,
Hui
Wei
ab and
Shaojun
Dong
*a
aState Key Laboratory of Electroanalytical Chemistry, Changchun Institute of Applied Chemistry, Chinese Academy of Sciences, Changchun, Jilin, 130022, P. R. China. E-mail: dongsj@ciac.jl.cn; Fax: +86 431-5689711; Tel: +86 431-5262101
bGraduate School of the Chinese Academy of Sciences, Beijing, 100039, P. R. China
First published on 22nd November 2006
Abstract
We report an aptamer-based method for the sensitive detection of proteins by a label-free fluorescing molecular switch (ethidium bromide), which shows promising potential in making protein assay simple and economical.
Aptamers are DNA or RNA sequences selected in vitro for their ability to recognise specific molecular targets ranging from small inorganic or organic substances to proteins or cells.1,2 Since screening through the systematic evolution of ligands by exponential enrichment (SELEX) process from random RNA or DNA libraries began, more and more aptamers have been selected and research surrounding them has been shown to be very promising in various fields such as pharmaceutics and diagnostics.3 Meanwhile, due to their generally impressive selectivity, affinity for the targets and their multifarious advantages over traditional recognition elements, aptamers have been widely used in analytical assays.4–13
For analytical assays, several detection systems for proteins have been developed, making use of optical transduction,4 electrochemistry,5,6,7a fluorescence,7b,8,9b,9c quartz crystal microbalance,10etc., among which the analysis based upon fluorescence has been widely developed and considered to take a very important role in future research because it is sensitive, simple, fast and need no steps to immobilize or separate the analyte-systems from the recognition molecule in most cases. For example, by modifying thrombin with an oligonucleotide sequence and using the fluorescence property of the protein, thrombin was detected based on the interaction between the protein and its aptamer.7b And through labelling the aptamer with a fluorophore and a quencher at the two termini, proteins such as thrombin,8 and B chain platelet-derived growth factor (PDGF)9b could be detected by measuring fluorescence quenching. Another kind of sensor, that functioned by switching structures from DNA–DNA duplex to DNA–target complex, has also been designed for the detection of ATP and thrombin.11c However, most of the aptamer-based fluorescence assays (or even other detection methods) included several potential disadvantages such as labelling or modifying steps that could not be avoided. Steps such as labelling or modifying led to complications and relatively high costs. What is more, the target binding sites and conformational changes of the aptamers after binding were not known precisely, so labelling or modifying methods or binding sites were not only difficult to design, but also could weaken the affinity between the target and aptamer. Though recently some work on protein detection without labelling has been developed,13 these methods needed to make use of aptamers with specific conformational changes after binding, which limited their applicability. Therefore, it was necessary to make further efforts to develop alternative label-free methods with wider applicability.
In this communication, we present an aptamer-based method for protein detection by a label-free fluorescing molecular switch (ethidium bromide, EB). Thrombin, a kind of serine protease that plays important role in thrombosis, haemostasis and has a clearly studied 15-mer ssDNA aptamer, was taken as a model molecule here.14,15 On one hand, this method possessed the advantages of traditional aptamer-based fluorescence assays. On the other hand, by using this method, not only could the relative complex labelling and modifying steps4–9 that are usually used be successfully avoided, the target protein could also be extended to those aptamers without specific conformational changes. Consequently, more widely applicable detection of protein was realized in a more simple, sensitive and economical way.
Here, we made use of EB as a fluorescing molecular switch, based on the fact that it is a conventional fluorescent dye and is easily available, which has been studied and used widely. The mechanism of the interaction between the dye and DNA has been clearly delineated. Following the neighbour exclusion principle where every second site along the helix is unoccupied, EB could readily intercalate between the base pairs of dsDNA.16,17 When it was free in aqueous solution EB showed a low fluorescence intensity attributed to the efficient quenching of the excited state by transferring an amino proton to the solvent (water) molecule. However, when EB was intercalated with dsDNA it was shielded to some extent and showed an obvious enhancement in fluorescence intensity up to nearly 11 times that in the free state.18,19 Nevertheless, similar properties were not evident at all when it was mixed with ssDNA20 or quadruplex DNA, especially with the 15-mer quadruplex,21 which was a more stable structure (than the unfolded conformation) formed when the anti-thrombin aptamer was bound to thrombin.14,15 Our design was based on this property. As shown in Fig. 1, the 15-mer anti-thrombin aptamer was hybridized with its complementary strand to form a double-strand DNA, after which EB was added to produce a relatively high signal of fluorescence. Then adding thrombin to the EB–dsDNA led to a detectable decrease in the fluorescence signal. Finally, using the method here, protein detection was realised by making use of a simple aptamer–complementary strand–EB system without labelling.
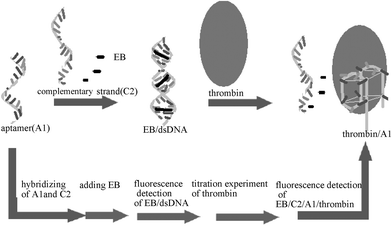 | ||
| Fig. 1 A schematic of method. Firstly, hybridizing the anti-thrombin aptamer and its complementary strand. Secondly, adding EB to the system. Finally, titration experiments of thrombin to form an EB–dsDNA–thrombin system. | ||
In our experiment, 0.466 µM dsDNA was prepared by 15-mer–anti-thrombin DNA aptamer (A1, 5′ GGT TGG TGT GGT TGG 3′)15 and its complementary strand (C2, 5′ CCA ACC ACA CCA ACC 3′) in 20 mM Tris-HCl buffer (140 mM NaCl, 5 mM KCl, 5 mM MgCl2, pH 7.4).14,15 Then, 40 µL EB solution (0.15 mM) was added to 4 mL dsDNA hybridized solution. After incubating at room temperature for 30 min the fluorescence intensity was measured. Subsequent titration experiments were carried out by adding aliquot amounts of 0.1 mg mL–1 thrombin (3 µL each time) to the dsDNA–EB solution to examine whether the fluorescence intensity decrease could quantitatively reflect the amounts of thrombin present.
The final result of the titration experiments is provided in Fig. 2. Obviously, in the absence of thrombin, the EB molecule intercalated to the DNA duplex with high efficiency and correspondingly high fluorescence intensity could be detected. While accompanied by the addition of increasing amounts of thrombin, the competition between the thrombin and the complementary strand (C2) for A16a could lead to the partial unwinding of the DNA double helix structure and more quadruplex–thrombin structure and ssDNA (C2). This, to some extent, released EB to the solvent (water) from being shielded by dsDNA and ultimately caused the fluorescence intensity decrease.
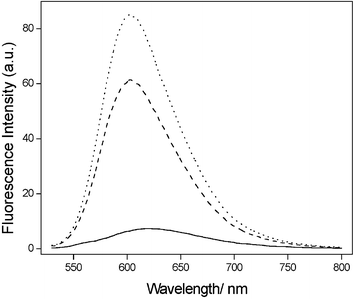 | ||
| Fig. 2 Fluorescence emission spectra (λex = 510 nm) of 0.15 µM EB (solid line); mixture of 0.15 µM EB—0.466 µM dsDNA (dotted line) and mixture of 0.15 µM EB–0.466 µM dsDNA–22.8 nM thrombin (dashed line). | ||
However, the signal did not change to a constant value as soon as the protein was added, but presented a gradual decrease over a period of time before it reached a stable state. The reason for the longer time needed to stabilise is explained in detail in the ESI.† For investigating the equilibrium time of the whole EB–C2–A1–thrombin system, we recorded the fluorescence change every 10 min after adding thrombin, and found that the intensity decreased gradually for about 30 min (Fig. 3), illustrating that 30 min was enough for the system to reach equilibrium. Therefore, we adopted each 30 min record as being a rational measurement of fluorescence intensity decrease led by the addition of thrombin. However, the fluorescence decrease would finally reach a limiting value when the C2–A1–thrombin system reached equilibrium.5 In spite of the 30 min incubation every time, as compared with labelling or modifying steps taken, the whole process of the experiment obviously saved time.
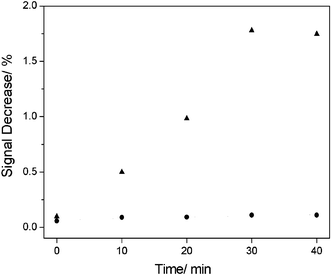 | ||
| Fig. 3 Time dependence of fluorescence response after 40 min incubation. EB–dsDNA–thrombin (solid triangles) and EB–dsDNA–BSA (solid dots). | ||
By using this method, we obtained a detection limit of 2.8 nM, which was as low as the most sensitive methods for thrombin detection until now.5–7 Then a nearly linear range from 0 to 22.8 nM of thrombin (Fig. 4) just covered the critical concentration between testing blood and the situation when the clotting cascade was activated.5
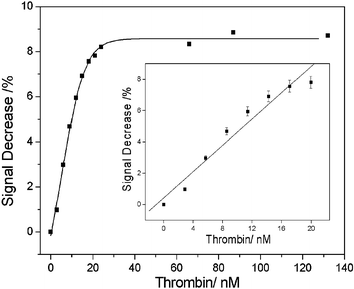 | ||
| Fig. 4 Titration of the EB–dsDNA with thrombin in the concentration range 0–120 nM. Inset: the linear relationship of the fluorescence change of EB–dsDNA–thrombin (λem = 600 nm). The concentrations of the EB and dsDNA were 0.15 µM and 0.466 µM, respectively. The error bars represent the standard deviation of two measurements. | ||
In fact, it is well known that sometimes when exposed to a continuous light source, organic fluorophores are not photo-stable, which could lead to false-positive or false–negative signals and could interfere with detection.9d To test whether the false-phenomenon affected the results here, a control experiment between thrombin and bovine serum albumin (BSA) was carried out (Fig. 3). Clearly, the fluorescence intensity did not change after adding BSA with time, indicating that the decrease of the fluorescence intensity mainly resulted from the presence of thrombin and the unwinding of dsDNA brought about by the formation of the aptamer–thrombin complex, because the addition of the BSA could not make the fluorescence change. Furthermore, the control experiment also proved this method could realize the purpose of specific recognition of protein (thrombin) here.
In conclusion, a sensitive, simple aptamer-based method for detection of protein by using a label-free fluorescing molecular switch was developed. As to thrombin, a sensitive detection limit of 2.8 nM was obtained. Generally, the present method showed advantages over other methods (containing some fluorescence ones). Firstly, by making use of the property of fluorescence dye EB and the recognition aptamer molecule, we successfully avoided the more common labelling, modifying or immobilizing processes,4–13 which usually led to relatively complex operation, high cost and weakened the affinity of the aptamer to the protein to some degree, thereby making the protein detection sensitive, simple and economical. Secondly, because the step to separate the analyte-systems from the recognition molecule usually needed was also left out, the experiment could be further simplified. Thirdly, in principle, if the targets had the ability to compete with the complementary strands of their aptemers, and the aptamers did not contain a secondary structure into which ethidium bromide intercalated, this method could be applicable. Finally, this method could be further improved through re-designing the A1–C2 system and replacing the fluorescing molecular switch EB by other more effective dyes or fluorescence nanoparticles. Therefore, this aptamer-based sensor provided more promising potential for the detection of both protein and other small targets using a molecular switch.
This work was supported by the National Natural Science Foundation of China (No. 20427003 and 20575064).
Notes and references
- A. D. Ellington and J. W. Szostak, Nature, 1990, 346, 818 CrossRef CAS.
- C. Tuerk and L. Gold, Science, 1990, 249, 505 CrossRef CAS; M. P. Robertson and G. F. Joyce, Nature, 1990, 344, 467 CrossRef CAS.
- S. E. Osborne and A. D. Ellington, Chem. Rev., 1997, 97, 349 CrossRef CAS.
- T. G. McCauley, N. Hamaguchi and M. Stanton, Anal. Biochem., 2003, 319, 244 CrossRef CAS.
- Y. Xiao, A. A. Lubin, A. J. Heeger and K. W. Plaxco, Angew. Chem., Int. Ed., 2005, 44, 5456 CrossRef CAS.
- Y. Xiao, B. D. Piorek, K. W. Plaxco and A. J. Heeger, J. Am. Chem. Soc., 2005, 121, 17990 CrossRef; B. R. Baker, R. Y. Lai, M. S. Wood, E. H. Doctor, A. J. Heeger and K. W. Plaxco, J. Am. Chem. Soc., 2006, 128, 3138 CrossRef CAS.
- R. Polsky, R. Gill, L. Kaganovsky and I. Willner, Anal. Chem., 2006, 78, 2268 CrossRef CAS; V. Pavlov, B. Shlyahovsky and I. Willner, J. Am. Chem. Soc., 2005, 127, 6522 CrossRef CAS.
- E. Baldrich and C. K. O'Sullivan, Anal. Biochem., 2005, 341, 194 CrossRef CAS.
- J. J. Li and W. H. Tan, Nano Lett., 2002, 2, 315 CrossRef CAS; X. H. Fang, A. Sen, M. Vicens and W. H. Tan, ChemBioChem, 2003, 4, 829 CrossRef CAS; C. J. Yang, S. Jockusch, M. Vicens, N. J. Turroand and W. H. Tan, Proc. Natl. Acad. Sci. U. S. A., 2005, 102, 17278 CrossRef CAS; L. Wang, K. M. Wang, S. Santra, X. J. Zhao, L. R. Hilliard, Z. E. Smith, Y. R. Wu and W. H. Tan, Anal. Chem., 2006, 3, 646 CrossRef; Z. H. Gao, S. W. Suljak and W. H. Tan, Curr. Proteomics, 2005, 2, 31 Search PubMed.
- M. Liss, B. Petersen, H. Wolf and E. Prohaska, Anal. Chem., 2002, 74, 4488 CrossRef CAS.
- M. N. Stojanovic and D. W. Landry, J. Am. Chem. Soc., 2002, 124, 9678 CrossRef CAS; R. Nutiu, J. M. Y. Yu and Y. F. Li, ChemBioChem, 2004, 5, 1139 CrossRef CAS; R. Nutiu and Y. F. Li, J. Am. Chem. Soc., 2003, 125, 4771 CrossRef; R. Nutiu and Y. F. Li, Angew. Chem., Int. Ed., 2005, 44, 1061 CrossRef CAS.
- H. Zhang, Z. Wang, X. F. Li and X. C. Le, Angew. Chem., Int. Ed., 2006, 45, 1576 CrossRef CAS; H. Fu, J. Guthrie and X. C. Le, Electrophoresis, 2006, 27, 433 CrossRef CAS.
- A. E. Wood and G. R. Bishop, Molecules, 2004, 9, 67 Search PubMed; Y. J. Jiang, X. H. Fang and C. L. Bai, Anal. Chem., 2004, 76, 5230 CrossRef CAS; J. Wang, Y. J. Jiang, C. S. Zhou and X. H. Fang, Anal. Chem., 2005, 77, 3542 CrossRef CAS; C. S. Zhou, Y. X. Jiang, S. Hou, B. C. Ma, X. H. Fang and M. L. Li, Anal. Bioanal. Chem., 2006, 384, 1175 CrossRef CAS.
- K. Padmanabhan, K. P. Padmanabhan, J. D. Ferrara, J. E. Sadler and A. J. Tulinsky, Biol. Chem., 1993, 268, 17651 CAS; I. Smirnov and R. H. Shafer, Biochemistry, 2000, 39, 1462 CrossRef CAS; B. I. Kankia and L. A. Marky, J. Am. Chem. Soc., 2001, 123, 10799 CrossRef CAS.
- L. C. Bock, L. C. Griffin, J. A. Latham, E. H. J. Vermass and J. Tool, Nature, 1992, 355, 564 CrossRef CAS.
- Q. Guo, M. Lu, L. A. Marky and N. R. Kallenbach, Biochemistry, 1992, 31, 2451 CrossRef CAS.
- T. Shida, N. Ikeda and J. Sekiguchi, Nucleosides Nucleotides, 1996, 15, 599 CAS.
- C. D. Byren and A. J. de Mello, Biophys. Chem., 1998, 70, 173 CrossRef.
- S. K. Pal, D. Mandal and K. Bhattacharyya, J. Phys. Chem. B, 1998, 102, 11017 CrossRef CAS.
- J. D. Shepherd, M. J. Fritzler, J. I. Watson and J. H. van de Sande, J. Rheumatol., 1978, 5, 391 Search PubMed.
- H. Arthanari, S. Basu, T. L. Kawano and P. H. Bolton, Nucleic Acids Res., 1998, 26, 3724 CrossRef CAS.
Footnote |
| † Electronic supplementary information (ESI) available: Details of the experimetal materials, instrumentation, thermal denaturation profiles, explanation of the reason for the relatively long equilibrium time. See DOI: 10.1039/b612080f |
| This journal is © The Royal Society of Chemistry 2007 |