Macroscopic samples of polystyrene with ordered three-dimensional nanochannels†
Huiming
Mao
and
Marc A.
Hillmyer
*
Department of Chemistry, University of Minnesota, Minneapolis, MN 55455-0431, USA. E-mail: hillmyer@chem.umn.edu
First published on 24th November 2005
Abstract
Block copolymers containing a chemically degradable block are versatile precursors to nanoporous organic materials. Most work in this area has been accomplished in thin films. However, high surface area catalysis, separations, and nanotemplating can require monolithic samples with macroscopic pore volumes. Only a few examples of monolithic nanoporous materials from ordered block copolymers have been reported. In nearly all of these cases, the materials contain parallel cylindrical pores templated from the commonly observed hexagonally packed cylindrical (C) morphology adopted by AB diblock copolymers. To significantly expand the potential utility of this class of materials, we have targeted the bicontinuous gyroid (G) morphology in polystyrene block copolymers containing a degradable component. In this communication we describe the preparation of macroscopic samples of polystyrene with ordered three-dimensional nanochannels using either a polystyrene–polylactide (PS–PLA) block copolymer or a polystyrene–poly(ethylene oxide) (PS–PEO) block copolymer that adopts the G morphology. In addition, we show that a blend of these two materials also adopts the G morphology and that selective removal of the polylactide phase leaves a nanoporous material with poly(ethylene oxide)-lined pore walls that render the material water wettable.
PS–PLA and PS–PEO were prepared using established anionic polymerization and endcapping techniques.1,2 The number average molecular weight (Mn) of PS–PLA as determined by 1H NMR spectroscopy is 21.1 kg mol−1 and the polydispersity index (PDI) of PS–PLA as determined by size exclusion chromatography (SEC) using PS standards is 1.09. PS–PLA contains 58.4% PS by volume (fPS = 0.584) using the densities of PS and PLA at 140 °C. PS–PEO has the following values: Mn = 30.5 kg mol−1, PDI = 1.04, and fPS = 0.635. As synthesized, PS–PLA and PS–PEO adopt lamellar (L) and C morphologies, respectively, by small-angle X-ray scattering (SAXS) analysis. Order–order transitions in both materials were observed by dynamic mechanical analysis (see Fig. S1 in the electronic supplementary information (ESI)†), as evinced by sharp increases in the dynamic elastic modulus upon heating. PS–PLA undergoes an L → G transition at 211 °C and PS–PEO goes through a C → G transition at 208 °C (2 °C min−1 heating rate) as confirmed below.3 While the L and C phases in diblock copolymers typically span a large range of compositions and molecular weights, the G phase is typically located in a small window of composition at weak degrees of segregation (i.e., at temperatures near the order–disorder transition).4 Importantly, the high modulus G morphology in both samples persists upon cooling of these samples through the glass transition temperature (Tg) of the PS (≈ 95–99 °C). In practice, the bicontinuous G phase in both these samples could be kinetically trapped by first heating the samples to 200 °C overnight and then quenching to RT.3
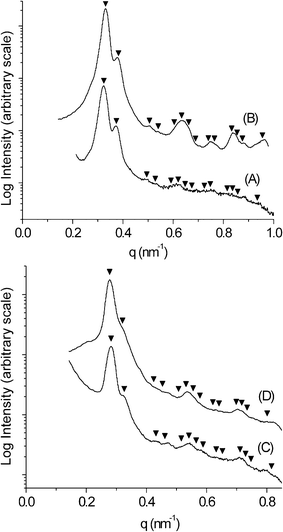
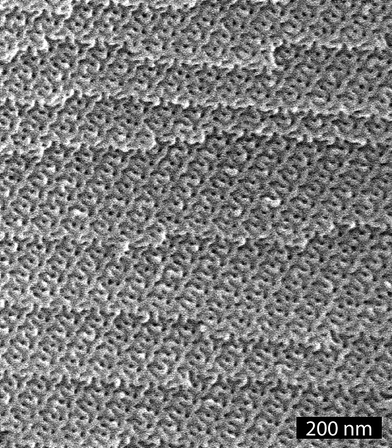
SAXS data for the PS–PLA and PS–PEO samples trapped in the G morphology at RT are shown in Figs. 1A and 1C, respectively. The characteristic first two reflections for these samples at a spacing ratio of √6/√8 are indicative of the Ia![[3 with combining macron]](https://www.rsc.org/images/entities/char_0033_0304.gif) d space group symmetry for the G morphology. A monolithic sample (≈ 2 × 2 × 10 mm3) of PS–PLA that adopted the G morphology was subjected to chemical etching using a concentrated aqueous solution of HI at 60 °C for 5 days, neutralized with an aqueous NaOH solution (1.0 M) for 4 h, and washed in a methanol–water mixture for one day. This protocol led to the complete etching of the PLA block as determined by 1H NMR spectroscopy (see Fig. S2 in the ESI†). Furthermore, SEC data on the degraded sample (d-PS–PLA) was virtually identical to the hydroxy terminated PS sample used to prepare the PS–PLA (see Fig. S3 in the ESI).1 SAXS data on this degraded sample (Fig. 1B) shows that the G morphology was retained upon removal of the PLA phase. The principal spacing (d211 = 19 nm) is essentially unchanged from the parent material, and the expected higher order reflections are more pronounced. Furthermore, the principal peak in the d-PS–PLA sample is 30 times more intense than in the precursor PS–PLA consistent with theoretical value based on the predicted increase in electron density contrast. A scanning electron microscopy (SEM) image of a fractured surface from this monolith confirms both the nanoporosity and ordered state symmetry of the material (Fig. 2). The fracture occurred along a 211 plane of the structure yielding the convoluted image shown in Fig. 2.
d space group symmetry for the G morphology. A monolithic sample (≈ 2 × 2 × 10 mm3) of PS–PLA that adopted the G morphology was subjected to chemical etching using a concentrated aqueous solution of HI at 60 °C for 5 days, neutralized with an aqueous NaOH solution (1.0 M) for 4 h, and washed in a methanol–water mixture for one day. This protocol led to the complete etching of the PLA block as determined by 1H NMR spectroscopy (see Fig. S2 in the ESI†). Furthermore, SEC data on the degraded sample (d-PS–PLA) was virtually identical to the hydroxy terminated PS sample used to prepare the PS–PLA (see Fig. S3 in the ESI).1 SAXS data on this degraded sample (Fig. 1B) shows that the G morphology was retained upon removal of the PLA phase. The principal spacing (d211 = 19 nm) is essentially unchanged from the parent material, and the expected higher order reflections are more pronounced. Furthermore, the principal peak in the d-PS–PLA sample is 30 times more intense than in the precursor PS–PLA consistent with theoretical value based on the predicted increase in electron density contrast. A scanning electron microscopy (SEM) image of a fractured surface from this monolith confirms both the nanoporosity and ordered state symmetry of the material (Fig. 2). The fracture occurred along a 211 plane of the structure yielding the convoluted image shown in Fig. 2.
 | ||
Fig. 1 RT SAXS data for (A) PS–PLA trapped in the G morphology (B) d-PS–PLA (C) PS–PEO trapped in the G morphology (D) d-PS–PEO. The triangles mark the expected reflections for the G morphology (Ia![[3 with combining macron]](https://www.rsc.org/images/entities/char_0033_0304.gif) d symmetry) based on the position of the principal peak (√6, √8, √14, √16, √20, √22, √24, √26, √30, √32, √38, √40, √42, √50). d symmetry) based on the position of the principal peak (√6, √8, √14, √16, √20, √22, √24, √26, √30, √32, √38, √40, √42, √50). | ||
 | ||
| Fig. 2 SEM image of d-PS–PLA. | ||
The dark features in Fig. 2 are voids templated by the PLA phase. An average pore diameter of 8.5 ± 1.1 nm was determined by measuring 985 of these features in representative SEM images of d-PS–PLA.5 Considering that the sample was coated with about 2 nm of Pt to prevent sample charging, an actual pore diameter of about 12.5 nm (i.e., 8.5 + (2 × 2) nm) was calculated. Nitrogen adsorption experiments (Brunauer–Emmett–Teller [BET] method) on a nanoporous d-PS–PLA sample gave a type IV isotherm with an H1 type hysteresis characteristic of a mesoporous material with a narrow pore size distribution (see Fig. S4 in the ESI†).6 A specific surface area of approximately 182 m2 g−1 was determined from this data, and Barrett–Joyner–Halenda (BJH) analysis gave an average pore diameter of 11.8 nm. Using both self-consistent mean field theory7 and a simple cylindrical channel model (see ESI for details) we expected a pore diameter in d-PS–PLA of 12–13 nm, consistent with both the BJH analysis and SEM image analysis. Degradation of PS–PLA trapped in the G morphology using a solution of NaOH as described in ref. 1 gave nearly identical nanoporous materials as the PS–PLA sample degraded with the HI solution.
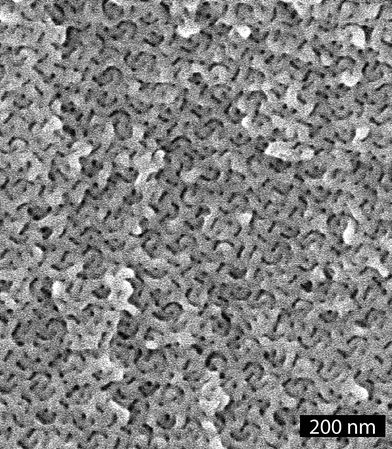
Since PS–PEO transformed from C to G upon heating we targeted large oriented domains of the G phase starting with an aligned C phase as previously demonstrated.8 Channel die alignment of PS–PEO at 150 °C gave an oriented sample of hexagonally packed PEO cylinders in a PS matrix (considering the volume fraction of polystyrene) as confirmed by one-dimensional SAXS analysis (see Fig. S5 in the ESI†) and the two-dimension SAXS pattern taken perpendicular to the flow direction (Fig. 3a). This monolithic sample was then heated to 200 °C under reduced pressure overnight and quenched to RT. The 10-spot pattern shown in Fig. 3b after this treatment suggests the formation of large oriented domains of the G morphology.9 The one-dimensional SAXS data for this sample is shown in Fig. 1C. This sample was also subjected to an aqueous solution of HI at 60 °C for 5 days, a technique we recently established for the selective removal of PEO from ordered polystyrene–poly(ethylene oxide) block copolymers.10 As in the PS–PLA case, both 1H NMR and SEC analysis of the degraded sample were consistent with complete removal of the PEO phase. The one-dimensional SAXS data for d-PS–PEO is shown in Fig. 1D, and the two-dimensional pattern in Fig. 3c shows that large oriented domains were preserved in the degraded sample. A SEM image of d-PS–PEO fracture surface demonstrates the nanoporous nature of the material (Fig. 4). Unlike the SEM image of the unaligned d-PS–PLA sample (Fig. 2), the channels in this material have been imaged both parallel and perpendicular to the nanochannels. From this image, the average width of the channels (by measuring the dark circular features5) was determined to be 9.7 ± 1.3 nm. Again, considering a Pt coating thickness of about 2 nm, this is in agreement with the predicted values (12–14 nm) and the BJH analysis (12.2 nm).11
 | ||
| Fig. 3 Two-dimensional SAXS data for (a) aligned PS–PEO in the C phase (b) PS–PEO with large oriented domains of the G phase after annealing at 200 °C (c) d-PS–PEO with large oriented domains of the G phase. | ||
 | ||
| Fig. 4 SEM image of d-PS–PEO. | ||
In a recent publication we demonstrated that the PLA phase in blends of polystyrene–polylactide and polystyrene–poly(ethylene oxide) that formed the C morphology could be selectively removed leaving nanoporous materials with PEO-lined channels.12 Using a similar strategy, we prepared a blend of PS–PLA containing 11 wt% of a second polystyrene–poly(ethylene oxide) material (Mn = 19.5 kg mol−1, PDI = 1.03, and fPS = 0.607). This miscible blend (see ref. 12), after annealing at 200 °C under reduced pressure overnight and quenching to RT, also formed the G morphology. Removal of >99% of the PLA phase using a NaOH solution at 50 °C for 5 days led to a nanoporous material that retained nearly all of the PEO present in the starting blend. As in the above cases, the SAXS and SEM data confirmed retention of the G morphology in the nanoporous material (see Figs. S6 and S7 in the ESI†). However, unlike the d-PS–PLA and d-PS–PEO samples this nanoporous sample was completely water wettable.12 Both d-PS–PLA and d-PS–PEO floated indefinitely on the surface of water, whereas the degraded blend filled with water and submerged after 71 h at RT.
Because of its unique bicontinuous structure, the gyroid phase in block copolymers has been exploited for potential applications involving charge transport,13 photonic materials,14 and membrane reactors.15,16 While the preparation of nanoporous materials from ordered block copolymers forming the G morphology has been demonstrated or suggested,14–17 only thin films and/or poorly efficient (or chemically harsh) methods have been used. In this communication we show that by marriage of block copolymer design, detailed phase behavior determination, and chemically mild degradation techniques, macroscopic samples of polystyrene with ordered three-dimensional nanochannels can be produced with controlled pore wall functionality. We anticipate that these materials will find use in selective transport, heterogeneous catalysis, and nanotemplating applications.18
References
- A. S. Zalusky, R. Olayo-Valles, J. H. Wolf and M. A. Hillmyer, J. Am. Chem. Soc., 2002, 124, 12761–12773 CrossRef CAS.
- T. S. Bailey, H. D. Pham and F. S. Bates, Macromolecules, 2001, 34, 6994–7008 CrossRef CAS.
- L. Sun, L. Zhu, Q. Ge, R. P. Quirk, C. Xue, S. Z. D. Cheng, B. S. Hsiao, C. A. Avila-Orta, I. Sics and M. E. Cantino, Polymer, 2004, 45, 2931–2939 CrossRef CAS.
- I. W. Hamley, The Physics of Block Copolymers, Oxford University Press, New York, 1998 Search PubMed.
- The average pore sizes from SEM images were measured using a digital image analysis software, Scion Image, version Beta 4.0.2, Scion Corporation, http://www.scioncorp.com.
- F. Rouquerol, J. Rouquerol and K. Sing, Adsorption by Powders and Porous Solids: Principles, Methodology and Applications, Academic Press, San Diego, 1999 Search PubMed.
- M. W. Matsen and F. S. Bates, J. Chem. Phys., 1997, 106, 2436–2448 CrossRef CAS.
- M. F. Schulz, F. S. Bates, K. Almdal and K. Mortensen, Phys. Rev. Lett., 1994, 73, 86–89 CrossRef CAS.
- M. E. Vigild, K. Almdal, K. Mortensen, I. W. Hamley, J. P. A. Fairclough and A. J. Ryan, Macromolecules, 1998, 31, 5702–5716 CrossRef CAS.
- H. Mao and M. A. Hillmyer, Macromolecules, 2005, 38, 4038–4039 CrossRef CAS.
- The BET analysis for this sample gave a specific surface area of 164 m2 g−1.
- H. Mao, P. L. Arrechea, T. S. Bailey, B. J. S. Johnson and M. A. Hillmyer, Faraday Discuss., 2005, 128, 149–162 RSC.
- B. -K. Cho, A. Jain, S. M. Gruner and U. Wiesner, Science, 2004, 305, 1598–1601 CrossRef CAS.
- A. M. Urbas, M. Maldovan, P. DeRege and E. L. Thomas, Adv. Mater., 2002, 14, 1850–1853 CrossRef CAS.
- T. Hashimoto, K. Tsutsumi and Y. Funaki, Langmuir, 1997, 13, 6869–6872 CrossRef CAS.
- S. Ndoni, M. E. Vigild and R. H. Berg, J. Am. Chem. Soc., 2003, 125, 13366–13367 CrossRef CAS.
- V. Z.-H. Chan, J. Hoffman, V. Y. Lee, H. Latrou, A. Avgeropoulos, N. Hadjichristidis, R. D. Miller and E. L. Thomas, Science, 1999, 286, 1716–1719 CrossRef CAS.
- This work was supported by the National Science Foundation (DMR-0094144), the David and Lucile Packard Foundation. We thank Professor M. W. Matsen for helpful discussions concerning the estimation of specific surface areas in the degraded samples using self-consistent field theory.
Footnote |
| † Electronic supplementary information (ESI) available: Supporting dynamic mechanical analysis, NMR spectra, SEC traces, N2 adsorption data, SAXS analysis, SEM images, and detailed pore size calculations. See DOI: 10.1039/b513958a |
| This journal is © The Royal Society of Chemistry 2006 |
