Observation of the desorption of mineral nanoparticles from a hybrid Langmuir monolayer: an in situ grazing incidence X-ray (GIXOS) study
L.
Wiegart
ab,
S. M.
O'Flaherty
a,
P.
Terech
b and
B.
Struth
*a
aEuropean Synchrotron Radiation Facility (ESRF), B.P. 220, 38043, Grenoble Cédex 09, France. E-mail: struth@esrf.fr
bUMR 5819 CEA-CNRS-Université J. Fourier, Département de Recherche Fondamentale sur a Matière Condensée, 17, rue des Martyrs, 38054, Grenoble Cédex 09, France
First published on 24th November 2005
Abstract
The kinetics and mechanism of the desorption of mineral clay particles originally adsorbed to a phospholipid monolayer has been studied. The desorption was induced by the injection of citric acid solution into the aqueous subphase. To follow the related kinetic processes, grazing incidence diffuse X-ray scattering out of the specular plane (GIXOS) was used with a remarkable time resolution of the order of one minute. From the variations of the electron density profile normal to the surface, the Langmuir desorption isotherm and the related kinetic constants were determined.
In situ investigation of the kinetics of adsorption and desorption processes at air–liquid interfaces is a difficult task due to the very limited amount of material involved (ions, molecules, nanoparticles). Even with X-ray scattering techniques using synchrotron sources, access to the kinetics of such processes is limited by the duration of the data acquisition. We report here the use of a variant of the grazing incidence X-ray (GIXD)1 technique taking advantage of the information contained within the diffuse contribution of the out-of-specular-plane scattering (GIXOS). A thin organic layer on the liquid surface oscillates in phase with the surface pertubations due to thermally excited capillary waves. Thus, the structural information perpendicular to the surface is, for small offset qxy values, equivalent to the one obtained by specular reflectivity experiments.2 While specular reflectivity experiments3 with X-rays on liquid surfaces require timeframes of up to hours, the main advantage of GIXOS in the context of kinetic studies is that the information describing the electron density profile of the layer normal to the surface can be obtained within minutes. GIXOS is then suitable to follow the temporal variation of atomic or molecular coverage at surfaces and interfaces via changes in the electron density profile of the layer. In the present study, the layered system is an organic–inorganic hybrid layer consisting of nanosized disc-like clay particles adsorbed to a Langmuir phospholipid monolayer. The formation of the mineral layer is driven by the electrostatic interaction between the negative surface charge of the minerals suspended in the aqueous subphase and the zwitterionic headgroups of the lipids.4 The desorption of the mineral discs was induced by addition of a small, negatively charged molecule, citric acid, with the potential to diffuse into the gap between the lipid head-groups and the adsorbed mineral surfaces. Triggering the adsorption and desorption of the mineral particles is important to control the dynamical, mechanical and permeability properties of the lipidic hybrid layer.2 An additional motivation for such studies is its applicability in the medical context, where for example effects such as arthritic diseases manifest themselves as crystallites in the vicinity of cellular membranes. Recently, it has been reported that the surface charge of crystals in interaction with cellular membranes can cause inflammations due to alterations of the membrane dynamics.5,6 Since citric acid is currently used as an active agent in the arthritic pattern,7 it is then reasonable to consider such a molecule for the present studies.
The lipid used was the phospholipid 1,2-dipalmitoyl-phosphatidyl-choline C40H80NO8P (DPPC) consisting of two hydrophobic C16 alkane chains, connected to the zwitterionic headgroup via a glycerol backbone. DPPC monolayers are suitable membrane model systems. The DPPC headgroup has a positively charged tip. Aqueous dispersions of mineral discs (25 nm diameter, 1 nm thickness) of laponite were used as the subphase. Citric acid trisodium salt HOC(CO2Na)(CH2CO2Na)2 (abbreviated as Na3Ci) was used as an aqueous buffered (pH = 7.60) solution. The samples were prepared in a round PTFE trough with 90 mm diameter and a subphase volume of 32 mL. A perforated PTFE tube connected to a syringe was fixed to the bottom of the trough. Another PTFE tube connected to a second syringe was used to suck out liquid from the subphase. The two syringes were moved simultaneously so as to keep the surface level and therefore the surface pressure constant. Measurements were performed under a helium atmosphere to minimise parasitic air scattering. Experiments were carried out at the ID10B beamline at the ESRF (Grenoble, France).8 The sample surface was irradiated with a monochromatic X-ray beam (λ = 1.484 Å, 100 × 50 μm in the horizontal and vertical planes respectively) under grazing incidence (αI = 0.098°). The diffusely scattered signal perpendicular to the surface was measured using a 150 mm position sensitive linear detector at an in-plane angle of 0.3° with respect to the direct beam. The resolution (0.1°) was defined by means of a double slit setup consisting of two 150 × 0.3 mm2 slits connected by a 620 mm long evacuated flight pass. The fitting of the experimental data was performed using a simplified model2 based on the Parratt algorithm.9
The DPPC monolayer was spread from a chloroform solution (0.2 mg mL−1) onto an aqueous dispersion of laponite (c = 0.2 wt%) at a surface pressure of 25 mN m−1. The hybrid layer that was formed is characterized by the first GIXOS curve (a) in Fig. 1 showing three fringes. The modelling uses a four-box model (see Fig. 2, inset). The first box is made up of the mineral discs, the second box is a water interlayer between the mineral platelets and the lipid headgroups, the third box is the headgroup layer, while the fourth box represents the lipid tails. Fit parameters are collimated in Table 1. After reaching equilibrium (∼1.5 h), 3 mL of the subphase was exchanged by a 0.35 M Na3Ci solution. The time delay from injection to collecting the first spectrum was fixed by the time to flush the sample environment with helium (∼40 min). Scattering profiles for times up to t = 255 min after injection can be fitted with the four-box model and we define this as kinetic regime I. In the intermediate range 341 min < t < 709 min, no fit was appropriate (regime II). At t > 861 min, a two-box model involving layers for the lipid headgroups and tails was used (regime III). In regime I, the electron density of the mineral layer (after 255 min) was reduced to about 20% of the initial state (a), assuming that the desorbed minerals were replaced by water while the total layer thickness was not affected. In regime III, a dramatic reduction of the total film thickness by about 25% (∼9.5 Å) was observed and can be interpreted as the complete desorption of the mineral sublayer (mineral thickness = 9.5 Å). In the range 861 min < t < 1317 min (regime III) the thickness of the headgroup layer is significantly increased in proportions consistent with a mechanism of Na3Ci adsorption to the lipid headgroups. It has been verified that the injection of Na3Ci was necessary to initiate the desorption process.
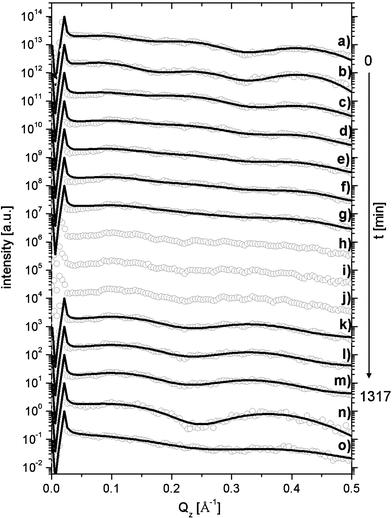 | ||
| Fig. 1 (a) GIXOS spectrum for DPPC on an aqueous solution of 0.2 wt% mineral concentration before the injection of citric acid; (b) to (m) time evolution of the system after the injection of citric acid into the subphase (see Table 1 for details); (n) GIXOS spectrum for DPPC on a pure water subphase; (o) GIXOS spectrum for DPPC on a 0.033 M subphase of citric acid; curves are shifted in intensity for clarity; solid lines are model fits using the parameters summarized in Table 1. Qz = 2π(sin(αi) + sin(αf))/λ denotes the perpendicular wavevector transfer as a function of the incident angle αi and the exit angle αf relative to the surface. | ||
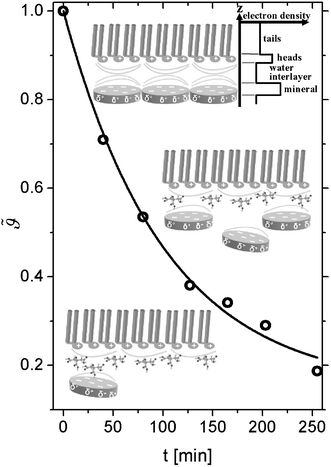 | ||
Fig. 2 Time evolution of the mineral layer coverage  with time (t = 0 corresponds to the equilibrium coverage before the injection of citric acid). The solid line is a fit according to eqn. (2). The insets sketch different stages of the system during the desorption process. In the upper inset, a schematic of the electron density profile corresponding to a four layer model is shown. Note that the sketches are not drawn to scale. with time (t = 0 corresponds to the equilibrium coverage before the injection of citric acid). The solid line is a fit according to eqn. (2). The insets sketch different stages of the system during the desorption process. In the upper inset, a schematic of the electron density profile corresponding to a four layer model is shown. Note that the sketches are not drawn to scale. | ||
 ,
,  ,
,  and
and  denote the corresponding electron densities normalized to the electron density of water. The interface roughnesses from the subphase to the atmosphere are denoted with σ1 to σ5
| Time/min |
|
|
|
|
d min/Å | d inter/Å | d head/Å | d tails/Å | σ 1/Å | σ 2/Å | σ 3/Å | σ 4/Å | σ 5/Å | |
|---|---|---|---|---|---|---|---|---|---|---|---|---|---|---|
| (a) | 0 | 1.16 | 1.00 | 1.19 | 1.10 | 10.1 | 2.5 | 8.0 | 15.5 | 3.6 | 3.2 | 1.6 | 2.6 | 2.8 |
| (b) | 40 | 1.11 | 1.00 | 1.14 | 1.10 | 10.1 | 3.4 | 8.0 | 15.1 | 4.6 | 2.1 | 1.6 | 2.9 | 2.8 |
| (c) | 80 | 1.08 | 1.00 | 1.10 | 1.13 | 10.1 | 3.4 | 8.0 | 15.1 | 4.6 | 2.1 | 1.6 | 2.9 | 2.7 |
| (d) | 127 | 1.06 | 1.00 | 1.12 | 1.13 | 10.1 | 3.4 | 8.0 | 15.1 | 3.6 | 3.3 | 3.6 | 3.3 | 2.7 |
| (e) | 165 | 1.05 | 1.00 | 1.14 | 1.11 | 10.1 | 3.2 | 8.0 | 15.1 | 3.6 | 3.3 | 3.9 | 3.5 | 2.7 |
| (f) | 203 | 1.04 | 1.00 | 1.15 | 1.10 | 10.1 | 3.2 | 8.0 | 15.1 | 3.2 | 3.3 | 4.4 | 3.7 | 2.7 |
| (g) | 255 | 1.03 | 1.00 | 1.15 | 1.10 | 10.1 | 3.2 | 8.0 | 15.1 | 3.2 | 3.3 | 4.4 | 3.7 | 1.2 |
| (k) | 861 | — | — | 1.17 | 1.10 | — | — | 11.6 | 15.3 | — | — | 3.5 | 3.4 | 2.3 |
| (l) | 1089 | — | — | 1.17 | 1.10 | — | — | 11.6 | 15.3 | — | — | 3.4 | 3.4 | 2.3 |
| (m) | 1317 | — | — | 1.18 | 1.10 | — | — | 11.5 | 15.4 | — | — | 3.3 | 3.4 | 2.3 |
| (n) | — | — | — | 1.23 | 0.99 | — | — | 7.7 | 15.8 | — | — | 3.3 | 3.3 | 2.9 |
| (o) | — | — | — | 1.04 | 0.86 | — | — | 9.2 | 13.1 | — | — | 3.4 | 4.0 | 2.7 |


The profile of the final curve (m) is intermediate between that for DPPC on pure water (curve (n)) and DPPC on a 0.033 M solution of Na3Ci without mineral particles (curve (o)). For curve (o), the thickness of the headgroup layer is only slightly increased, while the thickness of the lipid tails is decreased compared to the system without Na3Ci (curve (a)). These features suggest that Na3Ci migrates to interact and surround the headgroups of the lipid monolayer thus inducing an increase of the tilt angle and subsequent decrease of the layer thickness.
The normalized electron density  of the mineral layer as obtained by the fit of Fig. 1, curve (a) is assumed to represent the value
  for a maximum interface coverage under equilibrium conditions at time t = 0. The kinetic variation of the mineral coverage of the lipid interface can therefore be described by
  .
.
A common model to describe the adsorption-desorption kinetics of monolayers at an interface is the Langmuir model.10
 | (1) |
 normalized to the maximum equilibrium value, the bulk mass concentration c, the adsorption and desorption kinetic coefficients ka and kd respectively. The integration of eqn. (1) using the initial condition
  provides the following expression for desorption:
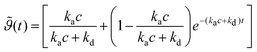 | (2) |
Fig. 2 depicts the mineral layer coverage  as a function of time as experimentally observed and the solid line is a fit with eqn. (2) where the kinetic constants ka and kd were free parameters. The parameters obtained from the fit were ka = 0.72 cm3 min−1 g−1 and kd = 0.00144 min−1. The limiting step in the desorption kinetics is not the Na3Ci diffusion to the hybrid layer but the disruption of the lipid–mineral interaction made possible by the greater affinity of Na3Ci with the mineral particles. Nevertheless, after the Na3Ci molecules penetrate the water interlayer, they force the mineral particles into the subphase against the backstriking potential of the transient mineral network in the bulk. Consequently, even after 250 min, the desorption process is incomplete and ∼20% of the initial mineral layer is still connected to the lipid headgroups. However, after ∼800 min, the mineral layer is completely desorbed as evidenced from the curve (k) to (m) (regime III) that can be well reproduced with a two-box model.
GIXOS experiments have been used to probe in situ the desorption process of mineral nanoparticles from a phospholipid Langmuir monolayer induced by the introduction of Na3Ci in the subphase. The analysis of the time evolution of the electron density profile along the normal to the interface provides, for the first time, a Langmuir isotherm of a desorption process by using X-ray scattering techniques. Na3Ci are small and highly charged molecules and are shown to penetrate the region between the headgroups of the phospholipid monolayer and the charged surfaces of the adsorbed mineral layer. They are responsible for an electrostatic screening of the phospholipid headgroups and they exert a repulsive interaction with the negatively charged surfaces of the minerals. The current measurements of the release of mineral particles under Na3Ci action would almost certainly be relevant in the context of crystal charge induced membranolysis aspects as mentioned in the introductory section.
Acknowledgements
The authors thank the ESRF for access to the X-ray beam. We are indebted to Prof. M. Tolan and Dr H. Mueller for support and helpful discussions.References
- J. Als-Nielsen and K. Kjaer, In Phase Transitions in Soft-Condensed Matter; ed. T. Riste and D. Sherrington, Plenum Press, New York, 1989 Search PubMed.
- L. Wiegart, B. Struth, M. Tolan and P. Terech, Langmuir, 2005, 21, 7349–7357 CrossRef CAS.
- L. Bosio, J. J. Benattar and F. Rieutord, Rev. Phys. Appl., 1987, 22, 775–778 Search PubMed.
- B. Struth, F. Rieutord, O. Konovalov, G. Brezesinski, G. Grübel and P. Terech, Phys. Rev. Lett., 2002, 88, 25502 CrossRef.
- A. Wierzbicki, P. Dalal, J. D. Madura and H. S. Cheung, J. Phys. Chem. B, 2003, 107, 12346–12351 CrossRef CAS.
- L. Wiegart, S. M. O'Flaherty and B. Struth, Langmuir, 2005, 21, 1695–1698 CrossRef CAS.
- D. VanLinthoudt, I. Salani, R. Zender, P. Locatelli, H. Ott and H. R. Schumacher, J. Rheumatol., 1996, 23, 502–505 Search PubMed.
- D. M. Smilgies, N. Boudet, B. Struth and O. Konovalov, J. Synchrotron Radiat., 2005, 12, 329–339 CrossRef CAS.
- L. G. Parratt, Phys. Rev., 1954, 95, 359–369 CrossRef.
- I. Langmuir, J. Am. Chem. Soc., 1916, 38, 2221–2295 CrossRef CAS.
| This journal is © The Royal Society of Chemistry 2006 |