DOI:
10.1039/C7RA01404J
(Paper)
RSC Adv., 2017,
7, 29170-29183
A metabolomics approach to profiling the cardioprotective effect of LCZ696, an angiotensin receptor-neprilysin inhibitor, on ischemia induced heart failure†
Received
3rd February 2017
, Accepted 15th May 2017
First published on 5th June 2017
Abstract
Heart failure is one of the most common chronic diseases in the world, particularly among the elderly, yet, no clinically approved metabolite biomarkers have been identified so far. To address this issue, we conducted a liquid-chromatography study with time-of-flight mass spectrometer (LC/Q-TOF-MS)-based metabolomics to investigate heart failure and to assess the efficacies and mechanisms of LCZ696, which is a novel angiotensin receptor neprilysin inhibitor in treating heart failure in mice induced by coronary artery ligation. Based on unsupervised principal component analysis, a clear separation was observed between the heart failure and sham-operated group, which revealed that heart failure disturbed the metabolism of endogenous substances and significantly altered the heart metabolite fingerprints. After LCZ696 treatment, the metabolomics profile found in heart failure was significantly reversed, shifting much closer to sham controls, confirming that LCZ696 had therapeutic effects in heart failure. Metabolomic pathway analysis revealed that several pathways including fatty acid metabolism, lipid metabolism, glucose metabolism, and amino acid metabolism were significantly altered in heart failure mice. Consequently, it was inferred that LCZ696 shows therapeutic efficacy in heart failure by restoring these disturbed metabolic pathways, especially the ones related to energy metabolism. To conclude, the present study provides a new methodological approach for understanding heart failure and LCZ696 mechanisms relevant for heart failure treatment.
1. Introduction
Heart failure (HF) is a leading cause of mortality in developed countries with a current prevalence of over 23 million worldwide.1 Besides an increasing prevalence of heart failure in industrialized and developing countries, there is also an increase in the hospitalization burden and healthcare costs related to this disease, as there are only few available treatment options.2,3 Consequently, heart failure is considered to be a worldwide epidemic.2 Circulating biomarkers, such as natriuretic peptides, may aid in diagnosis; however, heart failure is a heterogeneous syndrome, and consequently, there is no single non-invasive test that could predict with 100% accuracy the heart failure status in symptomatic patients.4 As a result, there is considerable interest in identifying novel biomarkers that could improve diagnosis, enhance prognostication, guide individual therapy, and enrich pathophysiological understanding of the heart failure syndrome.5 Increasing evidence suggests heart failure is associated with metabolic dysfunction.6 Insulin resistance, diabetes mellitus, and obesity are risk factors for heart failure development. In patients with heart failure, myocardial substrate utilization largely switches from using fatty acids to using glucose.7,8 As a result, metabolic profile provides a significant prognostic value. LCZ696 is a novel angiotensin receptor neprilysin inhibitor. The PARADIGM heart failure trial confirmed the superiority of LCZ696 over enalapril in treating patients with chronic heart failure.9 However, the molecular mechanisms underlying the beneficial effects of LCZ696 in heart failure treatment have still not been fully understood. Therefore, identifying circulating metabolite profiles that are characteristic of heart failure is an attractive approach to discover valuable biomarkers, especially following LCZ696 treatment. Metabolomics is the analysis of a whole array of metabolites in a biosystem under a given set of conditions.10 Metabolomics has been shown to have a substantial impact on the investigation of various cardiovascular diseases.11,12 And the number of studies on its application for heart failure assessment is growing.13–15
The goal of this study was to investigate the biochemical changes in heart failure, and therapeutic effects and mechanisms of LCZ696 by means of LC-MS-based metabolomics. Heart tissues were collected from the established sham-operated mice, model mice model and LCZ696-treated group subjected to metabolomics analysis. Multivariate statistical analysis was used to interpret metabolic changes, and to provide more insight into heart failure, as well as to characterize LCZ696 efficacy and mechanisms relevant for heart failure treatment.
2. Materials and methods
2.1. Chemicals and reagents
LC-MS grade acetonitrile and methanol were purchased from Honeywell Burdick and Jackson (Muskegon, MI, USA). Mass Spectroscopic grade formic acid was purchased from Fluka (Buchs, Switzerland). Ultra-pure water was obtained in a Milli-Q system from Millipore (Bedford, MA, USA). Reference standards were purchased from Sigma-Aldrich (St. Louis, MO, USA).
2.2. Animals and treatment
Adult male Balb/c mice (8 weeks old, weighing 20–22 g) were purchased from laboratory animal center of Fudan University (Shanghai, China). The mice were randomly divided into three main groups: sham-operated group (n = 13), model mice group (n = 12) and LCZ696-treated group (n = 10). Sham-operated mice were thoracotomy and without left anterior descending ligation. Ischemia heart failure mice group were subjected to myocardial infarction (MI) induced by left anterior descending ligation.16 LCZ696-treated group were injected once a day with LCZ696 (Selleck, USA, 60 mg kg−1 per day) dissolved in normal saline; the first injection was preformed 24 h post-MI surgery.17 The treatment lasts for 4 weeks.
The isolated tissue were analyzed using histological assay (n = 4) or by metabolomic profile. For metabolomic analysis, tissue was randomly divided into 2 samples and minced on ice to measure charged and lipid metabolites. The tissue samples were then weighed and snap frozen in liquid nitrogen and stored at −80 °C for further analysis.
All animal studies (including the mice euthanasia procedure) were done in compliance with the regulations and guidelines of Fudan University Institutional Animal Care. All experiments were approved by the Animal Research Committee Board of Fudan University Institutional Animal Care and conducted according to the Institutional Animal Care and Use Committee (IACUC) guidelines.
2.3. Echocardiography and histochemical staining
Transthoracic echocardiography was performed using VisualSonics Vevo770 (Toronto, ON, Canada) by end of the forth week post-treatment. Anesthesia was induced by putting the mouse in an induction chamber using 3% isoflurane and 1 L min−1 100% oxygen for 1–2 minutes. Once the animal lost its righting reflex, it was laid supine on a heated platform with its nose enveloped in a nosecone to keep the mouse anesthetized by 2% isoflurane. M-mode images were then recorded when the heart rate (HR) was 450–500 bpm. Left ventricular ejection fraction (LVEF), and left ventricular end-diastolic dimension (LVEDD) and left ventricular end-systolic dimension (LVESD) were measured as previously described.18 All measurements were averaged from five consecutive cardiac cycles and were carried out by three experienced technicians who were unaware of the identities of animal groups.18
Mice were then euthanized and the hearts were carefully dissected and fixed in 10% neutral-buffered formalin at room temperature for 24 h and then embedded in paraffin. Tissue were then cut in 5 μm sections and stained with hematoxylin and eosin (H&E) to analyze the heart morphology. The results were digitalized using an Olympus BX-51 light microscope (Olympus America Inc., Melville, NY, USA).
2.4. Measurement of NT-proBNP and high-sensitivity cardiac troponin T (hs-cTnT)
Blood samples were collected through the plexus\sinus, centrifuged at 2000 × g at 4 °C for 15 min to separate serum, and then stored at −80 °C for further analysis. Serum NT-proBNP and hs-cTnT levels were measured according to the manufacturer's instructions by enzyme-linked immunosorbent assay (ELISA) using a mouse NT-proBNP and hs-cTnT ELISA Kit (MyBioSource, CA, USA).
2.5. Sample processing
For LC/MS analysis, 50 mg of tissue sample was transferred to a 1.5 mL centrifuge tube. 0.5 ml a monophasic mixture of methanol–water (4![[thin space (1/6-em)]](https://www.rsc.org/images/entities/char_2009.gif) :1, v/v), with an internal standard 10 μL 2-chlorophenylalanine (4 μg mL−1), were added to each sample and the mixture was homogenate at 4 °C for 2 min. The samples were subsequently centrifuged at 13000 rpm for 10 min at 4 °C and 0.2 mL of the supernatant was collected separately from each sample into a test tube. Quality control (QC) samples, which were prepared by mixing equal amounts of tissue samples from each sample, were used to control intra- and inter-batch variability. All samples were obtained and stored at −80 °C until further analysis.
:1, v/v), with an internal standard 10 μL 2-chlorophenylalanine (4 μg mL−1), were added to each sample and the mixture was homogenate at 4 °C for 2 min. The samples were subsequently centrifuged at 13000 rpm for 10 min at 4 °C and 0.2 mL of the supernatant was collected separately from each sample into a test tube. Quality control (QC) samples, which were prepared by mixing equal amounts of tissue samples from each sample, were used to control intra- and inter-batch variability. All samples were obtained and stored at −80 °C until further analysis.
2.6. LC-Q-TOF/MS
All the samples were randomized prior to LC-TOFMS analysis to decrease experimental drifts. Tissue metabolite profiling was performed on an Agilent 1290 Infinity Liquid Chromatography System (Agilent Technologies, Santa Clara, CA, USA) equipped with Waters ACQUITY UPLC@HSS T3 column with 2.5 μm particle size (2.5 μm, 100 × 2.1 mm, Waters Corp., Milford, MA, USA). The column was maintained at 40 °C; the injected sample volume was 4 μL. Gradient conditions were 0–2 min 5% B, 2–13 min linear gradient from 5 to 95% B, and 13–15 min 95% B, post time, 5 min. Solvent A was 0.1% formic acid–water; solvent B was 0.1% formic acetonitrile. The flow rate was 400 μL min−1. MS experiments were performed on an Agilent 6538 UHD and Accurate-Mass Q-TOF (Agilent Technologies) equipped with electrospray ionization source. Data for each ionization technique were acquired in positive and negative ionization mode. The measurement conditions were as follows: capillary voltage, 4 kV in positive mode and 3.5 kV in negative mode; drying gas flow, 11 L min−1; gas temperature, 350 °C; nebulizer pressure, 45 psig; fragmentor voltage, 120 V; skimmer voltage, 60 V. The scan range used was m/z 50–1000.
2.7. LC-Q-TOF/MS data processing
Firstly, raw data was processed using the “Find by Molecular Feature” function, using MassHunter Qual version B.04.00 (Agilent) software, for peak detection and removal of isotopes and adducts. Generated MHD files were then imported into the software Mass Profiler Professional version B.12.05 (Agilent) for normalization, alignment, peak filtering and statistical analysis. The parameters used were the following: retention time range 0–15 min, mass range 50–1000 Da, mass tolerance 0.02 Da, RT tolerance was set at 0.01 min. Consequently, a list of the ion intensities, retention time and the m/z of each peak, was generated. Finally, all samples were normalized using the internal standard 2-chlorophenylalanine, and the ion peaks, generated by the internal standard, were removed. In order to obtain consistent differential variables, only peaks present in at least 80% of samples in at least one group were retained for further analysis.
2.8. Multivariate data analysis
Data were exported into SIMCA-P+ 13.0 software (Umetrics, Umeå, Sweden). Principle component analysis (PCA) and partial least squares-discriminant analysis (PLS-DA) were carried out to visualize the metabolic alterations between the groups after mean centering and unit variance scaling. In this study, the default 7-round cross-validation was applied to guard against over-fitting of PLS-DA model. The variable importance in the projection (VIP) values of all the peaks from the 7-fold cross-validated PLS-DA model was taken as a coefficient for peak selection. And those variables with VIP > 1.0 are considered relevant for group discrimination. Besides the multivariate analysis, one univariate method, an independent t-test (p < 0.05) was used to determine whether the candidate biomarkers obtained from PLS-DA modeling were statistically significant between groups at univariate analysis level. The structures of the potential biomarkers were elucidated with the high-resolution MS and MS/MS spectra and by searching various databases including KEGG (http://www.genome.jp) and HMDB (http://www.hmdb.ca). And the structures of biomarkers were validated by comparing with the reference standards in our lab. The heatmap of different metabolites was performed using a MetaboAnalyst platform (http://www.metaboanalyst.ca).
2.9. Molecular pathway and network analysis in IPA
Pathway analysis of different metabolites was performed by Ingenuity Pathways Analysis (IPA; http://www.ingenuity.com), a web-based software that identifies biological pathways and functions relevant to bio-molecules of interest. The metabolite (with KEGG IDs) and the fold change directions of these metabolites were uploaded onto an IPA server. And then the canonical pathways and molecular interaction networks were generated based on the knowledge sorted in the Ingenuity Pathway Knowledge Base.
3. Results
3.1. Histopathological changes in heart of sensitized animals challenged by LCZ696
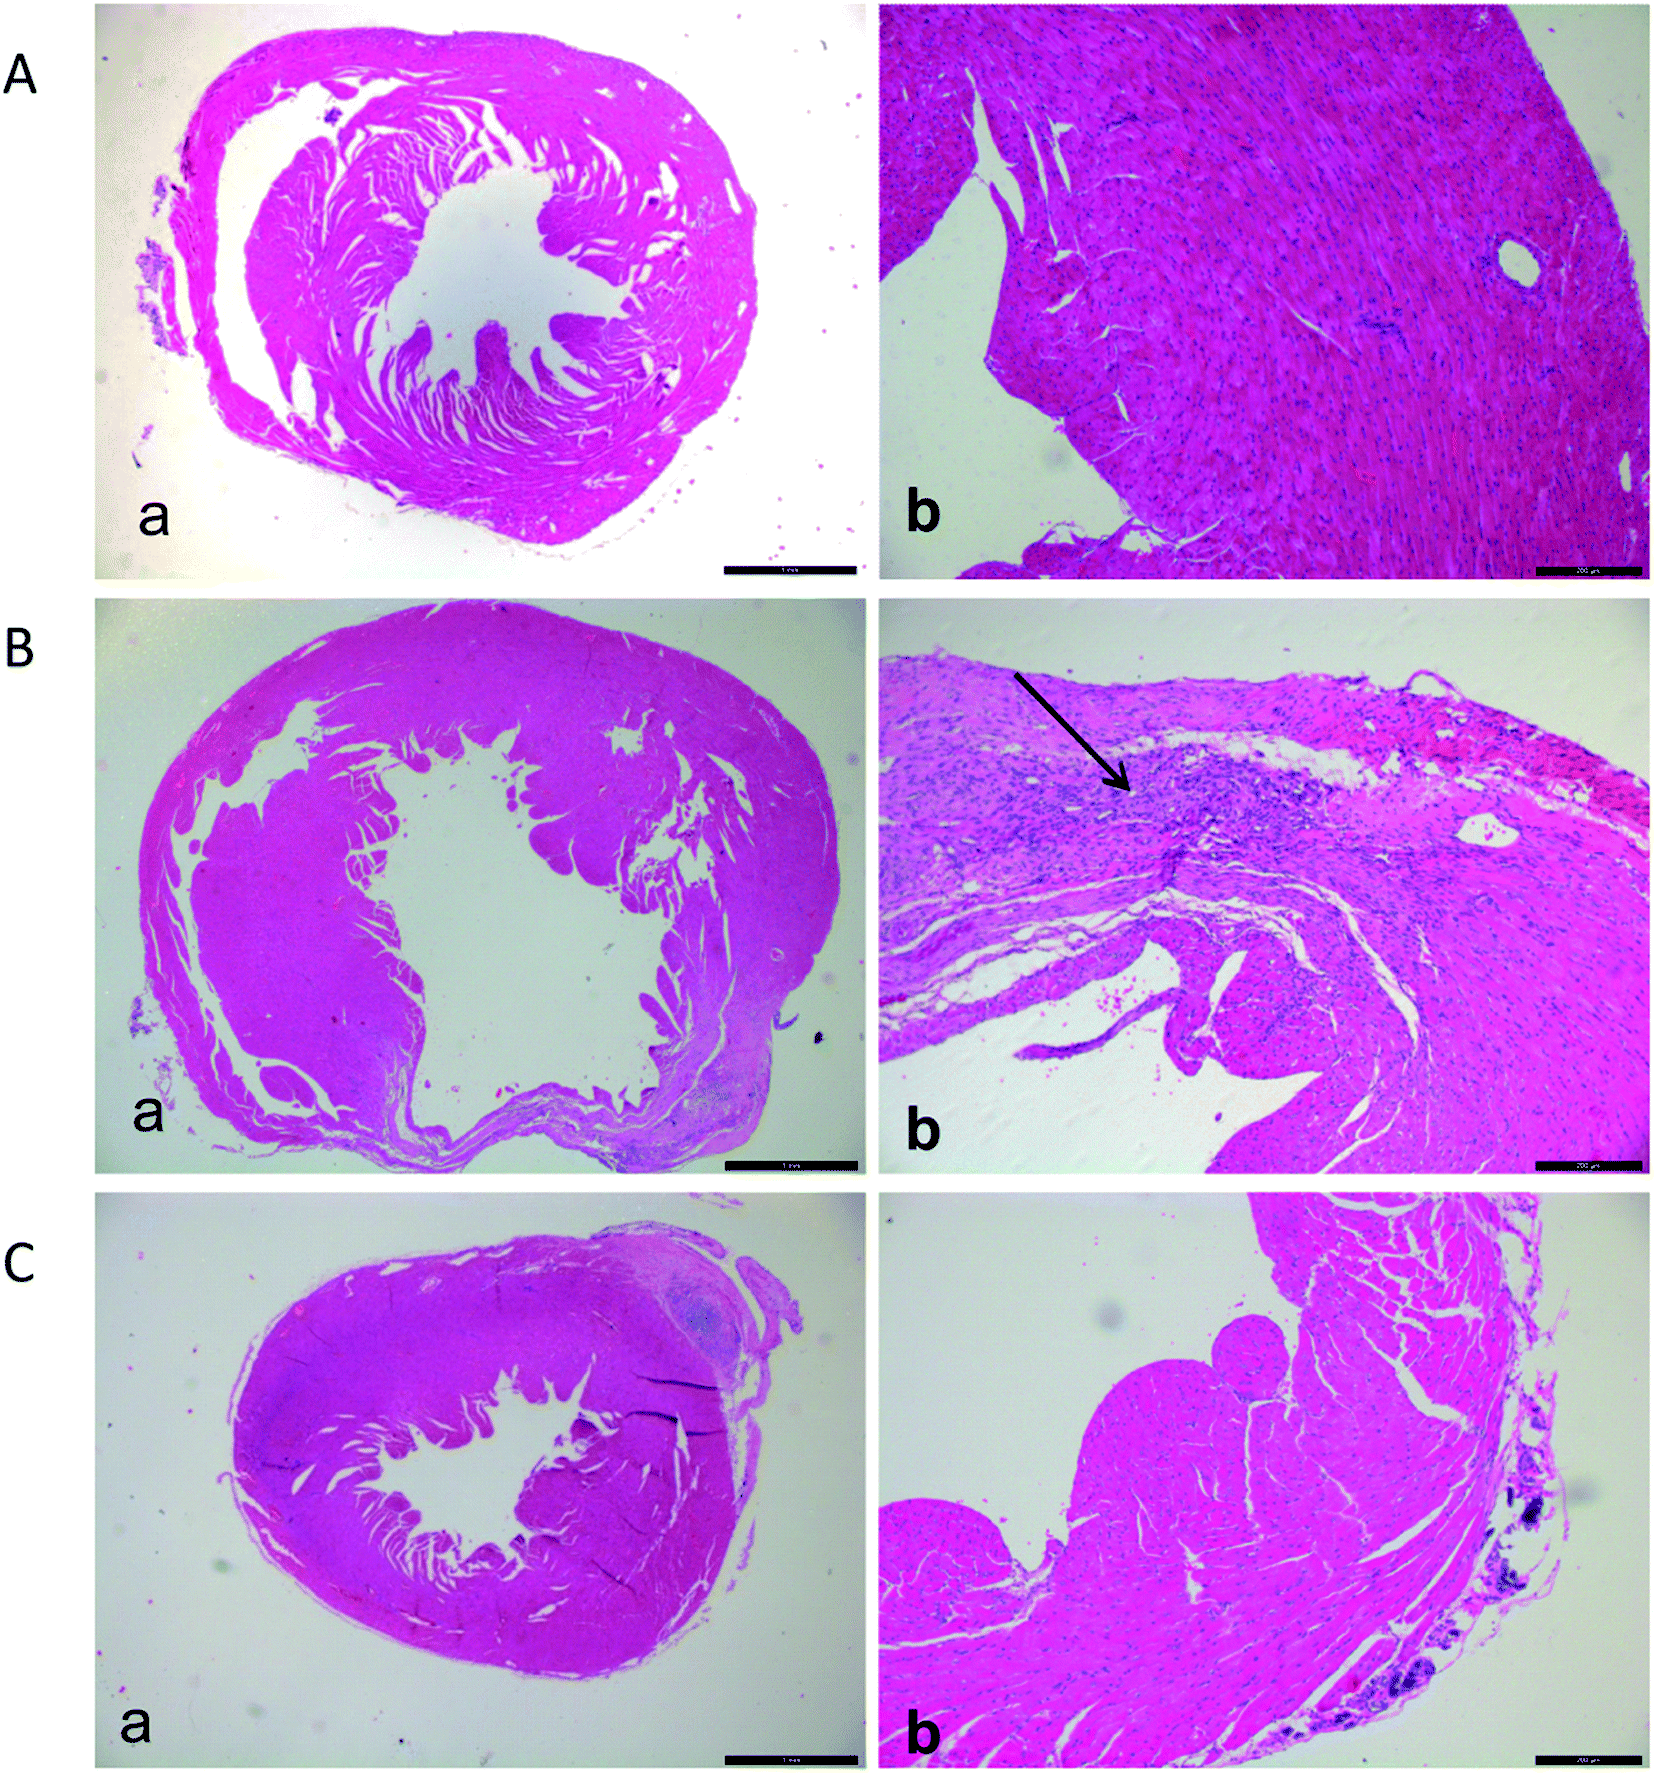
Marked infiltration of inflammatory cells into perivascular, lumen narrowing and mucosa thickening, were observed in the hearth tissue of the model group compared with the sham group tissue (Fig. 1); however, the heart tissues of mice in sham-operated group showed a normal architecture. Additionally, the structures of hearts in mice treated with LCZ696 showed progressive amelioration of the inflammatory process and improved restoration of the mucosal tissue.
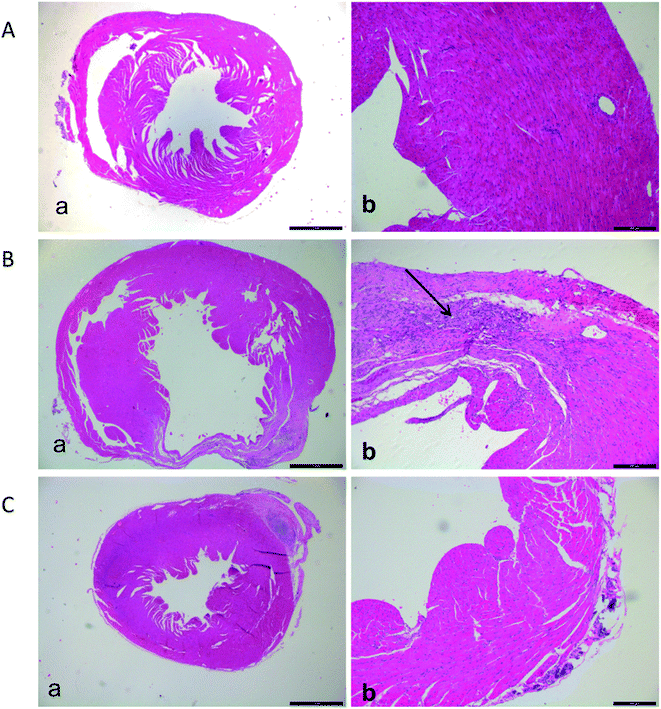 |
| | Fig. 1 Representative H&E stain of heart sections from (A) sham-operated group, (B) model group, (C) LCZ696-treated group. Representative H&E-staining micrographs displaying transverse myocardial section (original magnification ×100). | |
3.2. LCZ696 attenuated ischemia left ventricular dysfunction in mice
Left ventricular ejection fraction (LVEF) measured by echocardiography was significantly reduced in model mice group compared to sham-operated group and improved by treatment with LCZ696, while the left ventricular end-diastolic dimension (LVEDD) and end-systolic dimension (LVESD) were significantly increased in heart failure mice, which could be significantly attenuated by treatment with LCZ696 (Fig. 2A–D). Furthermore, NT-proBNP level was significantly higher in model group compared to sham-operated group, which tended to be lower post LCZ696 treatment. However, hs-cTnT levels were similar among three groups (Fig. 2E and F).
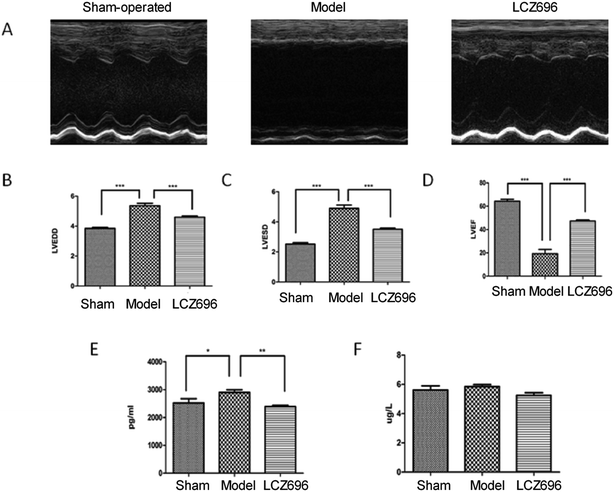 |
| | Fig. 2 Echocardiography parameters in sham-operated group, model group and LCZ696-treated group. All the quantitative data are presented as means ± standard error and compared by one-way ANOVA. (A) Echocardiography in three groups. (B) Left ventricular end-diastolic dimension (LVEDD). (C) End-systolic dimension (LVESD). (D) Left ventricular ejection fraction (LVEF). (E) N-Terminal pro brain natriuretic peptide (NT-proBNP). (F) High-sensitivity cardiac troponin T (hs-cTnT) in the three groups. *P < 0.05, **P < 0.01, and ***P < 0.001. | |
3.3. Tic chromatogram based on LC-Q-TOF MS
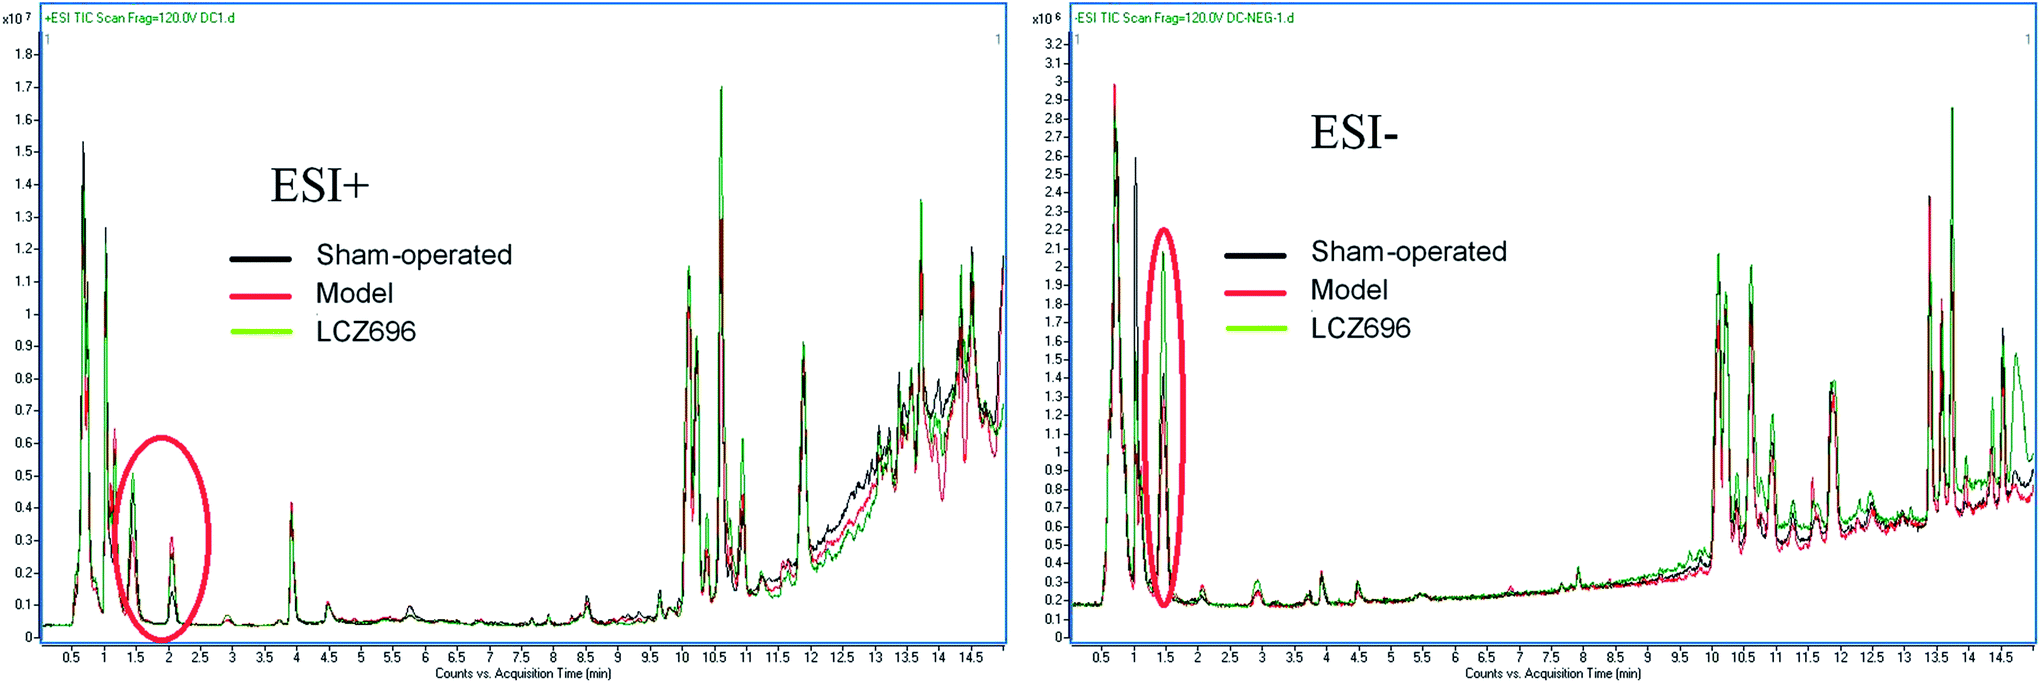
LC-Q-TOF MS was applied to obtain the metabolic profiles of the serum of sham-operated group, model mice group and LCZ696-treated group in the positive and negative ESI mode. The total ion current data obtained from all the samples was shown in Fig. 3. The good overlapping spectrum of all the samples (Fig. 3) demonstrated the excellent stability and reproducibility of chromatographic separation and mass measurement during the whole sequence.
 |
| | Fig. 3 The overlapped total ion chromatogram of sham-operated group, model group and LCZ696-treated group. One set each for positive and negative modes (ESI+, ESI−). | |
3.4. Identification of potential biomarkers
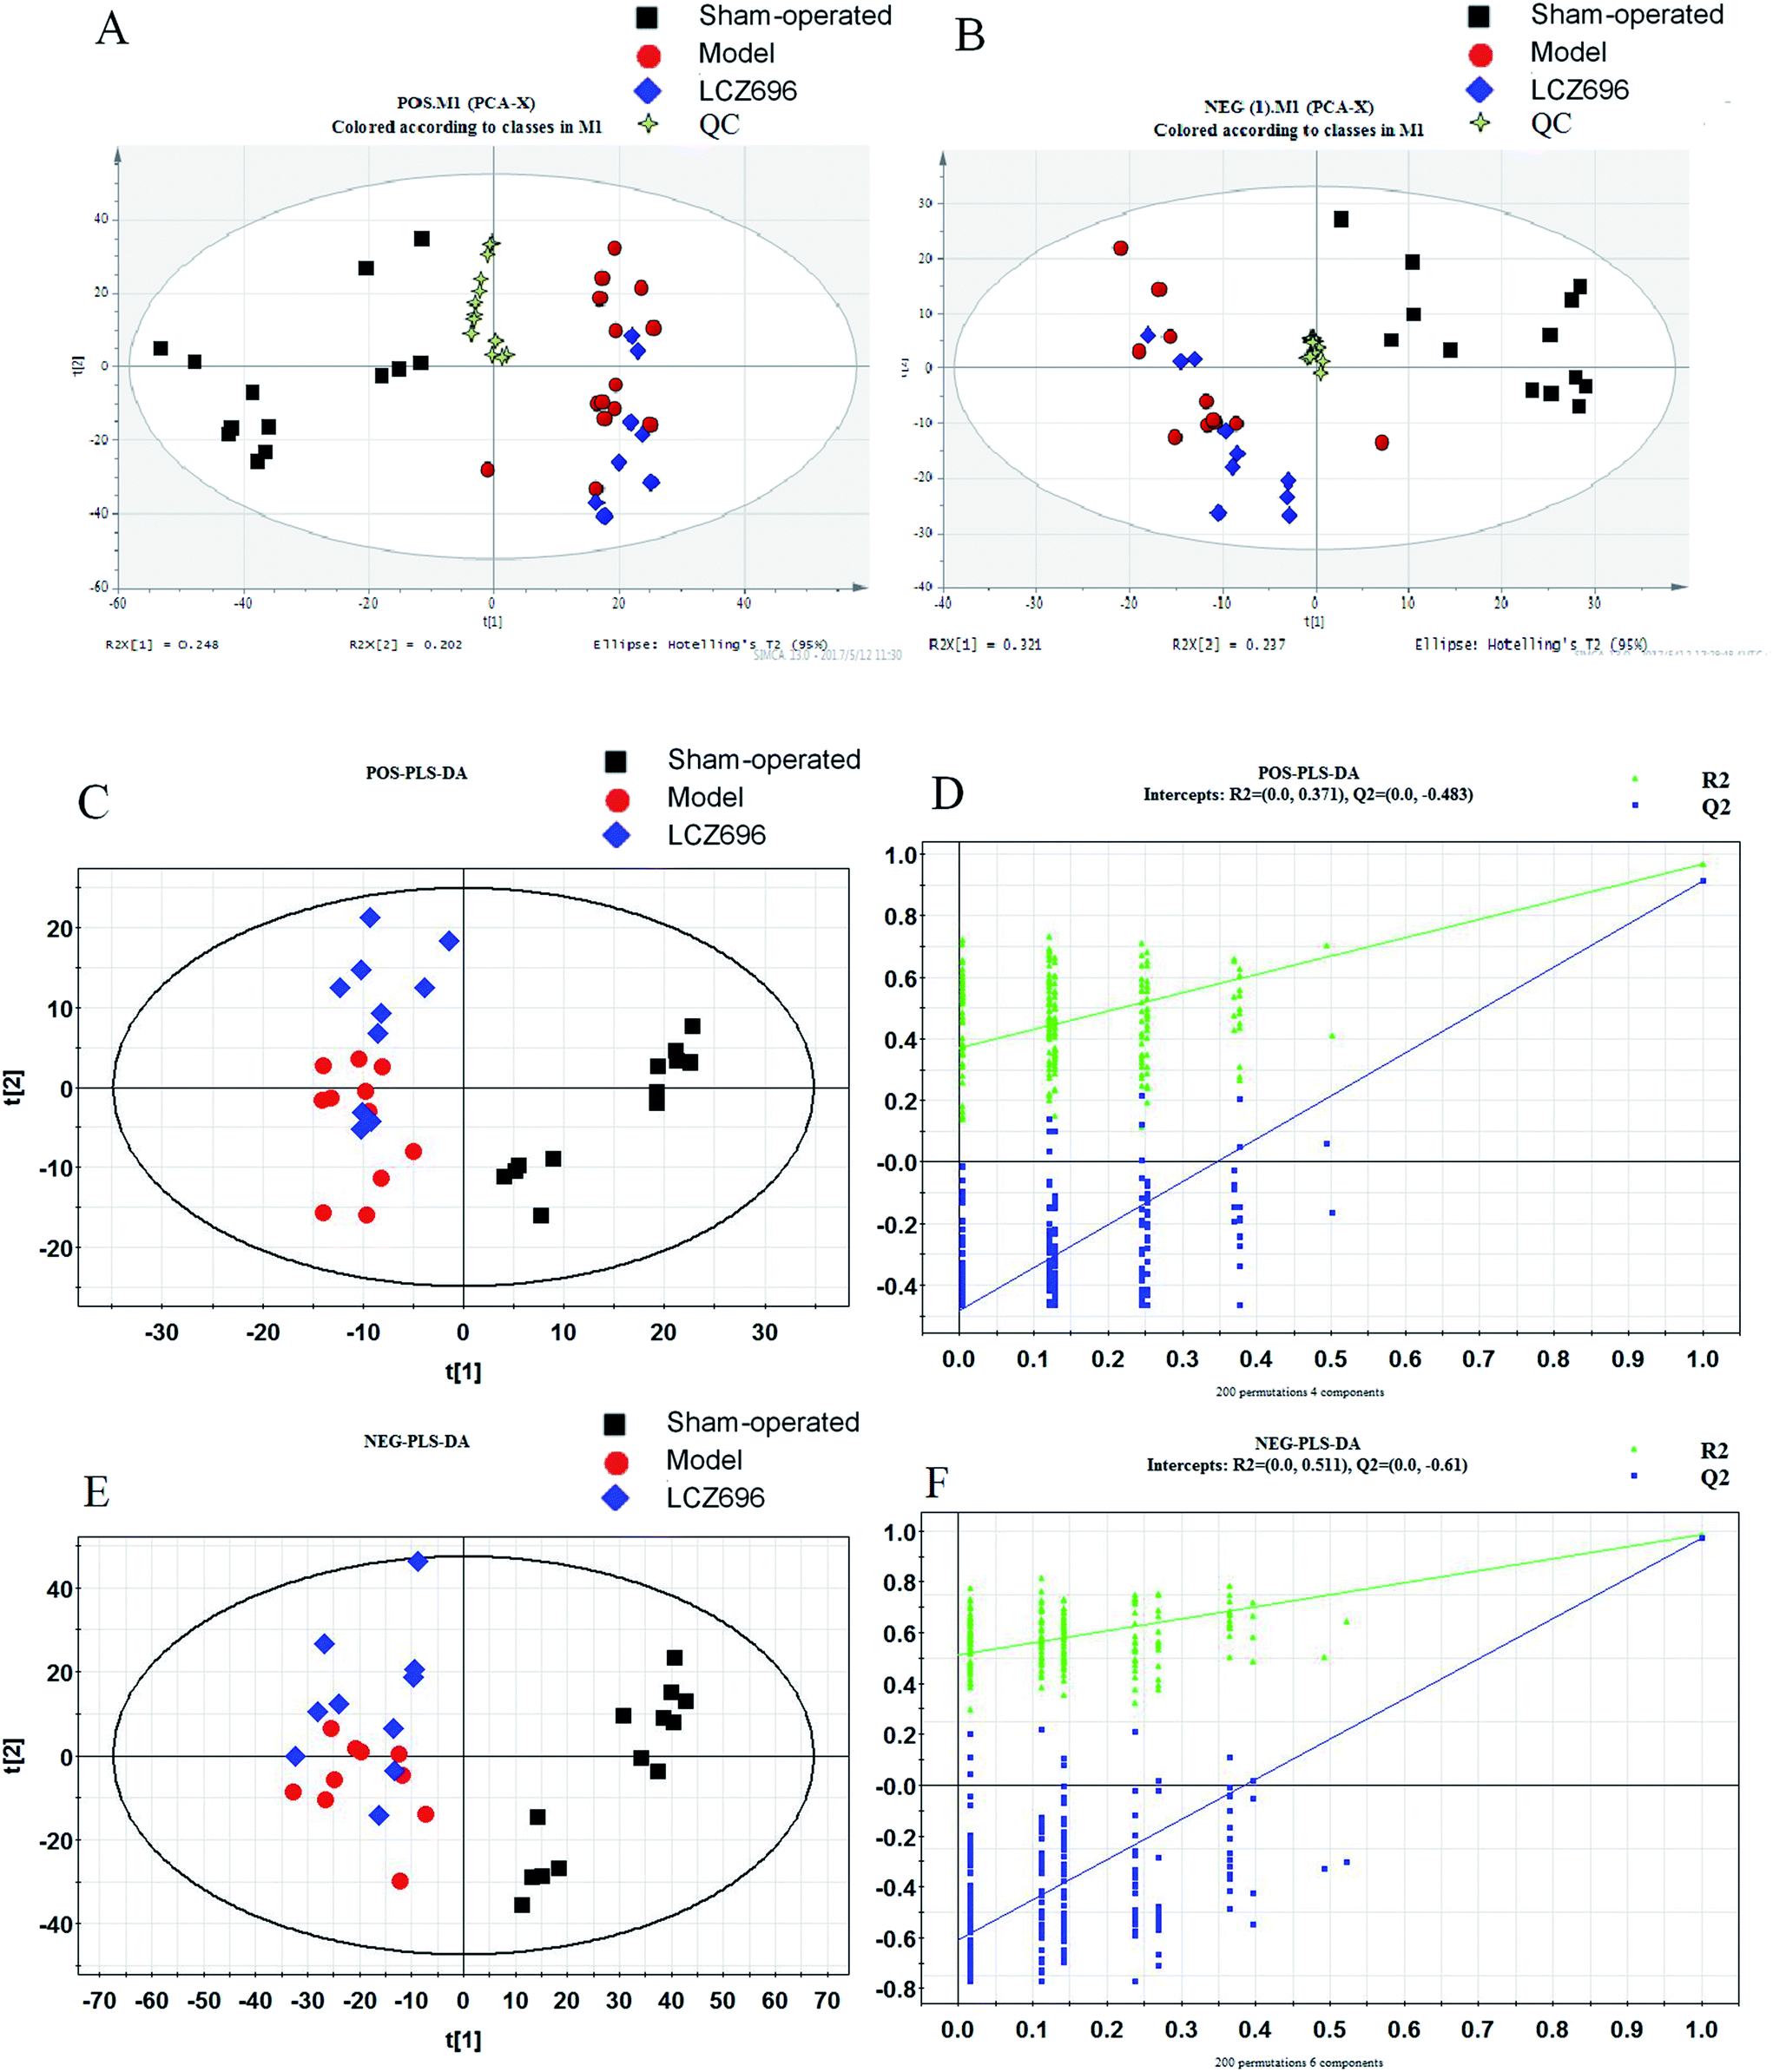
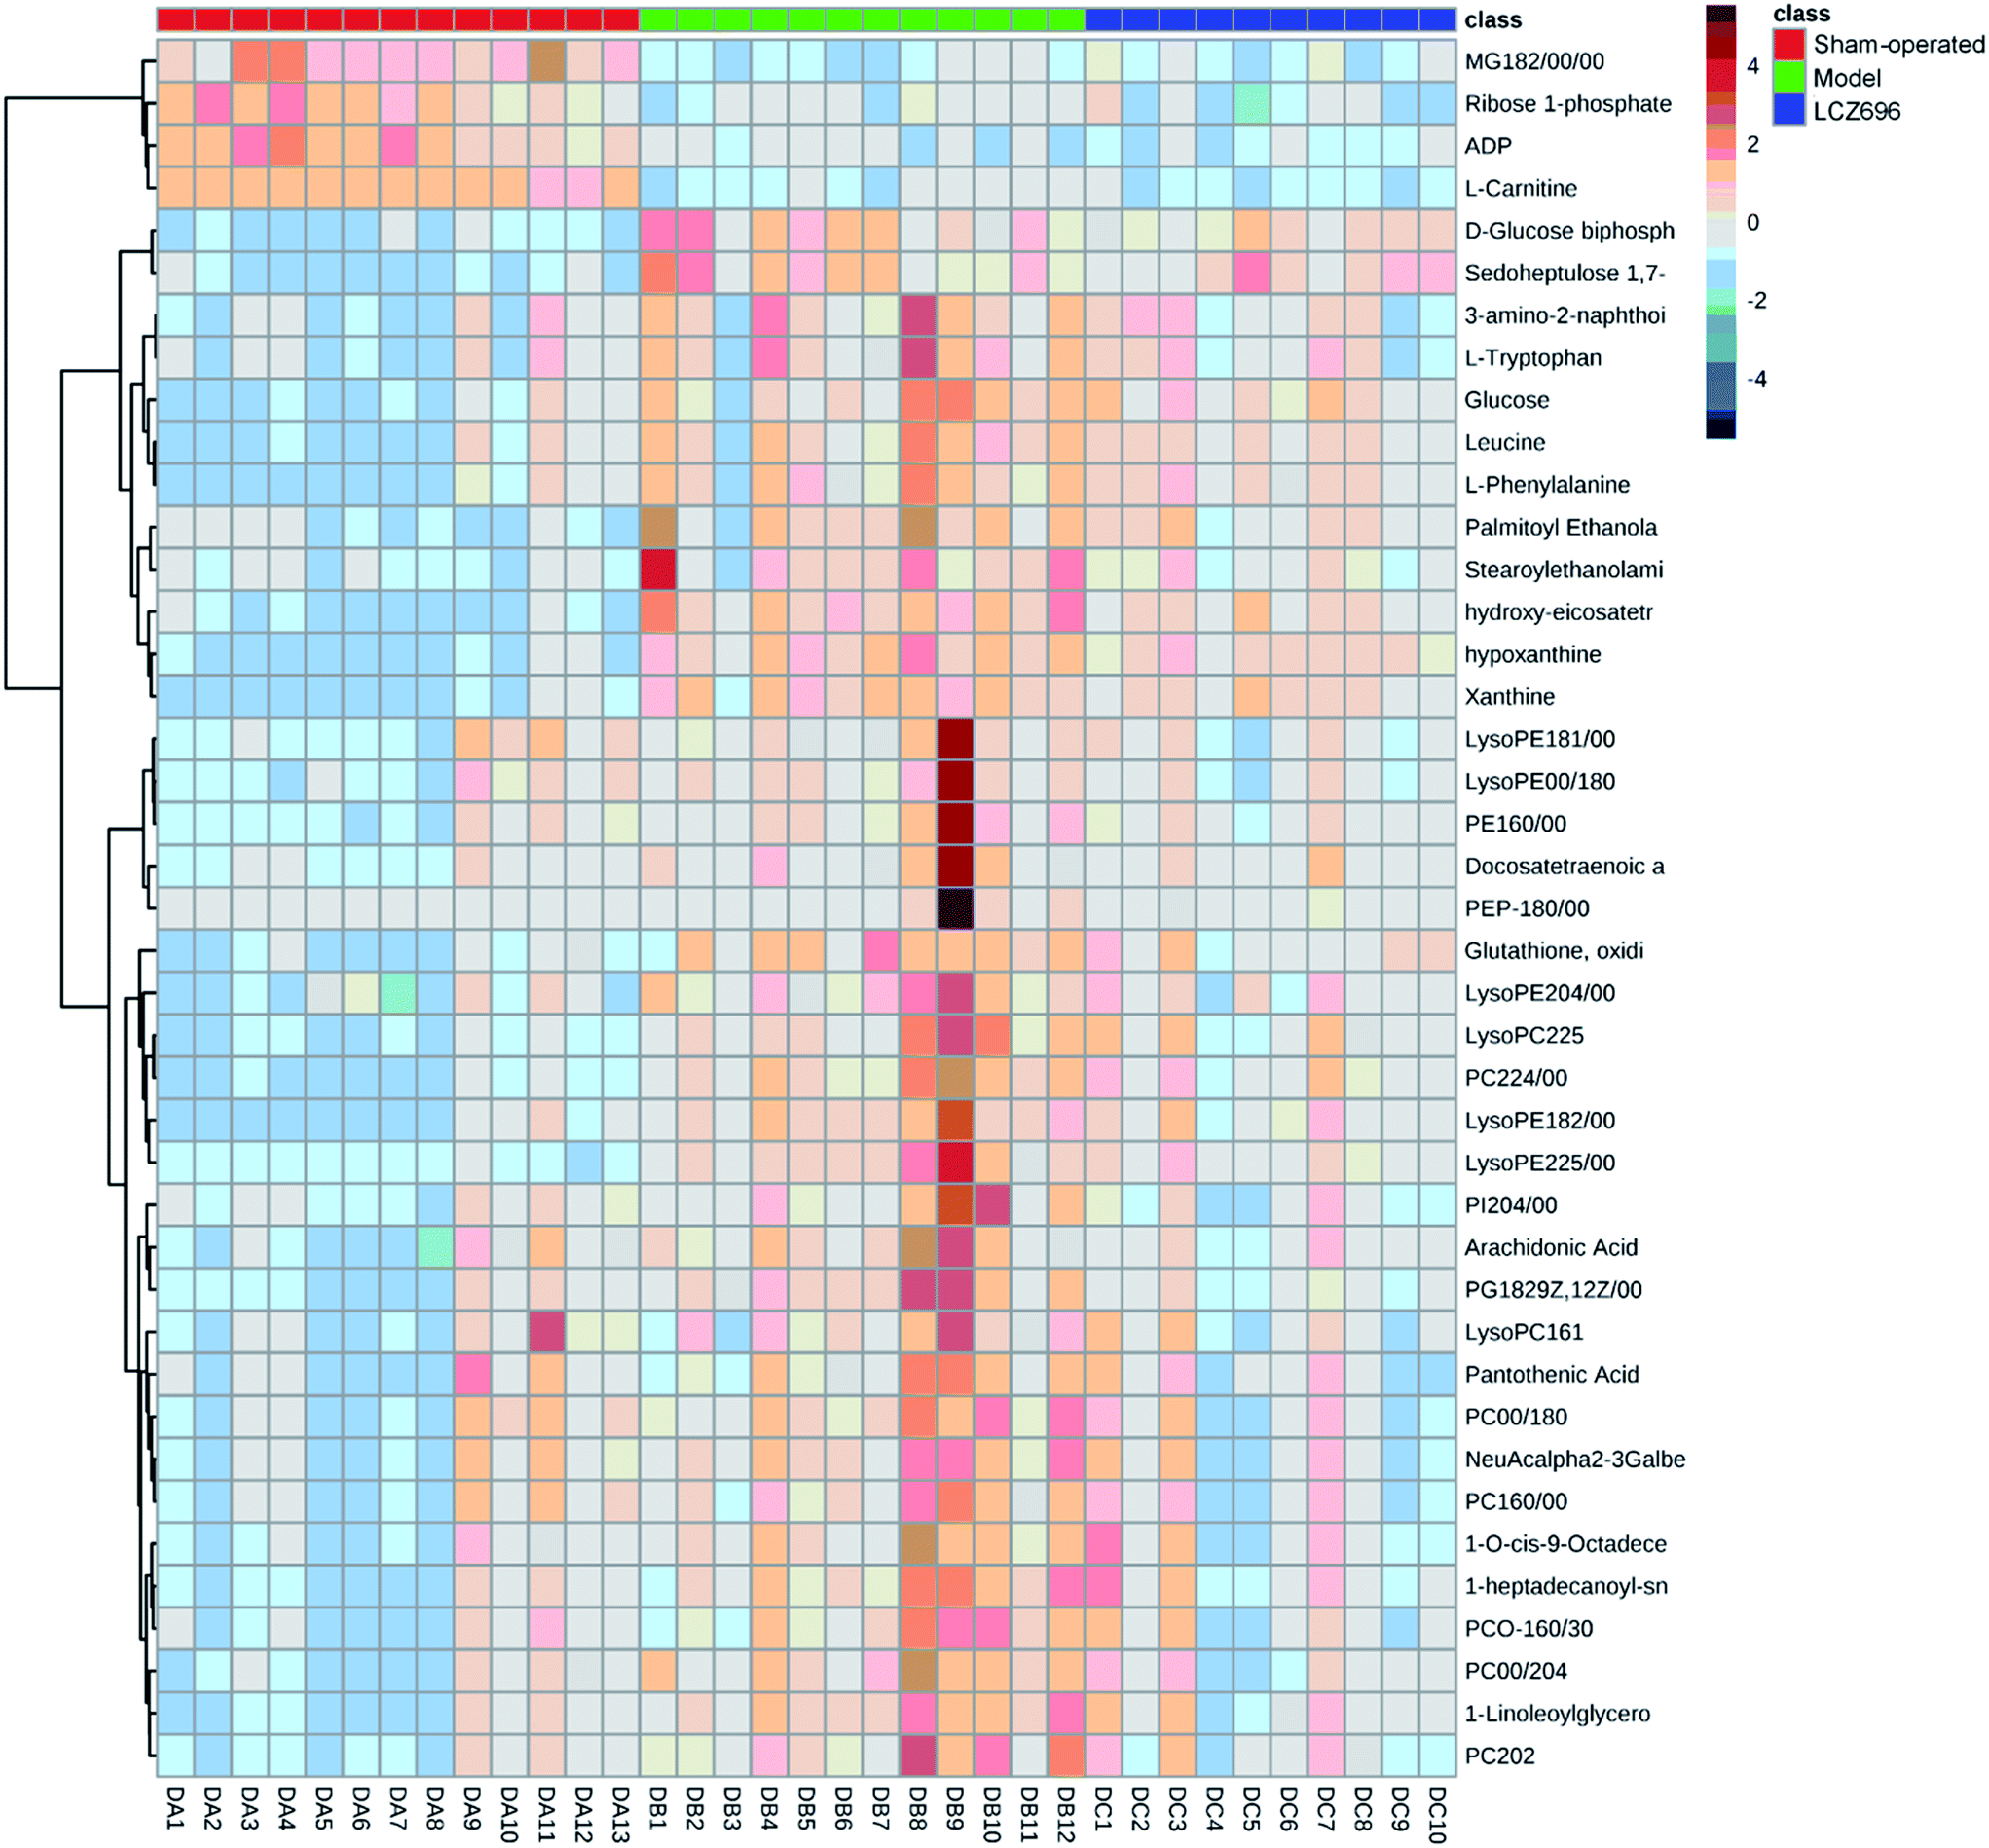
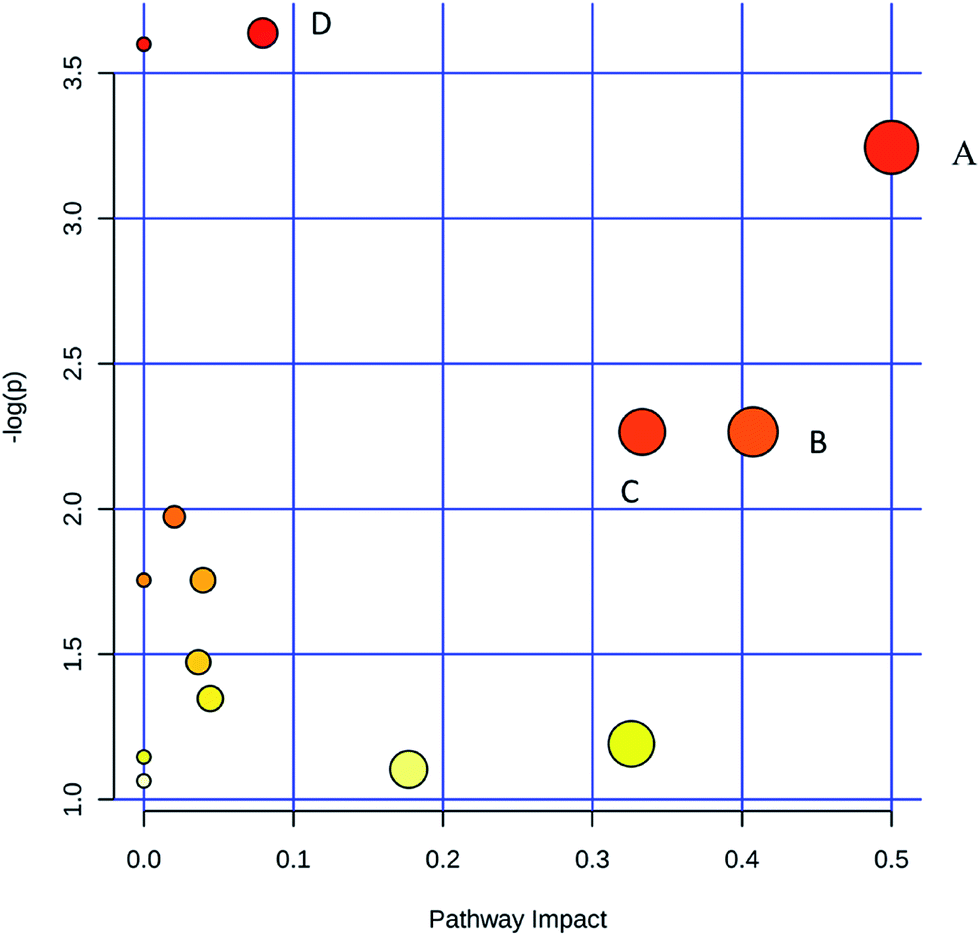
PCA was first performed on the dataset, and the PCA score plot of all experimental samples and quality controls (QCs) is shown in Fig. 4, which showed a trend of inter-group separation (Fig. 4A and B). Then PLS-DA analysis was implemented to directly search for treatment related metabolites and the results were displayed in the forms of score plots. Then PLS-DA analysis was implemented to directly search for treatment related metabolites and the results were displayed in the forms of score plots. The PLS-DA scores plots (Fig. 4C and E) showed three clusters of sham-operated group, model mice group and LCZ696-treated group (with R2X = 0.684, R2Y = 0.874, Q2 = 0.663 and R2X = 0.883, R2Y = 0.932, Q2 = 0.768, respectively). Model group was clearly separated from sham-operated group, while the LCZ696-treated group was close to sham-operated group. The permutation test (200 times) of the PLS-DA model corresponding to PCA model including correlation coefficient between the original Y and the permuted Y versus the cumulative R2 and Q2, with the regression line is shown in Fig. 4D and F. The intercept (R2 and Q2 when correlation coefficient is zero) which is correlated with the extent of overfitting is rather small (R2 (0.0, 0.371) and Q2 (0.0, −0.483) in positive mode, R2 (0.0, 0.511) and Q2 (0.0, −0.61) in negative mode), suggesting that the model had a good predictive power and goodness-of-fit. Furthermore, the variables (VIP > 1.0) that significantly contributed to the clustering and discrimination were then validated using an independent sample T-test (SPSS 17.0). The critical p-value was set to 0.05 for significantly differential variables in this study. As a result, 43 significantly differential metabolites from tissue samples were selected for further study. Some of compounds were authenticated based on RTs and MS/MS fragmentation patterns; and some of metabolites rely on native high resolution m/z data (Table 1). The MS/MS data information of potential biomarkers is shown in ESI.† The heatmap of 43 different metabolites was performed using a MetaboAnalyst platform (http://www.metaboanalyst.ca), as shown in Fig. 5; the levels of all 43 metabolites (shown in Table 1) were significantly altered in the model group compared to the sham-operated. In the LCZ696 treated group, these metabolites were significantly reversed. Furthermore, the 43 metabolites were subjected to pathway analysis based on metaboanalyst 3.0 (http://www.metaboanalyst.ca) and the associated metabolic pathways of each substance with their FDR values are summarized in Table 2. As shown in Fig. 6, phenylalanine, tyrosine and tryptophan biosynthesis, phenylalanine metabolism, valine, leucine and isoleucine biosynthesis and purine metabolism has been found as important metabolic pathways.
 |
| | Fig. 4 PCA score plot ((A) POS; (B) NEG) and PLS-DA score plot (C) POS (R2X = 0.366, R2Y = 0.828, Q2 = 0.785); (D) POS, A 999-times permutation test for the corresponding model. The Y-axis intercepts were: R2 (0, 0.529), Q2 (0, −0.954); (E) NEG (R2X = 0.837, R2Y = 0.974, Q2 = 0.829); (F) NEG, A 999-times permutation test for the corresponding model. The Y-axis intercepts were: R2 (0, 0.73), Q2 (0, −0.889). (■) sham-operated group, (●) model group, (◆) LCZ696-treated group. | |
Table 1 The potential biomarkers detected by UPLC-Q-TOF/MS and their variation tendency. (↑) Up-regulated; (↓) down-regulated. ‘P’ represents the P value in the T test. ‘FC’ represents the fold change; ‘m/z’ represents the mass charge ratio; ‘RT’ represents the retention time
| No. |
m/z |
RT/min |
VIP |
Metabolites |
Ion |
Identify |
Formula |
Trend (model vs. sham-operated) (LCZ696-treated vs. model) |
P (model vs. sham-operated) |
FC (model vs. sham-operated) |
P (LCZ696-treated vs. model) |
FC (LCZ696-treated vs. model) |
| 1 |
162.1120 |
0.66 |
6.42 |
L-Carnitine |
[M + H]+ |
Accurate mass, MS/MS |
C7H15NO3 |
↓↑ |
2.57 × 10⁻⁶ |
0.61 |
5.47 × 10⁻¹ |
1.12 |
| 2 |
215.0335 |
0.71 |
1.56 |
Glucose |
[M + Cl]− |
Accurate mass |
C6H12O6 |
↑↓ |
1.33 × 10⁻¹⁰ |
2.73 |
7.94 × 10⁻¹ |
0.98 |
| 3 |
229.0126 |
0.73 |
1.03 |
Ribose 1-phosphate |
[M − H]− |
Accurate mass |
C5H11O8P |
↓↑ |
4.63 × 10⁻⁴ |
0.73 |
6.59 × 10⁻¹ |
1.05 |
| 4 |
368.9999 |
0.87 |
1.17 |
Sedoheptulose 1,7-bisphosphate |
[M − H]− |
Accurate mass |
C7H16O13P2 |
↑↓ |
4.71 × 10⁻⁶ |
3.24 |
8.82 × 10⁻¹ |
0.98 |
| 5 |
338.9894 |
0.87 |
2.52 |
D-Glucose biphosphate |
[M − H]− |
Accurate mass |
C6H14O12P2 |
↑↓ |
2.44 × 10⁻⁶ |
3.05 |
5.63 × 10⁻¹ |
0.93 |
| 6 |
613.1600 |
0.89 |
1.80 |
Glutathione, oxidized |
[M + H]+ |
Accurate mass, MS/MS |
C20H32N6O12S2 |
↑↓ |
4.63 × 10⁻⁵ |
2.47 |
5.54 × 10⁻² |
0.70 |
| 611.1453 |
0.89 |
1.88 |
Glutathione, oxidized |
[M − H]− |
Accurate mass, MS/MS |
C20H32N6O12S2 |
↑↓ |
9.21 × 10⁻⁶ |
2.94 |
1.28 × 10⁻¹ |
0.79 |
| 7 |
135.0314 |
1.04 |
1.04 |
Hypoxanthine |
[M − H]− |
Accurate mass, MS/MS |
C5H4N4O |
↑↓ |
2.01 × 10⁻¹² |
3.06 |
2.86 × 10⁻¹ |
0.93 |
| 8 |
426.0229 |
1.04 |
1.39 |
ADP |
[M − H]− |
Accurate mass, MS/MS |
C10H15N5O10P2 |
↓↑ |
7.75 × 10⁻⁷ |
0.55 |
9.25 × 10⁻¹ |
1.01 |
| 9 |
153.0410 |
1.10 |
3.84 |
Xanthine |
[M + H]+ |
Accurate mass |
C5H4N4O2 |
↑↓ |
5.33 × 10⁻⁹ |
3.19 |
9.62 × 10⁻¹ |
0.98 |
| 151.0264 |
1.11 |
3.38 |
Xanthine |
[M − H]− |
Accurate mass, MS/MS |
C5H4N4O2 |
↑↓ |
4.92 × 10⁻¹² |
3.15 |
2.31 × 10⁻¹ |
0.92 |
| 10 |
132.1020 |
1.16 |
7.07 |
Isoleucine, L-leucine |
[M + H]+ |
Accurate mass, MS/MS |
C6H13NO2 |
↑↓ |
5.48 × 10⁻⁹ |
1.92 |
9.09 × 10⁻¹ |
0.98 |
| 11 |
164.0719 |
2.07 |
1.52 |
L-Phenylalanine |
[M − H]− |
Accurate mass, MS/MS |
C9H11NO2 |
↑↓ |
4.95 × 10⁻¹⁰ |
2.05 |
8.39 × 10⁻¹ |
0.99 |
| 12 |
220.1180 |
2.92 |
1.40 |
Pantothenic acid |
[M + H]+ |
Accurate mass, MS/MS |
C9H17NO5 |
↑↓ |
1.72 × 10⁻⁵ |
1.50 |
3.33 × 10⁻¹ |
0.91 |
| 218.1038 |
2.93 |
1.49 |
Pantothenic acid |
[M − H]− |
Accurate mass, MS/MS |
C9H17NO5 |
↑↓ |
6.64 × 10⁻⁵ |
1.44 |
2.47 × 10⁻¹ |
0.92 |
| 13 |
188.0710 |
3.97 |
1.28 |
3-Amino-2-naphthoic acid |
[M + H]+ |
Accurate mass, MS/MS |
C11H9NO2 |
↑↓ |
5.14 × 10⁻⁹ |
1.59 |
4.91 × 10⁻¹ |
0.96 |
| 14 |
205.0970 |
3.97 |
1.75 |
L-Tryptophan |
[M + H]+ |
Accurate mass, MS/MS |
C11H12N2O2 |
↑↓ |
5.12 × 10⁻⁹ |
1.64 |
1.90 × 10⁻¹ |
0.93 |
| 15 |
494.3250 |
9.83 |
1.03 |
LysoPC(16:1), PC(16:1/0:0) |
[M + H]+ |
Accurate mass |
C24H48NO7P |
↑↓ |
1.28 × 10⁻² |
1.60 |
4.14 × 10⁻¹ |
0.83 |
| 16 |
544.3400 |
10.11 |
5.16 |
PC(20:4/0:0), LysoPC(20:4) |
[M + H]+ |
Accurate mass |
C28H50NO7P |
↑↓ |
4.13 × 10⁻⁸ |
1.86 |
2.88 × 10⁻² |
0.83 |
| 588.3312 |
10.11 |
2.23 |
LysoPC(20:4) |
[M + FA − H]− |
Accurate mass |
C28H50NO7P |
↑↓ |
1.31 × 10⁻⁷ |
1.88 |
7.23 × 10⁻² |
0.86 |
| 17 |
520.3400 |
10.12 |
6.39 |
1-Linoleoylglycerophosphocholine |
[M + H]+ |
Accurate mass |
C26H50NO7P |
↑↓ |
2.45 × 10⁻⁷ |
1.98 |
2.05 × 10⁻¹ |
0.87 |
| 564.3314 |
10.12 |
2.49 |
1-Linoleoylglycerophosphocholine |
[M + FA − H]− |
Accurate mass, MS/MS |
C26H50NO7P |
↑↓ |
3.02 × 10⁻⁶ |
1.85 |
8.86 × 10⁻¹ |
0.99 |
| 18 |
476.2787 |
10.17 |
1.70 |
PE(18:2/0:0) |
[M − H]− |
Accurate mass, MS/MS |
C23H44NO7P |
↑↓ |
6.38 × 10⁻⁹ |
2.11 |
1.95 × 10⁻¹ |
0.91 |
| 19 |
500.2787 |
10.22 |
1.19 |
LysoPE(20:4/0:0), PE(20:40:0) |
[M − H]− |
Accurate mass, MS/MS |
C25H44NO7P |
↑↓ |
4.34 × 10⁻⁶ |
1.50 |
7.16 × 10⁻¹ |
0.98 |
| 20 |
454.2930 |
10.55 |
2.41 |
PE(16:0/0:0) |
[M + H]+ |
Accurate mass, MS/MS |
C21H44NO7P |
↑↓ |
1.97 × 10⁻⁴ |
1.64 |
1.12 × 10⁻¹ |
0.81 |
| 452.2790 |
10.56 |
2.34 |
PE(16:0/0:0) |
[M − H]− |
Accurate mass, MS/MS |
C21H44NO7P |
↑↓ |
2.35 × 10⁻⁴ |
1.55 |
8.66 × 10⁻² |
0.84 |
| 21 |
991.6730 |
10.60 |
6.42 |
NeuAcalpha2-3Galbeta-Cer(d18:1/16:0) |
[M + H]+ |
Accurate mass |
C51H94N2O16 |
↑↓ |
3.63 × 10⁻⁴ |
1.83 |
5.37 × 10⁻² |
0.73 |
| 22 |
540.3313 |
10.61 |
3.97 |
PC(16:0/0:0), PC(0:0/16:0), LysoPC(16:0) |
[M + FA − H]− |
Accurate mass, MS/MS |
C24H50NO7P |
↑↓ |
1.83 × 10⁻³ |
1.30 |
5.64 × 10⁻¹ |
0.96 |
| 23 |
528.3090 |
10.64 |
2.46 |
LysoPE(22:5/0:0) |
[M + H]+ |
Accurate mass |
C27H46NO7P |
↑↓ |
5.19 × 10⁻⁹ |
4.11 |
6.09 × 10⁻² |
0.81 |
| 24 |
570.3560 |
10.67 |
6.34 |
LysoPC(22:5) |
[M + H]+ |
Accurate mass |
C30H52NO7P |
↑↓ |
4.06 × 10⁻⁸ |
4.97 |
4.65 × 10⁻² |
0.72 |
| 25 |
526.2945 |
10.78 |
2.68 |
LysoPE(22:5/0:0), LysoPE(0:0/22:5) |
[M − H]− |
Accurate mass, MS/MS |
C27H46NO7P |
↑↓ |
9.27 × 10⁻¹⁶ |
4.46 |
7.90 × 10⁻³ |
0.85 |
| 26 |
614.3467 |
10.82 |
1.76 |
LysoPC(22:5) |
[M + FA − H]− |
Accurate mass, MS/MS |
C30H52NO7P |
↑↓ |
5.15 × 10⁻⁵ |
1.74 |
2.52 × 10⁻¹ |
0.89 |
| 27 |
478.2945 |
10.90 |
1.90 |
LysoPE(18:1/0:0), PE(18:1/0:0), LysoPE(0:0/18:1) |
[M − H]− |
Accurate mass, MS/MS |
C23H46NO7P |
↑↓ |
7.87 × 10⁻³ |
1.45 |
1.22 × 10⁻¹ |
0.82 |
| 28 |
572.3710 |
10.95 |
2.89 |
PC(22:4/0:0), LysoPC(22:4) |
[M + H]+ |
Accurate mass |
C30H54NO7P |
↑↓ |
5.63 × 10⁻⁹ |
4.31 |
2.27 × 10⁻² |
0.75 |
| 616.3619 |
11.12 |
1.02 |
PC(22:4/0:0), LysoPC(22:4) |
[M + FA − H]− |
Accurate mass, MS/MS |
C30H54NO7P |
↑↓ |
2.91 × 10⁻¹⁵ |
3.42 |
1.71 × 10⁻² |
0.87 |
| 29 |
548.3710 |
11.17 |
1.14 |
PC(20:2), LysoPC(20:2) |
[M + H]+ |
Accurate mass |
C28H55NO7P |
↑↓ |
3.19 × 10⁻⁸ |
2.26 |
6.00 × 10⁻³ |
0.74 |
| 30 |
510.3560 |
11.23 |
1.86 |
1-Heptadecanoyl-sn-glycero-3-phosphocholine |
[M + H]+ |
Accurate mass, MS/MS |
C25H52NO7P |
↑↓ |
6.02 × 10⁻⁶ |
2.05 |
9.95 × 10⁻² |
0.80 |
| 31 |
319.2282 |
11.58 |
2.74 |
Hydroxy-eicosatetraenoic acid |
[M − H]− |
Accurate mass, MS/MS |
C20H32O3 |
↑↓ |
2.08 × 10⁻¹³ |
4.46 |
1.03 × 10⁻³ |
0.76 |
| 32 |
480.3101 |
11.86 |
3.52 |
LysoPE(0:0/18:0), PE(18:0/0:0) |
[M − H]− |
Accurate mass, MS/MS |
C23H48NO7P |
↑↓ |
1.44 × 10⁻³ |
1.46 |
1.42 × 10⁻¹ |
0.86 |
| 33 |
524.3720 |
11.89 |
7.07 |
PC(0:0/18:0), PC(18:0/0:0), LysoPC(18:0), LysoPC(0:0/18:0) |
[M + H]+ |
Accurate mass |
C26H54NO7P |
↑↓ |
9.80 × 10⁻⁵ |
1.44 |
1.19 × 10⁻¹ |
0.86 |
| 568.3625 |
11.92 |
3.24 |
PC(0:0/18:0), PC(18:0/0:0), LysoPC(18:0), LysoPC(0:0/18:0) |
[M + FA − H]− |
Accurate mass, MS/MS |
C26H54NO7P |
↑↓ |
1.83 × 10⁻⁴ |
1.36 |
1.19 × 10⁻¹ |
0.89 |
| 34 |
550.3870 |
12.14 |
1.15 |
1-O-(cis-9-Octadecenyl)-2-O-acetyl-sn-glycero-3-phosphocholine |
[M + H]+ |
Accurate mass, MS/MS |
C28H56NO7P |
↑↓ |
2.47 × 10⁻⁵ |
1.76 |
1.02 × 10⁻¹ |
0.82 |
| 35 |
466.3300 |
12.26 |
1.43 |
PE(P-18:0/0:0) |
[M + H]+ |
Accurate mass |
C23H48NO6P |
↑↓ |
9.52 × 10⁻⁴ |
1.50 |
6.99 × 10⁻¹ |
0.93 |
| 464.3149 |
12.28 |
1.23 |
PE(P-18:0/0:0) |
[M − H]− |
Accurate mass, MS/MS |
C23H48NO6P |
↑↓ |
4.17 × 10⁻³ |
1.34 |
3.85 × 10⁻¹ |
0.92 |
| 36 |
619.2889 |
12.53 |
2.19 |
PI(20:4/0:0) |
[M − H]− |
Accurate mass |
C29H49O12P |
↑↓ |
6.19 × 10⁻⁴ |
1.49 |
1.32 × 10⁻² |
0.76 |
| 37 |
538.3870 |
12.60 |
1.32 |
PC(O-16:0/3:0) |
[M + H]+ |
Accurate mass |
C27H56NO7P |
↑↓ |
1.62 × 10⁻⁵ |
1.69 |
8.83 × 10⁻² |
0.83 |
| 38 |
300.2900 |
12.77 |
1.57 |
Palmitoyl ethanolamide |
[M + H]+ |
Accurate mass, MS/MS |
C18H37NO2 |
↑↓ |
5.18 × 10⁻⁹ |
3.07 |
1.16 × 10⁻² |
0.78 |
| 39 |
355.2840 |
12.88 |
1.07 |
MG(18:2/0:0/0:0), MG(0:0/18:2/0:0), MG(0:0/18:2/0:0) |
[M + H]+ |
Accurate mass |
C21H38O4 |
↓↑ |
1.07 × 10⁻⁸ |
0.28 |
8.36 × 10⁻¹ |
1.19 |
| 40 |
303.2333 |
13.59 |
4.15 |
Arachidonic acid |
[M − H]− |
Accurate mass, MS/MS |
C20H32O2 |
↑↓ |
6.28 × 10⁻⁵ |
1.58 |
8.14 × 10⁻² |
0.85 |
| 41 |
328.3210 |
14.09 |
1.05 |
Stearoylethanolamide |
[M + H]+ |
Accurate mass |
C20H41NO2 |
↑↓ |
5.95 × 10⁻⁷ |
2.80 |
1.23 × 10⁻² |
0.68 |
| 42 |
507.2731 |
14.17 |
1.47 |
PG(18:2(9Z,12Z)/0:0) |
[M − H]− |
Accurate mass, MS/MS |
C24H45O9P |
↑↓ |
2.63 × 10⁻⁷ |
2.70 |
1.25 × 10⁻⁴ |
0.55 |
| 43 |
331.2645 |
14.32 |
1.58 |
Docosatetraenoic acid |
[M − H]− |
Accurate mass, MS/MS |
C22H36O2 |
↑↓ |
2.19 × 10⁻⁶ |
2.44 |
1.22 × 10⁻¹ |
0.83 |
 |
| | Fig. 5 Heatmap of potential markers in the sham-operated group and model group, LCZ696-treated group. | |
Table 2 The associated metabolic pathways of each biomarker
| Pathway name |
Match status |
p |
−log(p) |
Holm p |
FDR |
Impact |
| Purine metabolism |
3/68 |
0.026305 |
3.638 |
1 |
1 |
0.07958 |
| Aminoacyl-tRNA biosynthesis |
3/69 |
0.027339 |
3.5994 |
1 |
1 |
0 |
| Phenylalanine, tyrosine and tryptophan biosynthesis |
1/4 |
0.038979 |
3.2447 |
1 |
1 |
0.5 |
| Valine, leucine and isoleucine biosynthesis |
1/11 |
0.10382 |
2.2651 |
1 |
1 |
0.33333 |
| Phenylalanine metabolism |
1/11 |
0.10382 |
2.2651 |
1 |
1 |
0.40741 |
| Pantothenate and CoA biosynthesis |
1/15 |
0.13902 |
1.9732 |
1 |
1 |
0.02041 |
| Pentose phosphate pathway |
1/19 |
0.17293 |
1.7549 |
1 |
1 |
0 |
| Starch and sucrose metabolism |
1/26 |
0.17293 |
1.7549 |
1 |
1 |
0.03958 |
| Galactose metabolism |
1/30 |
0.22931 |
1.4727 |
1 |
1 |
0.03644 |
| Glycerophospholipid metabolism |
1/30 |
0.25991 |
1.3474 |
1 |
1 |
0.04444 |
| Arachidonic acid metabolism |
1/36 |
0.30369 |
1.1917 |
1 |
1 |
0.32601 |
| Valine, leucine and isoleucine degradation |
1/38 |
0.31774 |
1.1465 |
1 |
1 |
0 |
| Tryptophan metabolism |
1/40 |
0.33153 |
1.104 |
1 |
1 |
0.17715 |
| Biosynthesis of unsaturated fatty acids |
1/42 |
0.34506 |
1.064 |
1 |
1 |
0 |
 |
| | Fig. 6 Summary of important metabolic pathways using IPA analysis: (A) phenylalanine, tyrosine and tryptophan biosynthesis, (B) phenylalanine metabolism, (C) valine, leucine and isoleucine biosynthesis, (D) purine metabolism. | |
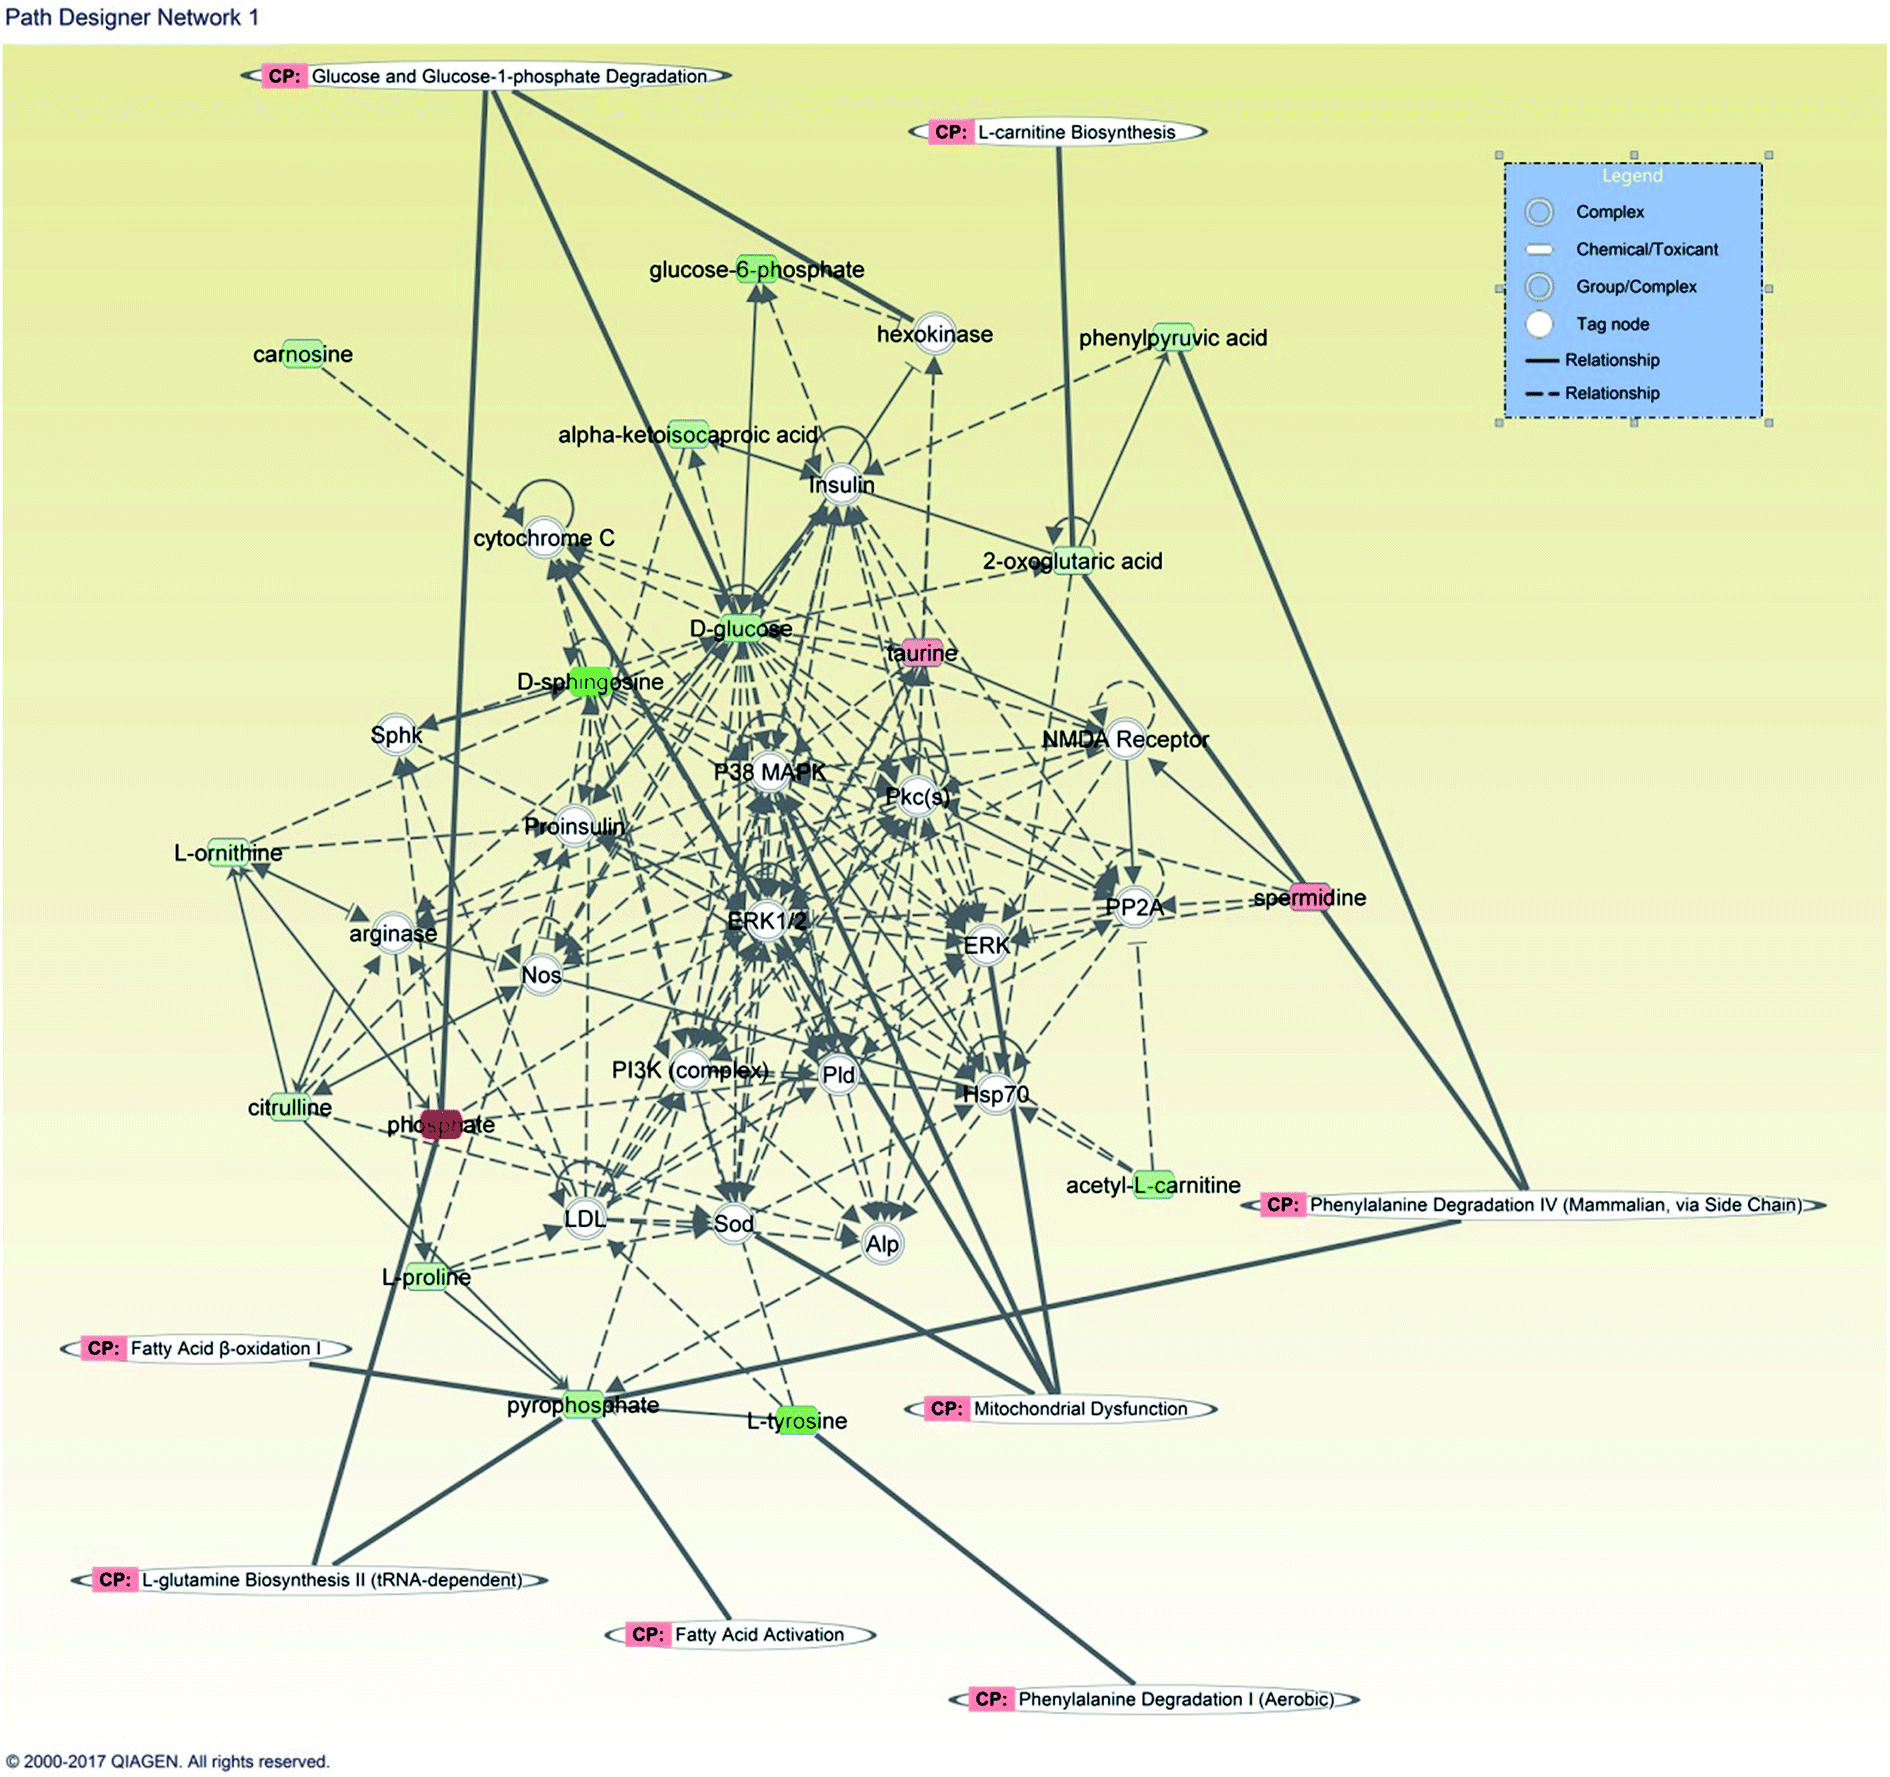
3.5. The network function analysis by IPA
IPA analysis was applied to build network with potential biomarkers of heart failure. In the network function analysis, the related metabolites tended to gather into one single network (Fig. 7). The top 5 altered pathways were fatty acid β-oxidation, mitochondrialin dysfunction, phenylalanine degradation, fatty acid activation, cainitine biosynthesis.
 |
| | Fig. 7 Biological network, canonical pathways and functions related to the identified metabolites. In the network, molecules are represented as nodes, and the biological relationship between two nodes is represented as a line. Red symbols represent up-regulated metabolites; blue symbols represent down-regulated metabolites; while the green symbols represent canonical pathways that are related to the identified specific metabolites. Solid lines between molecules show a direct physical relationship between molecules, while dotted lines show indirect functional relationships. | |
4. Discussion
In the present study, the model mice were subjected to induction of myocardial infarction (MI) by left anterior descending ligation. The biomarkers of heart failure and the molecular mechanisms underlying the beneficial effects of LCZ696 in heart failure treatment were studied using the metabonomics method. In model heart tissues of mice, we observed marked infiltration of inflammatory cells into perivascular and, connective tissues lumen narrowing and mucosa thickening compared with the normal tissue. Furthermore, after treatment with LCZ696, left ventricular end-diastolic dimension (LVEDD) and end-systolic dimension (LVESD) were significantly increased in heart failure group. In addition, metabolic profiling of each group was performed by UPLC-Q-TOF-MS. 43 metabolites, distributed into 13 metabolic pathways, were identified in heart tissues as potential biomarkers for heart failure. The metabolic pathways included the metabolism of amino acids, phospholipids and fatty acids.
4.1. Amino acid metabolism
Among these molecules, the most obvious change was the imbalance of amino acid metabolism. In the model group, the levels of leucine, phenylalanine, tryptophan, and glutamine were all elevated. Previous studies have shown associations between plasma amino acid profiling and the likelihood of future risk of cardiometabolic diseases, such as diabetes19,20 and coronary artery disease.21,22 Furthermore, previous studies have shown that plasma amino acid profiling can successfully predict cardiometabolic risk. Wang et al.19,20 showed that glutamine and phenylalanine were highly associated with future development of diabetes in a healthy population. Amino acids may be involved in pathophysiology of heart failure. For example, phenylalanine can be converted into catecholamines, the hormones released by the adrenal glands under stress.23
4.2. Energy metabolism and fatty acids
The heart has a very high energy demand mainly derived primarily from mitochondrial oxidative phosphorylation.24 The heart can use a wide range of substrates for energy production, including fatty acids and carbohydrates (glucose and lactate). In the sham group, the oxidation of fatty acids is the main source of ATP production, while in certain conditions, glucose and lactate oxidation may be the major source of energy.24,25 The metabolism of fatty acids and glucose in heart is highly regulated and closely coupled, therefore an increase in fatty acid β-oxidation results in a decrease in carbohydrate oxidation.26 In our study, L-Carnitine, ribose 1-phosphate, D-glucose biphosphate, and ADP were all down regulated compared to sham-operated group, while the glucose was elevated. These results suggested that glucose oxidation was inhibited in model group due to limited coronary blood flow after heart failure. There is a growing body of evidence that myocardial cells rely more on glucose as its preferential substrate rather than on fatty acids in advanced stages of heart failure. This contributes to cardiac pathology, nevertheless the exact mechanism still remains unclear.27 In this study, we found significantly increased levels of arachidonic acid, docosatetraenoic acid, stearoylethanolamide and pantothenic acid in the model group. The docosatetraenoic acid is long-chain fatty acid that provides a substantial proportion of energy in the healthy heart. However, after a MI insult, the circulating fatty acids increase and brake down the balance of cardiac fatty acid uptake and oxidation.28 Consistent with this hypothesis, our results revealed elevated excretion of arachidonic acid, docosatetraenoic acid, stearoylethanolamide and pantothenic acid, revealing the disturbance of energy metabolism after heart failure. In summary, our results revealed specific fatty acids as potential biomarkers, with complicated regulatory mechanism in cardiovascular diseases that should be further explored. The tricarboxylic acid (TCA) cycle is central to the network of energy metabolism, as it promotes products of glycolysis, fatty acid oxidation and amino acid metabolism involvement in ATP synthesis. According to previous studies, an extensive reduction of tricarboxylic acid cycle intermediates in urine samples, including citrate, isocitrate, and oxalosuccinate was observed in acute MI rats.13 However, in our heart failure mice models, we did not find any obvious differences. A possible explanation is that the new metabolism energy balance was established 4 weeks post-surgery due to the compensatory mechanism that provided abundant substrates from glycolysis and amino acids metabolism. The release of arachidonic acid from the cellular membrane phospholipids initiates the biosynthesis of multiple inflammatory mediators, including prostaglandins and leukotrienes. Hence, changes in the levels of free arachidonic acid in circulation can potentially alter the production of inflammatory mediators. Our results further confirmed the pivotal role of inflammation in the development of heart failure, as the arachidonic acid level was significantly increased in the heart failure mice.
4.3. Lipid metabolism
In the present study, PCs were identified as the majority among the different metabolites. The altered phospholipids have repeatedly been found in a number of different pathological conditions including cancer, infection and diabetes. LPCs are released by the action of phospholipases A2 (PLA2s) on plasma membrane phosphatidylcholines resulting in an LPC and a free fatty acid. The free fatty acid, i.e. arachidonic acid, can be further metabolized into various prostaglandin-, thromboxane- and leukotriene-metabolites, which all participate in inflammatory responses. LPCs and the downstream metabolite lysophosphatidic acid (LPA) have been identified as equally important inflammatory mediators.29 For example, LPCs were shown to be potent attractors of monocytes30 and activators of macrophages.31 As LPCs get released from apoptotic tissue or immune cells such as neutrophils that are attracted to the site of insult or inflammation, they in turn attract and activate phagocytic cells.32 Thus, LPCs play a central role in initiating and maintaining the inflammatory response, which creates a rationale for postulating that LPC levels in serum will change with a plethora of pathological conditions that trigger inflammatory responses.
In addition to discovering novel biomarkers that could increase our understanding of CHF, the present study also provided a powerful tool for investing therapeutic effects and mechanisms of LCZ696. In addition to the improvement of cardiac function in model mice, LCZ696 significantly reversed the changes in all of the metabolic biomarkers found in model group. These results demonstrated that the therapeutic effects of LCZ696 in heart failure were partially due to the restoration of the disturbed pathways of amino acids, energy metabolism, lipid metabolism and inflammation. These findings provided a foundation for further investigation of the mechanisms and predominant pathways it influenced. In this study, we developed a metabonomics approach to explore the mechanisms in heart failure and to investigate the therapeutic effects and mechanisms of LCZ696 in models of heart failure. Multivariate statistical analysis revealed different metabolite profiles in heart tissues between the sham-operated, model group and LCZ696-treated group, indicating that LCZ696 had synergistically therapeutic benefits in heart failure. Based on multivariate and univariate statistical analyses, 43 metabolites were identified from heart tissue samples, and further confirmed by comparison with authentic standards. These markers showed significant shifts in amino acids, energy metabolism and inflammation in the heart failure mice, demonstrating potential therapeutic targets associated with CHF. To conclude, we believe this metabonomics approach could be useful for understanding the mechanisms and efficacy of LCZ696 in model mice, as well as for exploring the potential synergistic effects of medicines.
4.4. Limitations
In our experiment, we identified the potential heart failure biomarkers from heart tissue. These biological change markers are the cause or they are the consequence of a heart failure. In addition, we found a significant pathological features in heart tissue of mice with heart failure. We also found that these markers were reversed after the treatment with LCZ696, which confirmed that the biomarkers we identified were specific markers in heart failure. The analysis of mice heart tissues with the scope to establish the involvement of metabolic pathways affected by heart failure, revealed that LCZ696 may successfully treat the heart failure by regulating these metabolic pathways, which is a new understanding of the mechanism of action of this drug. Nevertheless, further studies are required to establish whether the metabolic changes induced by LCZ696 actually precede the therapeutic benefits of the drug in heart failure. Furthermore, some of the identified biomarkers may be tentative and require more detailed analysis. Lastly, in the present study we used HSS T3 column, which is not suitable for the separation of most polar small molecules, since they are eluted from the column almost simultaneously. It is advisable to use HILIC-based column and C18 column for the separation of both non-polar compounds and polar compounds.
Conflict of interest
The authors declare no competing financial interests.
Acknowledgements
This study was supported by the National Program on Key Basic Research Project of China (973 Program, No. 2014CBA02003), National Natural Science Foundation of China (Grant No. 81670318, 81570314, 81370322 and 81200146), Grant of Shanghai Science and Technology Committee (NO. 15XD1501100 and 124119a7700), Program for Outstanding Medical Academic Leader (No. 2015-Weijiwei-24), Grant of Shanghai municipal commission of health and family planning (Grant No. XBR2013071 and 20134001), Grant of Zhongshan hospital affiliated to Fudan University (No. 2015ZSYXGG07).
References
- A. S. Go, D. Mozaffarian, V. L. Roger, E. J. Benjamin, J. D. Berry, W. B. Borden, D. M. Bravata, S. Dai, E. S. Ford, C. S. Fox, S. Franco, H. J. Fullerton, C. Gillespie, S. M. Hailpern, J. A. Heit, V. J. Howard, M. D. Huffman, B. M. Kissela, S. J. Kittner, D. T. Lackland, J. H. Lichtman, L. D. Lisabeth, D. Magid, G. M. Marcus, A. Marelli, D. B. Matchar, D. K. McGuire, E. R. Mohler, C. S. Moy, M. E. Mussolino, G. Nichol, N. P. Paynter, P. J. Schreiner, P. D. Sorlie, J. Stein, T. N. Turan, S. S. Virani, N. D. Wong, D. Woo, M. B. Turner, C. American Heart Association Statistics and S. Stroke Statistics, Circulation, 2013, 127, e6–e245 CrossRef PubMed.
- K. Alagiakrishnan, M. Banach, L. G. Jones, A. Ahmed and W. S. Aronow, Drugs Aging, 2013, 30, 765–782 CAS.
- S. Fu, J. Zhang, F. Mennitiippolito, X. Gao, F. Galeotti, M. Massari, L. Hu, B. Zhang, R. Ferrelli and A. Fauci, PLoS One, 2011, 6, 708–711 Search PubMed.
- A. S. Maisel, P. Krishnaswamy, R. M. Nowak, J. Mccord, J. E. Hollander, P. Duc, T. Omland, A. B. Storrow, W. T. Abraham and A. H. Wu, N. Engl. J. Med., 2002, 347, 161–167 CrossRef CAS PubMed.
- R. E. Gerszten and T. J. Wang, Nature, 2008, 451, 949–952 CrossRef CAS PubMed.
- W. Doehner, M. Frenneaux and S. D. Anker, J. Am. Coll. Cardiol., 2014, 64, 1388–1400 CrossRef PubMed.
- O. Vardeny, D. K. Gupta, B. Claggett, S. Burke, A. Shah, L. Loehr, L. Rasmussen-Torvik, E. Selvin, P. P. Chang and D. Aguilar, Heart Failure, 2013, 1, 531–536 Search PubMed.
- T. B. Horwich and G. C. Fonarow, J. Am. Coll. Cardiol., 2010, 55, 283–293 CrossRef CAS PubMed.
- J. McMurray, M. Packer, A. Desai, J. Gong, N. Greenlaw, M. Lefkowitz, A. Rizkala, V. Shi, J. Rouleau, S. Solomon, K. Swedberg, M. R. Zile, K. Andersen, J. L. Arango, M. Arnold, J. Belohlavek, M. Bohm, S. Boytsov, L. Burgess, W. Cabrera, C. H. Chen, A. Erglis, M. Fu, E. Gomez, A. Gonzalez, A. A. Hagege, T. Katova, S. Kiatchoosakun, K. S. Kim, E. Bayram, F. Martinez, B. Merkely, I. Mendoza, A. Mosterd, M. Negrusz-Kawecka, K. Peuhkurinen, F. Ramires, J. Refsgaard, M. Senni, A. S. Sibulo Jr, J. Silva-Cardoso, I. Squire, R. C. Starling, D. Vinereanu, J. R. Teerlink, R. Wong and P.-H. Committees and Investigators, Eur. Heart J., 2015, 36, 434–439 CrossRef PubMed.
- W. B. Dunn, Trends Biotechnol., 2004, 22, 245–252 CrossRef PubMed.
- J. L. Griffin, H. Atherton, J. Shockcor and L. Atzori, Nat. Rev. Cardiol., 2011, 8, 630–643 CrossRef CAS PubMed.
- G. Mercuro, P. P. Bassareo, M. Deidda, C. Cadeddu, L. Barberini and L. Atzori, J. Cardiovasc. Med., 2011, 12, 800–805 CrossRef PubMed.
- Z. Du, A. Shen, Y. Huang, L. Su, W. Lai, P. Wang, Z. Xie, Z. Xie, Q. Zeng, H. Ren and D. Xu, PLoS One, 2014, 9, e88102 Search PubMed.
- L. Tenori, X. Hu, P. Pantaleo, B. Alterini, G. Castelli, I. Olivotto, I. Bertini, C. Luchinat and G. F. Gensini, Int. J. Cardiol., 2013, 168, 113–115 CrossRef PubMed.
- M. L. Cheng, C. H. Wang, M. S. Shiao, M. H. Liu, Y. Y. Huang, C. Y. Huang, C. T. Mao, J. F. Lin, H. Y. Ho and N. I. Yang, J. Am. Coll. Cardiol., 2015, 65, 1509–1520 CrossRef CAS PubMed.
- E. Gao and W. J. Koch, Methods Mol. Biol., 2013, 1037, 299–311 Search PubMed.
- T. G. von Lueder, B. H. Wang, A. R. Kompa, L. Huang, R. Webb, P. Jordaan, D. Atar and H. Krum, Circ.: Heart Failure, 2015, 8, 71–78 CrossRef CAS PubMed.
- X. Wang, Y. Ye, H. Gong, J. Wu, J. Yuan, S. Wang, P. Yin, Z. Ding, L. Kang, Q. Jiang, W. Zhang, Y. Li, J. Ge and Y. Zou, J. Mol. Cell. Cardiol., 2016, 97, 180–190 CrossRef CAS PubMed.
- T. J. Wang, M. G. Larson, R. S. Vasan, S. Cheng, E. P. Rhee, E. McCabe, G. D. Lewis, C. S. Fox, P. F. Jacques, C. Fernandez, C. J. O'Donnell, S. A. Carr, V. K. Mootha, J. C. Florez, A. Souza, O. Melander, C. B. Clish and R. E. Gerszten, Nat. Med., 2011, 17, 448–453 CrossRef CAS PubMed.
- S. Cheng, E. P. Rhee, M. G. Larson, G. D. Lewis, E. L. McCabe, D. Shen, M. J. Palma, L. D. Roberts, A. Dejam, A. L. Souza, A. A. Deik, M. Magnusson, C. S. Fox, C. J. O'Donnell, R. S. Vasan, O. Melander, C. B. Clish, R. E. Gerszten and T. J. Wang, Circulation, 2012, 125, 2222–2231 CrossRef CAS PubMed.
- S. H. Shah, J. R. Bain, M. J. Muehlbauer, R. D. Stevens, D. R. Crosslin, C. Haynes, J. Dungan, L. K. Newby, E. R. Hauser, G. S. Ginsburg, C. B. Newgard and W. E. Kraus, Circ.: Cardiovasc. Genet., 2010, 3, 207–214 CrossRef CAS PubMed.
- S. H. Shah, W. E. Kraus and C. B. Newgard, Circulation, 2012, 126, 1110–1120 CrossRef PubMed.
- X. Wang, M. Su, Y. Qiu, Y. Ni, T. Zhao, M. Zhou, A. Zhao, S. Yang, L. Zhao and W. Jia, J. Proteome Res., 2007, 6, 3449–3455 CrossRef CAS PubMed.
- G. D. Lopaschuk, J. R. Ussher, C. D. Folmes, J. S. Jaswal and W. C. Stanley, Physiol. Rev., 2010, 90, 207–258 CrossRef CAS PubMed.
- J. C. Chatham and J. R. Forder, J. Mol. Cell. Cardiol., 1993, 25, 1203–1213 CrossRef CAS PubMed.
- P. J. Randle, Diabetes/Metab. Rev., 1998, 14, 263–283 CrossRef CAS PubMed.
- V. Lionetti, W. C. Stanley and F. A. Recchia, Cardiovasc. Res., 2011, 90, 202–209 CrossRef CAS PubMed.
- G. D. Lopaschuk, J. R. Ussher, C. D. L. Folmes, J. S. Jaswal and W. C. Stanley, Physiol. Rev., 2010, 90, 207–258 CrossRef CAS PubMed.
- I. Sevastou, E. Kaffe, M. A. Mouratis and V. Aidinis, Biochim. Biophys. Acta, 2013, 1831, 42–60 CrossRef CAS PubMed.
- M. T. Quinn, S. Parthasarathy and D. Steinberg, Proc. Natl. Acad. Sci. U. S. A., 1988, 85, 2805–2809 CrossRef CAS.
- S. S. Ousman and S. David, Glia, 2000, 30, 92–104 CrossRef CAS PubMed.
- O. Soehnlein, L. Lindbom and C. Weber, Blood, 2009, 114, 4613–4623 CrossRef CAS PubMed.
Footnotes |
| † Electronic supplementary information (ESI) available. See DOI: 10.1039/c7ra01404j |
| ‡ Yan Xia and Zhangwei Chen contributed equally to the article. |
|
| This journal is © The Royal Society of Chemistry 2017 |
Click here to see how this site uses Cookies. View our privacy policy here. 
 Open Access Article
 This Open Access Article is licensed under a Creative Commons Attribution-Non Commercial 3.0 Unported Licence
 * and
Junbo Ge*
* and
Junbo Ge*