H2O2 evolution during the photocatalytic degradation of organic molecules on fluorinated TiO2
Marta Mrowetz and Elena Selli*
Dipartimento di Chimica Fisica ed Elettrochimica, Università degli Studi di Milano, Via Golgi 19, I-20133 Milan, Italy. E-mail: elena.selli@unimi.it; Fax: +39 02 50314300; Tel: +39 02 50314237
First published on 24th November 2005
Abstract
The effect of TiO2 surface fluorination on the hydrogen peroxide evolution occurring in photocatalytic runs was investigated employing the azo dye Acid Red 1 (AR1) and two model organic molecules with acidic properties, i.e. formic acid (FA) and benzoic acid (BA), as substrates of oxidative degradation. While AR1 and BA photocatalytic degradation on fluorinated titanium dioxide (F–TiO2) was markedly faster than on unmodified TiO2, because of enhanced hydroxyl radical formation, H2O2 concentration during the photodegradation of both substrates on F–TiO2 was lower, possibly because of the reduced rate of interfacial electron transfer. By contrast, FA underwent slower photocatalytic degradation on F–TiO2, but, at the same time, hydrogen peroxide concentration was relatively high, while no H2O2 could be detected during FA photodegradation on unmodified TiO2. Photocatalytic runs in the presence of the nitrate anion, able to react with the CO2˙− species produced from FA oxidation, but not with conduction band electrons, demonstrated that CO2˙− plays a relevant role in H2O2 formation during FA degradation on F–TiO2. In fact, surface fluoride, having a shielding effect at the semiconductor–water interface, not only inhibits the photocatalytic decomposition of H2O2, but also favours CO2˙− desorption and reaction with dissolved O2, generating H2O2. By contrast, CO2˙− mainly gives electron transfer to the conduction band of naked TiO2 and surface reduction of the photocatalytically produced H2O2.
Introduction
The electron transfer paths occurring at a water–semiconductor interface during photocatalytic processes1,2 undergo strong modification upon titanium dioxide surface fluorination.3–5 Indeed, the formation of![[triple bond, length as m-dash]](https://www.rsc.org/images/entities/char_e002.gif) Ti–F species,6 which dominate at acidic pH, decreases the amount of surface hydroxyl groups, up to their almost complete displacement at pH 3.5–4.0.7 Significant variations of the semiconductor oxide photocatalytic behaviour have consequently been observed.8–15
Ti–F species,6 which dominate at acidic pH, decreases the amount of surface hydroxyl groups, up to their almost complete displacement at pH 3.5–4.0.7 Significant variations of the semiconductor oxide photocatalytic behaviour have consequently been observed.8–15An increase in the photocatalytic degradation of phenol on fluorinated titanium dioxide (F–TiO2) led to the hypothesis that an ˙OH radical mediated mechanism involving the homogeneous aqueous phase is almost exclusively responsible for the oxidation of this substrate in F–TiO2 systems.8,9 By contrast, hole transfer mediated oxidations are expected to be largely inhibited because of the hindered adsorption of substrates on F–TiO2. At the same time, surface –F groups, because of the strong electronegativity of the fluorine atom, seem to act as electron-trapping sites, reducing the interfacial electron transfer rates of conduction band electrons.13 Spin-trapping EPR measurements provided direct experimental evidence that a ca. ten-fold higher concentration of hydroxyl radicals is generated on fluorinated titanium dioxide under irradiation, demonstrating that on F–TiO2 organic molecules mainly undergo photodegradation via ˙OH radical attack.15
To have a deeper insight into the effects of surface fluorination on the electron transfer processes at the semiconductor–water interface under irradiation, we focused our attention on the main reductive counter reaction of most photocatalytic reactions proceeding oxidatively, i.e. hydrogen peroxide evolution. A preliminary note reporting a sustained production of H2O2 on irradiated TiO2–fluoride systems appeared very recently.16 In the present study H2O2 evolution was monitored during the photocatalytic degradation of the azo dye Acid Red 1 (AR1, see Scheme 1), in the presence of naked or fluorinated titanium dioxide. This dye bears two sulfonic groups, capable of strong electrostatic interactions with the unmodified oxide surface.17 One of the first steps in its photocatalytic degradation is the cleavage of the azo bond, responsible for its bleaching in the visible region.18 The photocatalytic behaviour of this rather complex aromatic molecule on F–TiO2 and the simultaneous H2O2 evolution were compared to those of benzoic acid (BA), chosen as a moderately acidic model aromatic molecule, and of formic acid (FA), chosen as a model aliphatic acidic compound undergoing direct mineralisation to CO2 and H2O.19,20
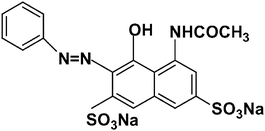 | ||
| Scheme 1 Molecular structure of the azo dye Acid Red 1 (AR1). | ||
The origin of the peculiarly outstanding amount of H2O2 evolved during FA photocatalytic degradation on F–TiO2 was clarified by investigating the effects of the addition of the nitrate anion, which evidenced the central role of the CO2˙− species, formed by photoinduced FA oxidation on the photocatalyst surface.
Experimental
Materials
Acid Red 1 (AR1), purchased from Aldrich, was purified by repeated crystallisation from methanol. Its purity from organic contaminants was verified by NMR analysis. Degussa P25 titanium dioxide (mainly anatase) was employed as photocatalyst. Formic acid (FA, purity 95–97%), benzoic acid (BA, purity >99.5%), 2-propanol (purity 99.5%), KNO3 (purity 99.5%) and NaF (purity 99.99%) were purchased from Aldrich and employed as received. Water purified by a Milli-Q water system (Millipore) was used throughout.Apparatus
All degradation runs were carried out at (35 ± 1) °C under atmospheric conditions in a magnetically stirred 400 mL cylindrical Pyrex reactor, employing an experimental set up similar to that already described.21 Illumination was performed through the reactor Pyrex walls by means of a 250 W iron alogenide lamp (Jelosil, model HG 200), emitting in the 315–400 nm wavelength range, with a mean emission intensity on the reactor of 3.5 × 10⁻⁴ einstein L−1 s−1, as periodically checked by ferrioxalate actinometry.22Procedures
The irradiated aqueous suspensions contained 0.1 g L−1 of TiO2; the initial concentration (C0) of the substrates was 2.5 × 10⁻⁵ M for AR1, 1.0 × 10⁻⁴ M for BA and 5.0 × 10⁻⁴ M for FA. Titanium dioxide fluorination was achieved by adding 0.01 M NaF, corresponding to 0.1 mol of F− per gram of TiO2. Fluoride ions, able to very quickly displace the –OH groups on the surface of titanium dioxide, were added to the suspensions immediately before starting irradiation, to minimise the coagulation of the photocatalyst.8,10 When investigating the effect of nitrate addition, the KNO3 concentration was 0.05 M, high enough to guarantee a quantitative scavenging of the carbon dioxide radical anion.23The pH was monitored during the runs by means of an Amel Instruments 334-B pH-meter. A decrease in pH was observed during AR1 photocatalytic degradation under natural pH conditions, from an initial value of 5.8 to a final value of ca. 4.4, as a consequence of the production of stable acids, due to the fast removal of sulfonic groups and the oxidation of the azo double bond.24 Thus, to guarantee an efficient adsorption of fluoride anions on the surface of the oxide, during AR1 photodegradation the pH was lowered to 3.7 by adding small amounts of HClO4, which is known to have negligible influence on the photocatalytic activity, because of the low affinity of ClO4− anions for TiO2 and their low reactivity towards hydroxyl radicals.25 No pH change was noticed during the runs under such conditions. By contrast, the pH value of suspensions containing formic acid and benzoic acid increased during the runs, from 3.5 to 5.8 and from 4.2 to ca. 6.0, respectively, as a direct consequence of the mineralisation of the acids to CO2 and H2O.26 With these acidic substrates, the runs were performed under so-called natural pH conditions, corresponding to the range of maximum fluoride adsorption on TiO2, i.e. no buffer was added to the suspensions, to avoid possible interference of other species (mainly anions) on the photoredox processes at the TiO2–water interface.
2-mL samples were periodically withdrawn from the reactor and analysed, after removal of TiO2 particles by centrifugation at 3000 rpm for 30 min, employing an ALC 4225 centrifuge.21 The cleavage of the azo bond of AR1, leading to its bleaching (also mentioned as AR1 degradation), was monitored by spectrophotometric analysis at 531 nm (maximum AR1 absorption, ε = [3.13 ± 0.02] × 104 M−1 cm−1) by means of a Perkin Elmer Lambda 16 spectrophotometer.21 BA concentration during the runs was detected by HPLC analysis, employing an Agilent 1100 Series apparatus, equipped with a μBondapack-C18 column and a UV-Vis detector. An acetonitrile∶water 60∶40 mobile phase was used for BA analysis,27 flowing at 1.0 mL min−1. FA concentration changes were detected using a total organic carbon (TOC) analyser in the not purgeable organic carbon (NPOC) mode (Shimadzu Instruments, TOC-5000A). All runs were repeated at least twice to check their reproducibility.
Hydrogen peroxide concentration was monitored during the photodegradation runs by fluorimetric analysis (λex = 316.5 nm, λem = 408.5 nm) of the fluorescent dimer formed in the horseradish peroxidase-catalysed reaction of hydrogen peroxide with p-hydroxyphenylacetic acid,28,29 using a 605-10S Perkin Elmer fluorescence spectrophotometer. H2O2 standard solutions employed in calibration were analysed iodometrically. The H2O2 concentration profiles obtained during BA photocatalytic degradation were corrected for the relatively small fluorescence signal originating from salicylic acid, one of the first degradation intermediates of BA. The signal was measured in blank photocatalytic runs under conditions identical to those employed in H2O2 analysis, but with no p-hydroxyphenylacetic acid and enzyme addition.
Adsorption studies were performed both in the presence and in the absence of 0.01 M NaF, on suspensions containing 1.0 g L−1 of TiO2 and 2.5 × 10⁻⁵ M AR1, 1.0 × 10⁻⁴ M BA or 5.0 × 10⁻⁴ M FA. After continuous stirring for 24 h in the dark at 35 °C, the photocatalyst was removed and the liquid phase was analysed for AR1, BA or FA residual content. The F−/TiO2 ratio employed in the adsorption experiments, lower with respect to that of the photocatalytic degradation runs, guaranteed a similar displacement of surface –OH groups, the maximum value of adsorbed fluoride being 2.5 × 10⁻⁴ mol g−1 of TiO2.30
The reduction potentials of AR1, BA and FA were determined by cyclic voltammetry measurement using a glassy carbon working electrode vs. Ag/AgCl in 0.1 M HClO4 for AR131 or 0.5 M NaClO4 for BA and FA solutions, with a scan speed of 50 mV s−1.
Results and discussion
Adsorption and photocatalytic degradation of the organic substrates
Preliminary adsorption studies evidenced that, while AR1 and BA are detectably adsorbed on the unmodified TiO2 surface, their adsorption is almost completely inhibited on F-modified TiO2. In fact, the adsorbed fraction on naked titanium dioxide at natural pH was 0.27 for AR1 and 0.30 for BA, but below our detection limit (adsorbed fraction ca. 0.001) on the fluorinated oxide. Similar results were obtained for the adsorption of the azo dye Acid Orange 7 on TiO2 and on F–TiO2.13 Thus, the displacement of –OH groups with the formation of stable![[triple bond, length as m-dash]](https://www.rsc.org/images/entities/char_e002.gif) Ti–F species and the consequent negative surface charge13 induce significant alterations of the adsorption equilibria at the water–TiO2 interface. On the other hand, under the adopted conditions FA adsorption could not be detected on both unmodified and F-modified TiO2. FA adsorption on naked titanium dioxide has been recently measured in the presence of higher oxide amounts.32 Also the adsorption of molecular oxygen is expected to undergo deep modification upon TiO2 fluorination, with great consequences on the rates of conduction band electron scavenging by O2.8,33
Ti–F species and the consequent negative surface charge13 induce significant alterations of the adsorption equilibria at the water–TiO2 interface. On the other hand, under the adopted conditions FA adsorption could not be detected on both unmodified and F-modified TiO2. FA adsorption on naked titanium dioxide has been recently measured in the presence of higher oxide amounts.32 Also the adsorption of molecular oxygen is expected to undergo deep modification upon TiO2 fluorination, with great consequences on the rates of conduction band electron scavenging by O2.8,33Upon TiO2 fluorination, AR1 photocatalytic degradation at pH 3.7, i.e. under conditions of maximum F− adsorption on the oxide surface, was found to proceed at a more than double rate,15 as shown by the first-order rate constants reported in Table 1.
| Substrate | TiO2 | F–TiO2 |
|---|---|---|
| AR1 | (3.2 ± 0.4) × 10−4 s−1 | (7.34 ± 0.15) × 10−4 s−1 |
| BA | (4.65 ± 0.11) × 10−4 s−1 | (7.84 ± 0.16) × 10−4 s−1 |
| FA | (1.83 ± 0.05) × 10−7 M s−1 | (1.58 ± 0.04) × 10−7 M s−1 |
BA exhibits a behaviour similar to that of AR1, i.e. it underwent faster reaction on fluorinated TiO2. The pseudo first-order rate constants for BA degradation on TiO2 and F–TiO2, reported in Table 1, also for this substrate demonstrate an almost double photodegradation rate upon fluoride addition under the conditions of the present study. Higher increases in rate have been very recently reported for higher initial BA concentrations.34
FA was found to undergo photodegradation according to a zero order rate law on both unmodified and F-modified TiO2. However, as evidenced by the rate constants reported in Table 1, formic acid exhibits an opposite behaviour compared to AR1 and BA, its photocatalytic degradation on F-modified TiO2 being slower than on naked TiO2.
At neutral pH, F− ions displace basic –OH groups (estimated around 0.14 mmol g−1), with an equilibrium constant35 equal to 8 × 10⁻⁷; at lower pH even acidic –OH groups are substituted by –F atoms.6 This induces a relevant change in the adsorption properties on the photocatalyst surface, especially for acidic molecules strongly interacting with basic sites,9 as is the case for our substrates. Moreover, the displacement of hydroxyl groups implies the absence of an effective trap for photogenerated valence band holes as ![[triple bond, length as m-dash]](https://www.rsc.org/images/entities/char_e002.gif) TiO˙ species, formed through reaction (1). In fact, –F species are stable and cannot be oxidised by valence band holes hvb+ even in acidic media. Indeed, the potential of the F˙/F− couple in homogeneous aqueous phase is 3.6 V,36 while the valence band energy is E0vb(V) = 3.00 − 0.059 pH vs. NHE.23 Thus, valence band holes photoproduced in F–TiO2 directly react with water molecules at the interface, producing ˙OH radicals according to reaction (2).
TiO˙ species, formed through reaction (1). In fact, –F species are stable and cannot be oxidised by valence band holes hvb+ even in acidic media. Indeed, the potential of the F˙/F− couple in homogeneous aqueous phase is 3.6 V,36 while the valence band energy is E0vb(V) = 3.00 − 0.059 pH vs. NHE.23 Thus, valence band holes photoproduced in F–TiO2 directly react with water molecules at the interface, producing ˙OH radicals according to reaction (2).
![[triple bond, length as m-dash]](https://www.rsc.org/images/entities/char_e002.gif) Ti–OH +
hvb+
→ Ti–OH +
hvb+
→
![[triple bond, length as m-dash]](https://www.rsc.org/images/entities/char_e002.gif) Ti–O˙
+ H+ Ti–O˙
+ H+ | (1) |
![[triple bond, length as m-dash]](https://www.rsc.org/images/entities/char_e002.gif) Ti–F +
hvb+
+ H2O → Ti–F +
hvb+
+ H2O →
![[triple bond, length as m-dash]](https://www.rsc.org/images/entities/char_e002.gif) Ti–F +
˙OH + H+ Ti–F +
˙OH + H+ | (2) |
Thus, all ˙OH radical mediated paths are favoured in F–TiO2 suspensions and substrates that easily undergo ˙OH radical attack are more rapidly degraded. This is the case for AR1 and BA, the second-order rate constants for hydroxyl radical attack having been reported to be k = 4.3 × 10⁹ M−1 s−1 for BA and k = 1.7 × 10¹⁰ M−1 s−1 for an azo dye similar to AR1.38 On the other hand, substrates, such as FA, having a relatively lower second-order rate constant for hydroxyl attack (k = 1.3 × 10⁸ M−1 s−1),38 whose degradation is preferably initiated by direct hole transfer, upon TiO2 fluorination undergo slower photocatalytic degradation because of their hindered adsorption (or complexation) on the F–TiO2 surface.13
Moreover, the presence of aromatic rings in AR1 and BA can also play a role in the observed increase of photocatalytic activity of F–TiO2. In fact, the radical or cationic species formed upon reaction of aromatic rings with ˙OH radicals or with valence band holes are relatively long-lived, being highly stabilised by resonance. Thus, they have a high probability to back react with conduction band electrons, giving no net change and enhanced recombination.39 The lower adsorption of AR1 and BA on F–TiO2 can inhibit the detrimental back reaction with conduction band electrons, with a consequent increase of the overall degradation rate.
Hydrogen peroxide evolution during photocatalytic degradation
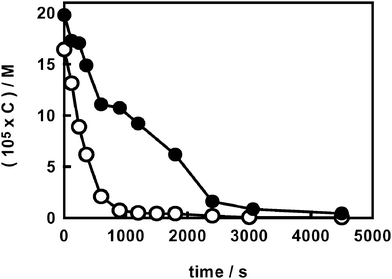
Hydrogen peroxide, a key intermediate in photocatalytic processes, was demonstrated to form on TiO2 exclusively via reduction of molecular oxygen by conduction band electrons.40Fig. 1 shows the concentration profile of H2O2 evolved during AR1 photodegradation on naked TiO2 and on F–TiO2 at pH 3.7. A lower H2O2 amount accumulated on fluorinated TiO2 and its formation was retarded, with respect to naked TiO2, so that it could hardly be detected on F–TiO2 during the first 30 min of irradiation. Moreover, H2O2 concentration always remained below 4 × 10⁻⁵ M during AR1 photocatalytic degradation on F–TiO2, i.e. lower than one third of the maximum concentration attained in the absence of fluoride.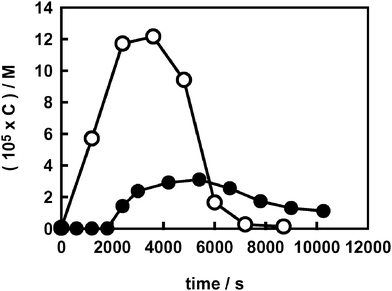 | ||
| Fig. 1 Hydrogen peroxide evolution during AR1 photodegradation (C0 = 2.5 × 10⁻⁵ M) on naked (○) and on fluorinated TiO2 at pH 3.7 (●). | ||
Based on these results, AR1 photocatalytic degradation on fluorinated TiO2 may appear in competition with molecular oxygen reduction by conduction band electrons. This would be compatible with our cyclic voltammetry measurements on AR1, yielding an AR1 reduction potential value of −0.33 V (NHE), and with a reported41 shift of the band edge potentials of TiO2 towards more negative values upon addition of a fluoride salt in acetonitrile. Thus, electron transfer from the conduction band to AR1 is in principle allowed on unmodified TiO2 [E0cb(V) = −0.13 − 0.059 pH vs. NHE]42 and even thermodynamically more favourable on the F-modified oxide, under the hypothesis of the above mentioned negative band shift.41 Therefore, besides through hydroxyl radical attack or reaction with photogenerated holes, the azo group of AR1, which ensures extensive conjugation between its two aromatic moieties and hence its capability of absorbing light in the visible, might also undergo degradation through a reductive pathway,43 directly or indirectly involving conduction band electrons.
Moreover, the higher H2O2 amount observed during AR1 photocatalytic degradation on naked TiO2 (Fig. 1) might simply be a consequence of a relatively higher H2O2 production occurring through a dye sensitised path.44 Indeed, AR1 is able to absorb a fraction of the incident radiation and electron transfer from the electronically excited state of AR1 to the semiconductor conduction band is expected to be favoured by the higher adsorption of AR1 on TiO2 with respect to F–TiO2.
However, ![[triple bond, length as m-dash]](https://www.rsc.org/images/entities/char_e002.gif) Ti–F groups on the oxide surface have been recently shown to act as electron-trapping sites, decreasing interfacial electron transfer rates by tightly holding trapped electrons, due to the strong electronegativity of fluorine.13 Thus, the slower formation of hydrogen peroxide in fluorinated systems might well be just the direct consequence of this effect.
Ti–F groups on the oxide surface have been recently shown to act as electron-trapping sites, decreasing interfacial electron transfer rates by tightly holding trapped electrons, due to the strong electronegativity of fluorine.13 Thus, the slower formation of hydrogen peroxide in fluorinated systems might well be just the direct consequence of this effect.
Hydrogen peroxide evolution during BA photodegradation clarifies this point; in fact, for BA a reductive path is thermodynamically impossible, because its reduction potential, measured by cyclic voltammetry, is −1.22 V (NHE). The H2O2 concentration profiles obtained during BA photodegradation in the presence and in the absence of fluoride (Fig. 2) appear very similar to those obtained during the degradation of the azo dye (Fig. 1). This points to a decreased rate of interfacial electron transfer in the presence of surface fluoride as the main reason for the lower H2O2 evolution and also excludes any relevant role of AR1 photocatalytic reduction and of a dye sensitised path for H2O2 production, which are not possible for BA.
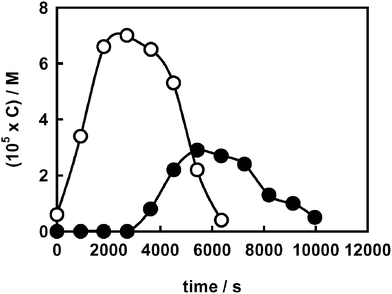 | ||
| Fig. 2 Hydrogen peroxide evolution during BA photodegradation (C0 = 1.0 × 10⁻⁴ M) on naked (○) and on fluorinated TiO2 (●). | ||
The reactivity of the superoxide radical anion towards aromatic radical species may be invoked to account for the shape of the H2O2 concentration profiles obtained during AR1 and BA photocatalytic degradation on F–TiO2 (Fig. 1 and 2). In fact, this species and its protonated form, the perhydroxyl radical HO2˙ , are precursors of H2O2 and may easily attack aromatic radical species.45 On fluorinated titania the active species, i.e. the radicals generated by both reduction and oxidation surface reactions, do not reside on the surface. This makes their reactions in the homogeneous phase more competitive, compared to further direct electron transfer at the water–semiconductor interface. As a result, the reactions between aromatic molecules, such as AR1 and BA, and the superoxide radical anion are expected to be enhanced on F–TiO2, with the consequent faster degradation of both substrates and the lower production of hydrogen peroxide, as long as the aromatic moieties are present.
The evolution profiles of H2O2 during FA photodegradation, both in the absence and in the presence of fluoride, are shown in Fig. 3. No hydrogen peroxide could be detected on naked TiO2; in fact, H2O2 undergoes extremely fast decomposition on the “clean” surface of titania during formic acid photodegradation, having a high affinity for the oxide surface and being able to complex Ti(IV) ions at the interface.16,46 By contrast, H2O2 could be easily detected on F–TiO2. Its concentration increased from the beginning of the run, up to values even higher than those attained during AR1 and BA photodegradation, and started to decline after almost complete FA degradation, i.e. when all species able to scavenge the photogenerated valence band holes had been consumed. After this time, the electron–hole fast recombination would make less conduction band electrons available for O2 reduction.
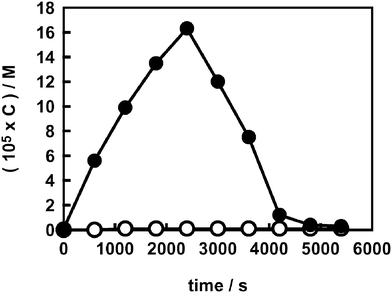 | ||
| Fig. 3 Hydrogen peroxide evolution during FA photodegradation (C0 = 5.0 × 10⁻⁴ M) on naked (○) and on fluorinated TiO2 (●). | ||
Fluoride anions adsorbed on the TiO2 surface clearly have a shielding effect on the quite fast photodegradation of hydrogen peroxide occurring at the water–semiconductor interface. In fact, adsorbed F− ions inhibit the formation of surface peroxides (![[triple bond, length as m-dash]](https://www.rsc.org/images/entities/char_e002.gif) TiIV–OOH),8 a preliminary key step for their subsequent degradation by photogenerated species according to eqn (3) and (4):40
TiIV–OOH),8 a preliminary key step for their subsequent degradation by photogenerated species according to eqn (3) and (4):40
| H2O2 + 2ecb− + 2H+ → 2H2O | (3) |
| H2O2 + 2hvb+ → O2 + 2H+ | (4) |
 | ||
| Fig. 4 Photocatalytic degradation of hydrogen peroxide (C0 ∼ 2 × 10⁻⁴ M) at 35 °C at pH 3.7 on naked (○) and on fluorinated TiO2 (●). | ||
The addition of a rather high concentration of FA (2 × 10⁻³ M) during AR1 photodegradation on both naked and fluorinated titanium dioxide also confirmed this effect. As shown by the H2O2 concentration profiles reported in Fig. 5, FA addition first of all caused an increase of H2O2 concentration: molecular oxygen reduction, yielding hydrogen peroxide, is promoted by a higher availability of conduction band electrons, as a consequence of a reduced recombination rate with photogenerated holes. This occurs when valence band holes can directly or indirectly react with compounds, such as FA, acting as scavengers of photoproduced oxidant species. Therefore, the results in Fig. 5 indicate that H2O2 also forms on F–TiO2 (as it forms on TiO2) via O2 reduction by conduction band electrons. Moreover, in the presence of FA, H2O2 concentration continuously increased on F–TiO2, mainly thanks to the shielding effect of surface fluorides. By contrast, on naked TiO2 rather high amounts of H2O2 were present only as long as AR1 acted as a shield on the TiO2 surface, hindering the formation of photoactive peroxo complexes.
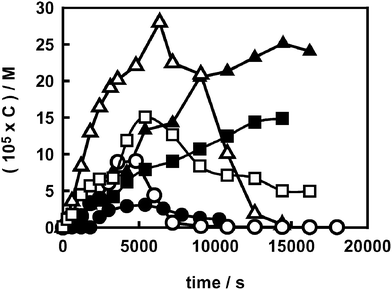 | ||
| Fig. 5 Hydrogen peroxide evolution during AR1 photodegradation at pH 3.7 on TiO2 (open symbols) and on F–TiO2 (full symbols) in the absence of scavengers (circles) and in the presence of 2 × 10⁻³ M formic acid (triangles) or 2-propanol (squares). | ||
Similar results were obtained when 2-propanol (2 × 10⁻³ M), a well known oxidisable scavenger with relatively low affinity for the TiO2 surface, was added during AR1 photodegradation (Fig. 5). The behaviour of the two scavenger systems is qualitatively similar, though a lower concentration of H2O2 was observed when 2-propanol, instead of FA, was added to the suspensions containing either naked or fluorinated TiO2.
The main peculiarity of FA consists in the fact that a strongly reductant species, i.e. CO2˙− or HCO2˙ depending on pH, with a pKa of 1.4, forms in its photocatalytic oxidation on TiO2 particles,47 originating the so-called current doubling effect.48 In fact, its redox potential, i.e. E0(CO2/˙CO2−) = −1.8 V,23 makes the carbon dioxide radical anion able to inject an electron into the conduction band of titanium dioxide, see reaction (5), and also to mediate the reduction of a wide variety of molecules, in particular dissolved O2, according to reaction (6):
| CO2˙− → CO2 + ecb− | (5) |
| CO2˙− + O2 → CO2 + O2˙− | (6) |
| NO3− + CO2˙− → NO32− + CO2 | (7) |
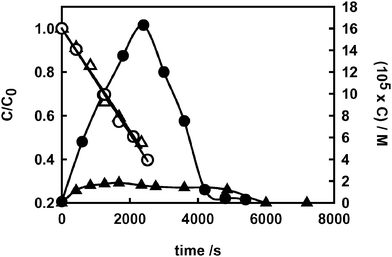 | ||
| Fig. 6 Photocatalytic degradation of formic acid (open symbols, left axis) and hydrogen peroxide evolution (full symbols, right axis) on F–TiO2 in the absence of nitrate (circles) and in the presence of 0.05 M nitrate (triangles). | ||
This conclusion was checked using BA as a photodegradation substrate on TiO2. The H2O2 concentration profiles in the presence and in the absence of nitrate were very similar, attaining a 7 × 10⁻⁵ M maximum concentration in both cases. Thus, when the radical species produced by substrate oxidation does not have reductive properties, the nitrate anion has no influence on hydrogen peroxide production, which proceeds in this case only through direct dioxygen reduction by conduction band electrons.
The crucial role of the CO2˙− radical in hydrogen peroxide formation during FA photodegradation can be appreciated only on F–TiO2, because on naked TiO2 this highly reactive species is adsorbed at the semiconductor–water interface and rapidly further oxidised to CO2 according to reaction (5). Moreover, this radical may also react with the photocatalytically formed hydrogen peroxide, also adsorbed on the TiO2 surface:
| H2O2 + CO2˙− → ˙OH + OH− + CO2 | (8) |
Finally, the difference in H2O2 concentration observed on both TiO2 and F–TiO2 in the presence of FA compared to 2-propanol (Fig. 5) indicates that a radical with reductive properties is generated also by the one electron oxidation of 2-propanol. Such a species is able to produce H2O2 through reactions analogous to (5) and (6), though its lower redox potential23 makes it less powerful in reducing molecular oxygen.
Conclusions
Surface TiO2 fluorination inhibits H2O2 evolution during the photocatalytic degradation of the aromatic substrates AR1 and BA, mainly because of the reduced rate of interfacial electron transfer through the fluorinated surface. By contrast, H2O2 production is sustained during FA photocatalytic degradation on F–TiO2: surface fluoride, having a shielding effect at the interface, inhibits the photocatalytic decomposition of H2O2 and favours the desorption of the CO2˙− radical anion produced from FA, thus favouring its reaction with dissolved O2, to yield H2O2. No H2O2 evolution can be observed during FA photocatalytic degradation on naked TiO2, because CO2˙− preferentially gives electron transfer to the conduction band, originating the current doubling effect, and also surface reduction of the photocatalytically produced H2O2.References
- D. W. Bahnemann, J. Cunningham, M. A. Fox, E. Pelizzetti, P. Pichat and N. Serpone, in Aquatic and Surface Photochemistry, ed. G. R. Helz, R. G. Zepp and D. G. Crosby, Lewis Publisher, Boca Raton, FL, 1994, p. 261 Search PubMed.
- M. R. Hoffmann, S. T. Martin, W. Choi and D. W. Bahnemann, Chem. Rev., 1995, 95, 69 CrossRef CAS.
- C. Chen, X. Li, W. Ma, J. Zhao, H. Hidaka and N. Serpone, J. Phys. Chem. B, 2002, 106, 318 CrossRef CAS.
- W. Choi, A. Termin and M. R. Hoffmann, J. Phys. Chem., 1994, 98, 13669 CrossRef.
- S. Ikeda, N. Sugiyama, B. Pal, G. Marcí, L. Palmisano, H. Noguchi, K. Uosaki and B. Ohtani, Phys. Chem. Chem. Phys., 2001, 3, 267 RSC.
- M. Herrmann, U. Kaluza and H. P. Boehm, Z. Anorg. Allg. Chem., 1970, 372, 308.
- J. Sanchez and J. Augustynski, J. Electroanal. Chem., 1979, 103, 423 CrossRef CAS.
- C. Minero, G. Mariella, V. Maurino and E. Pelizzetti, Langmuir, 2000, 16, 2632 CrossRef CAS.
- C. Minero, G. Mariella, V. Maurino, D. Vione and E. Pelizzetti, Langmuir, 2000, 16, 8964 CrossRef CAS.
- M. S. Vohra, S. Kim and W. Choi, J. Photochem. Photobiol., A, 2003, 160, 55 CrossRef CAS.
- M. Lewandowski and D. F. Ollis, J. Catal., 2003, 217, 38 CAS.
- K. Chiang, R. Amal and T. Tran, J. Mol. Catal. A: Chem., 2003, 193, 285 CrossRef CAS.
- H. Park and W. Choi, J. Phys. Chem. B, 2004, 108, 4086 CrossRef CAS.
- Y. C. Oh and W. S. Jenks, J. Photochem. Photobiol., A, 2004, 162, 323 CrossRef CAS.
- M. Mrowetz and E. Selli, Phys. Chem. Chem. Phys., 2005, 7, 1100 RSC.
- V. Maurino, C. Minero, G. Mariella and E. Pelizzetti, Chem. Commun., 2005, 2627 RSC.
- J. Bandara, J. A. Mielczarski and J. Kiwi, Langmuir, 1999, 15, 7670 CrossRef CAS.
- K. Vinodgopal, D. E. Wynkoop and P. V. Kamat, Environ. Sci. Technol., 1996, 30, 1660 CrossRef CAS.
- L. Davydov and P. G. Smirniotis, J. Catal., 2000, 191, 105 CrossRef CAS.
- C. J. G. Cornu, A. J. Colussi and M. R. Hoffmann, J. Phys. Chem. B, 2001, 105, 1351 CrossRef CAS.
- M. Mrowetz and E. Selli, J. Photochem. Photobiol., A, 2004, 162, 89 CrossRef CAS.
- C. G. Hatchard and C. A. Parker, Proc. R. Soc. London, Ser. A, 1956, 235, 518 Search PubMed.
- L. L. Perissinotti, M. A. Brusa and M. A. Grela, Langmuir, 2001, 17, 8422 CrossRef CAS.
- J. M. Joseph, H. Destaillats, H. M. Hung and M. R. Hoffmann, J. Phys. Chem. A, 2000, 104, 301 CrossRef CAS.
- M. Abdullah, J. K. C. Low and R. W. Matthews, J. Phys. Chem., 1990, 94, 6820 CrossRef CAS.
- R. J. Candal, W. A. Zeltner and M. A. Anderson, Environ. Sci. Technol., 2000, 34, 3443 CrossRef CAS.
- A. A. Ajmera, S. B. Sawant, V. G. Pangarkar and A. A. C. M. Beenackers, Chem. Eng. Technol., 2002, 25, 173 CrossRef CAS.
- G. G. Guilbault, P. J. Brignac Jr. and M. Juneau, Anal. Chem., 1968, 40, 1256 CrossRef CAS.
- C. Kormann, D. W. Bahnemann and M. R. Hoffmann, Environ. Sci. Technol., 1988, 22, 798 CAS.
- A. Torrents and A. T. Stone, Environ. Sci. Technol., 1993, 27, 1060 CrossRef CAS.
- J. Bandara and J. Kiwi, New J. Chem., 1999, 23, 717 RSC.
- N. Serpone, J. Martin, S. Horikoshi and H. Hidaka, J. Photochem. Photobiol., A, 2005, 169, 235 CrossRef CAS.
- A. H. Boonstra and C. A. H. A. Mutsaers, J. Phys. Chem., 1975, 79, 1694 CrossRef CAS.
- D. Vione, C. Minero, V. Maurino, M. E. Carlotti, T. Picatonotto and E. Pelizzetti, Appl. Catal., B, 2005, 58, 79 CrossRef CAS.
- J. A. R. van Veen, F. T. G. Veltmaat and G. Jonkers, J. Chem. Soc., Chem. Commun., 1985, 1656 RSC.
- D. M. Stanbury, Adv. Inorg. Chem., 1989, 33, 69 CAS.
- D. Lawless, D. Meisel and N. Serpone, J. Phys. Chem., 1991, 95, 5166 CrossRef CAS.
- G. V. Buxton, C. L. Greenstock, W. P. Helman and A. B. Ross, J. Phys. Chem. Ref. Data, 1988, 17, 513 CAS.
- W. Choi and M. R. Hoffmann, Environ. Sci. Technol., 1995, 29, 1646 CAS.
- A. J. Hoffman, E. R. Carraway and M. R. Hoffmann, Environ. Sci. Technol., 1994, 28, 776.
- C. M. Wang and T. E. Mallouk, J. Phys. Chem., 1990, 94, 4276 CrossRef.
- F. Forouzan, T. C. Richards and A. J. Bard, J. Phys. Chem., 1996, 100, 18123 CrossRef CAS.
- G. T. Brown and J. R. Darwent, J. Chem. Soc., Faraday Trans. 1, 1984, 80, 1631 RSC.
- T. Wu, G. Liu, J. Zhao, H. Hidaka and N. Serpone, J. Phys. Chem. B, 1999, 103, 4862 CrossRef CAS.
- L. Cermenati, P. Pichat, G. Guillard and A. Albini, J. Phys. Chem. B, 1997, 101, 2650 CrossRef CAS.
- F. Shiraishi and C. Kawanishi, J. Phys. Chem. B, 2004, 108, 10491 CrossRef CAS.
- G. V. Buxton and R. M. Sellers, J. Chem. Soc., Faraday Trans. 1, 1973, 69, 555 RSC.
- E. R. Carraway, A. J. Hoffman and M. R. Hoffmann, Environ. Sci. Technol., 1994, 28, 786 CAS.
| This journal is © The Royal Society of Chemistry and the Centre National de la Recherche Scientifique 2006 |
