Acoustic cavitation—an efficient energetic tool to synthesize nanosized CuO–ZrO2 catalysts with a mesoporous distribution
Manickam
Sivakumar
a,
Aharon
Gedanken
*a,
Ziyi
Zhong
b and
Luwei
Chen
b
aDepartment of Chemistry, Bar-Ilan University, Ramat-Gan, 52900, Israel. E-mail: gedanken@mail.biu.ac.il; Fax: (+972) 3-5351250; Tel: (+972) 3-5318315
bInstitute of Chemical and Engineering Sciences, 1 Pesek Road, Jurong Island, 627833, Singapore. E-mail: zhong_ziyi@ices.a-star.edu.sg; Fax: (+65) 6316-6182; Tel: (+65) 6796-3809
First published on 21st November 2005
Abstract
A CuO–ZrO2 catalyst of nanometer size was prepared using a simple precipitation technique, assisted by cavitation, and induced by an environmentally friendly ultrasonic technique. BET surface areas of 349.2 m2 g−1 for the as-prepared catalyst and 72.4 m2 g−1 for the catalyst calcined in air at 500 °C were obtained when the precursors were subjected to 70% ultrasonic intensity for 4 h. On the other hand, by following a conventional precipitation method using similar precursors, a surface area of 72 m2 g−1 was obtained when the precursors were heated to only 80 °C for 20 h. More importantly, only the application of ultrasound lead to the formation of a mesoporous structure. To confirm the ultrasonic cavitational effect in this process, the affect of the ultrasonic intensity in increasing the surface area, as well as in generating the mesopores, was also investigated. Furthermore, from studies of the catalytic activity for decomposing N2O, it has been observed that the catalyst obtained with 70% ultrasonic intensity clearly exhibits an increased activity compared to the catalyst prepared using 20% ultrasonic intensity. These results clearly indicate that ultrasound-induced cavitation is a new and rapid method for the preparation of supported catalysts. The products were characterized by nitrogen adsorption–desorption isotherms, TGA, XRD, TEM, EDAX, XPS and XRF measurements.
1. Introduction
Copper catalysts supported on zirconia have been shown to have a high catalytic activity and selectivity for NO–CO reactions at low temperatures,1,2 are active in the decomposition of N2O,3 and are active and selective for methanol synthesis from carbon dioxide.4–7 Therefore, finding a method of preparing high surface area copper oxide–zirconia powders is very important. Thus, there is a constant search for methods to obtain higher loadings of metal particles on the surfaces of nanosized supports. Such a process will result in an increase in the surface area of the metal particles. In addition, this will also result in an increase in the interfacial area between the metal and the support.Ultrasound irradiation as an energy source to induce various physical and chemical reactions has become an active area of research in recent years.8 The efficiency of this technique is evidenced by the generation of various novel materials with unusual properties.8 However, only a few studies on the sonochemical synthesis of multi-component materials have been reported.9–11
Ultrasonic reactions, and hence the resultant products, are controlled by various internal and external parameters. After careful observation of them, it has been predicted that the ultrasonic intensity is one of the important parameters that plays a leading role in any reaction.12 Depending on the applied ultrasonic intensity, bubble collapse conditions and hence the local high energy conditions (expressed in terms of the quantum of collapse pressure energy) also change.13 Thus, it is reasonable to expect a change in magnitude of a reaction with a change in magnitude of the ultrasonic intensity. To address the importance of ultrasonic intensity in the present reaction, copper oxide supported on zirconia nanopowders was prepared using tetraethylammonium hydroxide (TEAOH) precipitation with aqueous copper(II)–zirconium(IV) precursor solutions by an in situ (one stage) preparation, assisted by acoustic cavitation. The above studies were followed by applying two ultrasonic intensities, a lower 20% and a higher 70%, in order to understand the ultrasonic intensity effects on the generation of these catalysts. Furthermore, the prepared catalysts were checked for their catalytic activity.
2. Experimental
2.1 Starting materials
The starting materials used in the present work included zirconia precursor: zirconium tetra-n-propoxide [Zr(OPr)4 70% in propanol], copper salt: copper nitrate [Cu(NO3)2·2.5 H2O] and the precipitant: tetraethyl ammonium hydroxide [(CH3CH2)4NOH, 25% in methanol, TEAOH].2.2. Preparation procedure
Zr(OPr)4 (5 cm−3) was added drop-wise to a stirred aqueous solution of TEAOH (40 cm−3), and then copper nitrate (23 cm−3, as 0.5 M aqueous solution) was added. The above mixture was then irradiated with high intensity ultrasound radiation for 4 h by employing a direct immersion titanium horn (Sonics and Materials USA, frequency 20 kHz, rated power 600 W, 70% ultrasonic intensity, tip area 1.1304 cm2). After 10 min of irradiation, the maximum temperature of 78 °C was reached, which was measured by using a thermocouple. After 4 h of ultrasonic irradiation, the obtained product was thoroughly washed with water and ethanol, centrifuged and dried in a vacuum at room temperature. After drying, the catalyst was calcined in air at 500 °C for 12 h. A similar experiment was then conducted, but with an ultrasonic intensity of 20% in order to understand the effect of ultrasonic intensity on the nature of the product obtained. In this case, the maximum temperature of 78 °C was reached after 15 min of irradiation.Using tetraethyl ammonium hydroxide in the above process results in the hydrolysis and condensation of zirconium tetra-n-propoxide, and in the formation of a white precipitate. Next, adding an aqueous solution of copper nitrate results in the formation of a sky-blue color in the reaction mixture. As mentioned by Wang and Caruso,14 TEAOH was chosen as the precipitant for two reasons. Firstly, TEA+ ions are quaternary and cannot form complexes with Cu2+, while other ammonium ions can form stable complexes with Cu2+.15 Secondly, tetraalkylammonium salts are commonly used to stabilize metal colloids because the cations adsorb on the surface of the metal particles.16–18
Calorimetry was used to estimate the acoustic energy, or energy transfer efficiency, of the transducer to the solution. For this measurement, an adiabatic vessel with a cylindrical shape (thermoflask) was utilized. In all the experiments, 68 cm3 of distilled and de-ionized water was irradiated. The temperature rise of the medium was measured with a highly sensitive thermocouple.
The ultrasonic power dissipated into the liquid was calculated by using the following equation:
| Power (W) = (dT/dt)cpM |
2.3 Characterization
The phase constitution of the catalyst was recorded by employing a Bruker AXSD* advance powder X-ray diffractometer. XRD measurements were taken under a 40 kV, 30 mA, Cu-Kα (λ ∼ 1.5418) X-ray source, scanning range: 2θ from 15 to 80°, scanning speed of 2θ: 1° min−1 and a step size of 0.05° per step. The microstructures of the products were determined by transmission electron microscopy (TEM) (JEOL-JEM 100 SX microscope). Samples for TEM measurements were prepared by suspending the dried sample in absolute ethanol in an ultrasonic bath for 10 min, placing a drop of the sample suspension on a copper grid coated with carbon (400 mesh, Electron Microscopy Sciences) and allowing them to dry in air. Thermogravimetric analyses were performed in order to estimate the temperature for the removal of organic contaminants in an air atmosphere by using a Mettler Toledo TGA/SDTA851 instrument attached to a mass spectrometer (Balzers Instruments) over the temperature range of 30–700 °C (heating rate ∼10 °C min−1). The nitrogen adsorption and desorption isotherms at −196 °C were measured using a Micromeritics instrument (Gemini 2375) after the samples had been evacuated at 120 °C for 12 h. From the adsorption isotherm, the Barrett, Joyner and Halenda theory (BJH) was used to calculate the mesopore volume and its size distribution. Energy-dispersive analytical X-ray (EDAX) was detected on a JEOL-JSM-840 scanning microscope. X-ray photoelectron spectroscopy (XPS) spectra were obtained using an AXIS HS (Kratos Analytical) instrument. The surface composition of the investigated samples was determined using VISION 2 software. Catalytic tests were carried out in a fixed-bed reactor equipped with an on-line GC (Shimadzu14B) for the analysis of products. The weight of the catalysts was 50 mg for each measurement, and the space velocity was (GHSV) 4000 h−1. The catalysts were first reduced at 500 °C in 5% H2 in Ar. After being cooled down to room temperature, they were transferred to the reaction gas (20% N2O in Ar). The exact Cu content was measured by an X-ray fluorescence method (S4 Explorer X-ray spectrometer, Bruker).3. Results and discussion
3.1 Nitrogen physisorption
The representative nitrogen adsorption–desorption isotherms of calcined CuO–ZrO2 catalysts are shown in Fig. 1. These measurements were carried out for the catalysts obtained with 70% and 20% ultrasonic intensities, and calcined in air at 500 °C. The BET surface area of the calcined catalysts dropped to 72.4 m2 g−1 (with 70% intensity) and 27.4 m2 g−1 (with 20% intensity) from their corresponding non-calcined catalyst values of 349.2 m2 g−1 and 175.5 m2 g−1, respectively. Thus, the surface area of the catalyst prepared using 70% ultrasonic intensity is 2.7 times higher than that prepared using 20% intensity.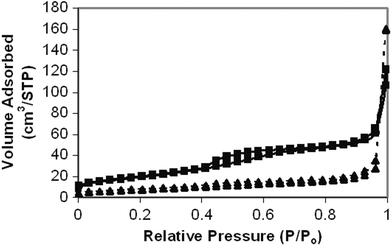 | ||
| Fig. 1 Nitrogen adsorption–desorption isotherms of the calcined CuO–ZrO2 catalysts obtained with 20% (▲) and 70% (■) ultrasonic intensities. | ||
The isotherms depicted in Fig. 1 show type H3 characteristics for catalysts fabricated under both intensities.19 The type H3 loop, which does not exhibit any limiting adsorption at high P/Po, has been observed for the aggregates of plate-like particles that give rise to slit-shaped pores. Here, the isotherm obtained using 70% ultrasonic intensity shows a well-defined step in the adsorption isotherm and a hysteresis loop in the desorption isotherm between the relative pressures P/Po 0.4–0.8, which is indicative of the condensation of the adsorbate within the framework-confined mesopores.20 The substantial hysteresis loop at high relative pressures above 0.9 is due to inter-particle capillary condensation,21–23 whereas the isotherm obtained with 20% ultrasonic intensity does not show a clear hysteresis loop, confirming the absence of a well-defined mesoporous texture. However, the low angle XRD did not show any peaks, in order to confirm the characteristic property of mesoporic materials, for either the 20% or 70% intensity catalysts prepared. This may be due to the absence of long range order in the pore arrangement or disordered channel systems in these catalysts, since a regular separation between single channel walls would result in low angle XRD reflection.24
A plot of incremental volume vs. average pore diameter, as calculated from the adsorption strings of the isotherm, is shown in Fig. 2, demonstrating a narrow mesoporous distribution in the range of 30–50 Å for the catalyst prepared using 70% ultrasonic intensity, with a total pore volume of about 0.191 cm3 g−1. Whereas for the catalyst prepared using 20% ultrasonic intensity, although Fig. 2 shows a distribution in the same range as that of the catalyst prepared using 70% ultrasonic intensity, its total pore volume is only about 0.04 cm3 g−1. This again clearly supports the fact that with a less intense ultrasonic intensity (20%), fewer pores are formed, and hence the mesoporic volume is lower. Also, taking into account the surface areas of the catalysts before (as-prepared) and after calcination, the shrinkage percentages have been calculated. These are 79.27% for 70% ultrasonic intensity and 84.39% for 20% ultrasonic intensity. It is surprising to find that the catalysts prepared under 20% ultrasonic intensity, i.e. with fewer pores, have a higher shrinkage percentage. The reason for this is not known at present.
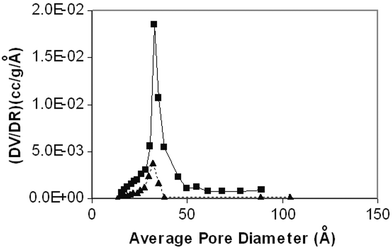 | ||
| Fig. 2 Pore size distribution of the calcined CuO–ZrO2 catalysts obtained with 20% (▲) and 70% (■) ultrasonic intensities. | ||
3.2 TEM
Fig. 3 shows the results of the transmission electron microscopic investigation of the calcined CuO–ZrO2 catalyst obtained under 70% ultrasonic intensity. It can be clearly seen from this picture that ultrasound at this high intensity promotes the formation of a large number of pores, their average diameter being between 4–6 nm. This observation further supports the pore size distribution obtained in the nitrogen adsorption studies. Similarly, from the TEM picture of the calcined CuO–ZrO2 catalyst obtained with 20% ultrasonic intensity, the pore size distribution was also determined. The number of pores are very small in this case, but their average diameter are also between 4–6 nm. This result agrees with the results of nitrogen absorption studies, which show that even though only a small number of pores are formed, their presence is reflected in their pore size distribution. Also, the ratio of the surface area (2.7) of the catalysts obtained from the two different ultrasonic intensities cannot be correlated with the sizes of the calcined particles because the ratio of R2 would rationalize only a 1.5 times larger surface area for the 70% ultrasonic intensity catalyst. Thus, the larger surface area is as a result of mesoporous structure.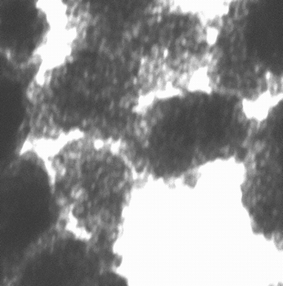 | ||
| Fig. 3 TEM of the calcined CuO–ZrO2 obtained with 70% ultrasonic intensity. | ||
3.3 TGA
The effect of temperature on the as-prepared catalysts, obtained by using ultrasound of 20% and 70% intensities, was studied by TGA. Fig. 4 shows the TGA curves of these catalysts. It can be seen from this Figure that along with the dehydration of the hydroxides, solvents and all organic materials were removed at around 400 °C, irrespective of the applied ultrasonic intensity, but that the percentage weight loss differed with the applied ultrasonic intensity. Thus, a weight loss of ca. 19.91% has been observed with 70% ultrasonic intensity, whereas a weight loss of ca. 14.93% has been observed with 20% ultrasonic intensity. An increase of 5% weight loss with 70% intensity compared to 20% intensity indicates that ultrasonication at higher intensities deposits a greater amount of hydroxides of Cu on the surface of ZrO2. An increase in the amount of deposition of these hydroxides then results in an increase in their dehydration weight loss to give copper oxide. Thus, with an increase in the amount of deposition, the weight loss also increases.14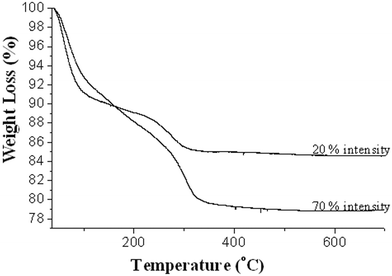 | ||
| Fig. 4 TGA curves of as-prepared CuO–ZrO2 catalysts, prepared using 20% and 70% ultrasonic intensities. Experiments conducted under an atmosphere of air with a ramp rate of 10 °C min−1. | ||
3.4 XRF
The exact Cu content of the catalysts obtained using both ultrasonic intensities was measured by the X-ray fluorescence (XRF) method. It has been found that the CuO content of the catalyst obtained using 70% ultrasonic intensity is 14.0 wt%, whereas for the catalyst obtained using 20% ultrasonic intensity it is 10.3 wt%. Thus, with an increase in ultrasonic intensity, there is an increase in the hydrolysis and hence in the generation and deposition of hydroxides of copper, which upon calcination results in an increased deposition of CuO on the surface of the ZrO2.3.5 XRD
Fig. 5 shows the XRD diffraction patterns of the catalysts obtained after calcination of the as-prepared catalysts at 500 °C, obtained with 70% and 20% ultrasonic intensities. Both are amorphous and indistinguishable (Fig. 5). The differences between the catalysts prepared using the two different ultrasonic intensities are apparent from the particle sizes obtained after calcination at 500 °C in air for 12 h, as shown in Fig. 5. It is obvious from the XRD patterns that the mean particle size (calculated using the Scherrer equation, based on the XRD linewidths) of CuO–ZrO2 obtained using 70% intensity of ultrasound is smaller (8 nm) than that obtained using 20% intensity (10 nm). Hence, it could be expected that the surface area of CuO–ZrO2 obtained with 70% ultrasonic intensity is higher. From the fluorimetry analyses, it has been observed that the percentage of copper oxide is 14.0% by weight for the catalyst obtained with 70% ultrasonic intensity, whereas for the catalyst obtained using 20% ultrasonic intensity it is 10.3%. Due to these small Cu contents, from the XRD, we have not determined whether the copper species is present as a separate phase in either catalyst. It is proposed that the copper species (ions and/or very small CuO clusters) is finely distributed on the surface of the ZrO2 particles.14 In particular, with the 70% ultrasonic intensity catalyst, more of these Cu species are deposited on the surface of the ZrO2, together with a small particle size that leads to an increase in the surface area.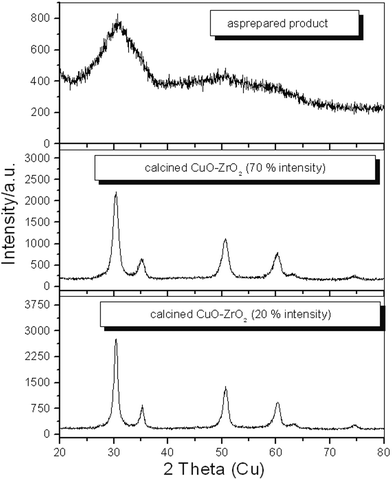 | ||
| Fig. 5 Powder X-ray diffraction patterns of the as-prepared product and calcined CuO–ZrO2 catalysts prepared using 70% and 20% ultrasonic intensities. | ||
3.6 XPS and EDAX
The XPS investigation of the mixed oxide catalysts prepared using the two ultrasonic intensities gave a binding energy of 82.5 eV for the Zr 3d![[/]](https://www.rsc.org/images/entities/char_e11f.gif) peak, as has been reported in the literature for pure zirconia.25 Also, the peak for Cu 2p was found at 932.6 eV and its oxidation state was +2. In addition, the shake-up nature of this peak clearly indicates the presence of Cu2+. The results obtained using EDAX for these catalysts further indicated the presence of Cu and Zr. In addition, the XPS (surface) Cu/Zr atomic ratio of the catalysts confirmed the CuO percentages given by X-ray fluorescence (bulk).
peak, as has been reported in the literature for pure zirconia.25 Also, the peak for Cu 2p was found at 932.6 eV and its oxidation state was +2. In addition, the shake-up nature of this peak clearly indicates the presence of Cu2+. The results obtained using EDAX for these catalysts further indicated the presence of Cu and Zr. In addition, the XPS (surface) Cu/Zr atomic ratio of the catalysts confirmed the CuO percentages given by X-ray fluorescence (bulk).
3.7 Catalytic activity testing
Fig. 6 displays the catalytic activities for the decomposition of N2O as a function of temperature from 350 to 620 °C. The conversion of N2O with the catalyst prepared using 70% ultrasonic intensity is higher than that of the catalyst prepared using 20% intensity across almost the whole temperature range. The calculated specific activities are listed in Table 1. The ratio of the specific activities per gram of active component Cu (R1/R1′) of the two catalysts are almost 1 ∶ 1, while the ratio of R2/R2′ for the two catalysts (per unit surface area and per gram of Cu) is basically an inversion of their surface areas (surface area of the catalyst prepared using 70% ultrasonic intensity ∶ surface area of the catalyst prepared using 20% ultrasonic intensity = 2.7 ∶ 1). These results show that the properties and the structures of the catalytically-active sites in the two catalysts are very similar. The increase in the catalytic activity of the catalyst prepared using 70% ultrasonic intensity comes from the increase in the Cu loading as a result of the increased ZrO2 support surface area.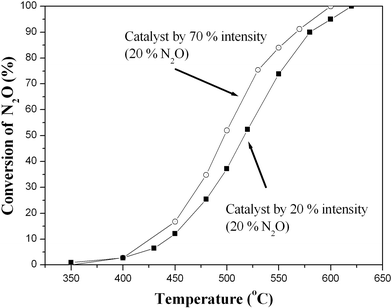 | ||
| Fig. 6 Catalytic activities for the decomposition of N2O of the catalysts prepared using 70% and 20% ultrasonic intensities. | ||
| Temperature/°C | A (70%) | B (20%) | ||||
|---|---|---|---|---|---|---|
| R 1 | R 2 | R 1′ | R 2′ | R 1/R1′ | R 2/R2′ | |
| a R 1 and R1′ are the specific activities for the decomposition of N2O per gram Cu per second (10−3 × m mol s−1 gCu−1), and R2 and R2′ are the specific activities for decomposition of N2O per gram Cu per second per square meter of ZrO2 (10−3 × m mol s−1 gCu m−2). | ||||||
| 450 | 9.07 | 0.0125 | 8.80 | 0.0321 | 1.00/0.970 | 1.00/2.57 |
| 480 | 1.77 | 0.0244 | 1.85 | 0.0675 | 1.00/1.05 | 1.00/2.77 |
| 500 | 2.71 | 0.0374 | 2.71 | 0.0989 | 1.00/1.00 | 1.00/2.64 |
| 520 | 3.92 | 0.0541 | 3.81 | 0.139 | 1.00/0.972 | 1.00/2.57 |
| 550 | 4.37 | 0.0603 | 5.10 | 0.186 | 1.00/1.17 | 1.00/3.08 |
From the above results, it can be concluded that mesoporous CuO–ZrO2 with a controlled pore size distribution and high specific surface area can be successfully obtained by an acoustic cavitational method in a short time using 70% ultrasonic intensity. The application of ultrasound in liquids results in a phenomenon called cavitation. This cavitation process is attributed to the behaviour or dynamics of the small bubbles formed, which includes their local formation, growth and collapse. The collapse of the bubbles generates enormous local pressures and temperatures, and this results in many localized hot spots that can cause the homogeneous formation of a large number of seed nuclei. Also, the turbulent flow and shock waves produced locally by acoustic cavitation increases molecular mobility, and hence it aids molecular collisions at sufficiently high velocities, which in turn produces a marked increase in the magnitude of hydrolysis and condensation of copper and zirconium precursors. More importantly, the passage of ultrasound also assists in the controlled hydrolysis of copper and zirconium precursors. Consequently, the acceleration of the reaction results directly from this local high energy phenomenon compared to producing similar surface area materials only by heating the solution at 80 °C for 20 h.
The most notable feature is that a difference in the concentration of energy, by means of applying different ultrasonic intensities, results in the generation of CuO–ZrO2 catalysts of different surface areas. This could very easily be observed from our results, which show that by changing the ultrasonic intensity from 20 to 70%, there is a marked increase (164%) in the surface area of the CuO–ZrO2 catalyst. This is mainly due to the fact that with an increase in ultrasonic intensity, more energy is being dissipated into the system. Although an increase in intensity leads to a decrease in the collapse pressure of a single bubble,13 at the same time, the number of bubbles generated also increases, resulting in an increase in the total quantum of pressure energy generated (given as = number of cavities × collapse pressure due to a single cavity) during the collapse of bubbles. Therefore, with an increase in intensity, the overall collapse conditions also become intense, thereby aiding an increased hydrolysis of copper precursor. Subsequently, due to calcination, this results in the deposition of greater amounts of copper species on the surface of the zirconia. Thus, the process gives CuO–ZrO2 catalyst with a higher surface area over a shorter period. This is clearly supported by the X-ray fluorescence measurements of the two catalysts prepared using two different ultrasonic intensities. Also, the magnitude of the ultrasonically-assisted reaction is about 5 orders of magnitude (70% ultrasonic intensity) higher than the previously reported conventional precipitation method.14
A change in the morphology of the catalysts could also be realized from TEM as a function of ultrasound intensity. Differences in morphology of the catalysts prepared using the two different intensities were accompanied by changes in their surface area and pore volume. There are two possible mechanisms to account for these dramatic changes. Firstly, the ultrasonically-induced collapsing of bubbles and the resultant extreme conditions generated are known to erode surfaces close to the area of bubble collapse. Since the number of bubbles created by 70% ultrasonic intensity is much larger and the collapse is more intense than for 20% ultrasonic intensity, it is quite reasonable to expect intense damage in the former case. This is reflected in the larger number of pores and defects revealed in the TEM images of Fig. 3, and is justified further by the higher adsorption of nitrogen molecules observed in the surface area measurements. Secondly, the formation of these mesoporous structures maybe due to mechanistic aspects which are not very clear at this stage. We therefore believe that cavitation events such as microjets, shock waves, etc., may play some role in the formation of the mesoporous structure. Applying a 70% ultrasonic intensity yields the formation of a more mesoporous material compared to applying a 20% ultrasonic intensity. This clearly indicates that by properly exploiting the intensity effects of ultrasound, a desired product morphology can be obtained.
4. Conclusions
Improvements in the magnitude of a reaction for preparing copper catalysts supported on zirconia has been established due to acoustic cavitation afforded by an ultrasonic treatment. It has been found that due to the application of ultrasound, there is a substantial (5-fold) increase in the magnitude of the reaction compared to the conventional method, to obtain a similar surface area. The increase in the magnitude of the reaction has been explained on the basis of the intense collapse conditions generated due to ultrasound. Quantification of the effect of ultrasonic intensity on the resultant surface area of the materials has also been achieved. It has been found from studies of catalytic activity that the increased activity of the catalyst prepared using 70% ultrasonic intensity comes from the increased Cu loading, which in turn results in an increased surface area. In addition, this is the first time that intensity effects have demonstratively generated different product morphologies, since a clearly observed mesoporous distribution has only been noted in catalysts prepared using the present ultrasonic cavitational approach with a high enough (∼70%) ultrasonic intensity.Acknowledgements
This research was supported by The Ministry of Science, Sport and Culture via a Materials Science grant through the Sino-Israeli program in Materials Science. We are grateful to Dr. Gregory for XPS measurements and helpful discussions. We also acknowledge Ms. Louise Braverman for editorial assistance.References
- Y. Okamoto, H. Gotoh, H. Aritani, T. Tanaka and S. Yoshida, J. Chem. Soc., Faraday Trans., 1997, 93, 3879 RSC.
- Y. Okamoto and H. Gotoh, Catal. Today, 1997, 36, 71 CrossRef CAS.
- G. Centi, G. Cerrato, S. D'Angelo, U. Finardi, E. Giamello, C. Morterra and S. Perathoner, Catal. Today, 1996, 27, 265 CrossRef CAS.
- R. A. Köppel, C. Stöcker and A. Baiker, J. Catal., 1998, 179, 515 CrossRef CAS.
- B. Denise and R. P. A. Sneeden, Appl. Catal., 1986, 28, 235 CrossRef CAS.
- Y. Amenomiya, Appl. Catal., 1987, 30, 57 CrossRef CAS.
- I. A. Fisher, H. C. Woo and A. T. Bell, Catal. Lett., 1997, 44, 11 CrossRef CAS.
- K. S. Suslick and G. J. Price, Annu. Rev. Mater. Sci., 1999, 29, 295 Search PubMed.
- J. C. Yu, L. Z. Zhang and J. Lin, J. Colloid Interface Sci., 2003, 260(1), 240 CrossRef CAS.
- A. Cabanas, J. A. Darr, E. Lester and M. Poliakoff, J. Mater. Chem., 2001, 11(2), 561 RSC.
- X. Z. Fu, L. A. Clark, Q. Yang and M. A. Anderson, Environ. Sci. Technol., 1996, 30(2), 647 CrossRef CAS.
- M. Sivakumar and A. B. Pandit, Ultrason. Sonochem., 2001, 8, 233 CrossRef CAS.
- P. R. Gogate and A. B. Pandit, AIChE J., 2000, 46, 372 CrossRef CAS.
- Y. Q. Wang and R. A. Caruso, J. Mater. Chem., 2002, 12, 1442 RSC.
- T. Munoz, A. M. Prakash, L. Kevan and K. J. Balkus, J. Phys. Chem. B, 1998, 102, 1379 CrossRef CAS.
- M. T. Reetz, W. Helbig, S. A. Quaiser, U. Stimming, N. Breuer and R. Vogel, Science, 1995, 267, 367 CrossRef CAS , and references therein.
- U. Kolb, S. A. Quaiser, M. Winter and M. T. Reetz, Chem. Mater., 1996, 8, 1889 CrossRef CAS , and references therein.
- H. Bönnemann, G. Braun, W. Brijoux, R. Brinkmann, A. S. Tilling, K. Seevogel and K. Siepen, J. Organomet. Chem., 1996, 520, 143 CrossRef , and references therein.
- K. S. W. Sing, D. H. Everett, R. A. W. Haul, L. Moscou, R. A. Pierotti, J. Rouquerol and T. Siemieniewska, Pure Appl. Chem., 1985, 57, 603 CrossRef CAS.
- P. J. Branton, P. G. Hall, K. S. W. Sing, H. Reichert, F. Schuth and K. K. Unger, J. Chem. Soc., Faraday Trans., 1994, 90, 2965 RSC.
- P. T. Tanev and T. J. Pinnavaia, Science, 1995, 267, 865 CrossRef CAS.
- S. A. Bagshaw, E. Prouzet and T. J. Pinnavaia, Science, 1995, 269, 1242 CrossRef.
- S. A. Bagshaw and T. J. Pinnavaia, Angew. Chem., Int. Ed. Engl., 1996, 35, 1102 CrossRef CAS.
- J. C. Yu, L. Zhang and J. Yu, J. Mater. Chem., 2002, 26, 416 RSC.
- W. M. Mullins and B. L. Averbach, Surf. Sci., 1988, 206, 29 CrossRef CAS.
| This journal is © The Royal Society of Chemistry and the Centre National de la Recherche Scientifique 2006 |