Synthesis and photophysical properties of ruthenocene-[60]fullerene dyads†
Juan José
Oviedo
a,
Mohamed E.
El-Khouly
cd,
Pilar
de la Cruz
a,
Laura
Pérez
a,
Javier
Garín
b,
Jesús
Orduna
b,
Yasuyuki
Araki
c,
Fernando
Langa
*a and
Osamu
Ito
*c
aFacultad de Ciencias del Medio Ambiente, Universidad de Castilla-La Mancha, 45071, Toledo, Spain. E-mail: Fernando.LPuente@uclm.es; Fax: +34 902 204 130; Tel: 34 925 268 843
bDepartamento de Química Orgánica, ICMA, Universidad de Zaragoza-CSIC, E-50009 Zaragoza, Spain. E-mail: jorduna@unizar.es; Fax: +34 976761 194; Tel: 34 976 761 194
cInstitute of Multidisciplinary Research for Advanced Materials, Tohoku University, Katahira, Aoba-ku, Sendai, 980-8577, Japan. E-mail: ito@tagen.tohoku.ac.jp; Fax: +81-22-217-5608
dDepartment of Chemistry, Faculty of Education, Kafr El-Sheikh, Tanta University, Egypt. E-mail: elkhouly@tagen.tohoku.ac.jp
First published on 11th November 2005
Abstract
Two novel ruthenocene-C60 dyads, with a 2-pyrazoline ring or a pyrrolidine ring as a linker, have been synthesized with the aim of providing a simple model of natural photosynthesis. The photophysical properties of the two ruthenocene-C60 dyads have been investigated by steady-state absorption and fluorescence, time-resolved fluorescence and nanosecond transient measurements in polar and non-polar solvents. The charge separation takes place in the ruthenocene-pyrazolino[60]fullerene more efficiently than in the ruthenocene-pyrrolidino[60]fullerene dyad. The lifetimes of the charge-separated states of the ruthenocene-pyrazolino[60]fullerene and the ruthenocene-pyrrolidino[60]fullerene dyads are 100 ns in PhCN. It was found that the ruthenocene-[60]fullerenes have an ability to prolong the charge-separated states compared with those for ferrocene-[60]fullerenes.
Introduction
The importance and complexity of natural photosynthesis1 make the study of suitable simpler models of great interest. An important approach to build these models is to link covalently an electron acceptor and an electron donor. The special electrochemical2 and photophysical3 properties of fullerenes, which include absorption in the visible region and a low reorganization energy that can accelerate the photoinduced charge separation and decelerate charge recombination,4 have placed C60 and its derivatives amongst the most important organic materials for photovoltaic applications, particularly plastic solar cells.5 Numerous examples of molecular systems covalently linked between electron donors and C60 have been synthesized to date in the search for efficient photoinduced charge separation and slow charge recombination.6 A variety of donors have been attached to fullerenes7 and, among them, ferrocene has been exploited intensively7e,8 due to its reversible low oxidation potential.Nevertheless, combinations of other metallocenes, such as ruthenocene, with C60 remain unexplored. Recently, we described the synthesis and preliminary studies on ruthenocene-C60 dyads.9 The first ionization potentials (IPs) for ferrocene and ruthenocene are 6.86 and 7.45 eV, respectively.10,11 Thus, ferrocene is a stronger donor in an electron-transfer sense. In many electron-donor (D) and electron-acceptor (A) systems, however, there is a little evidence to distinguish between the donor strengths of ferrocene and ruthenocene in systems with strong electron-acceptors. Indeed, there is electrochemical evidence that ruthenocene is the stronger donor, despite the fact that it has a lower energy HOMO than ferrocene.12 The superior donating properties of ruthenocene in some D–A dyads can be attributed to the more extensive d-orbitals of ruthenium,13 which lead to increase direct or indirect spatial overlap with the acceptor.14 It seems that this difference in donor strength between ferrocene and ruthenocene is most evident when η6-fulvene is a significant resonance form. These findings stimulated us to investigate in detail the electrochemical and optical properties of ruthenocene-fullerene dyads.
In the work described here, two new ruthenocene-C60 (Rc∼C60) dyads 3 and 4 were synthesized with different linking bridges to the fullerene cage. In case of dyad 3, a pyrazoline ring was used whereas a pyrrolidine ring was incorporated in dyad 4. The photophysical behavior of both dyads was investigated using different photochemical techniques in polar and non-polar solvents.
Results and discussion
Syntheses and characterization
The synthetic approach to prepare the 2-pyrazolino[60]fullerene derivative 3 is based on the 1,3-dipolar cycloaddition reaction of the nitrile imine generated in situ from the corresponding hydrazone 2. This hydrazone was prepared in 90% yield from ruthenocenecarboxaldehyde (1)15 and 4-nitrophenylhydrazine in EtOH under reflux for 20 minutes (Scheme 1). It was necessary to modify our previously described general procedure to obtain compound 3 in a good yield.16,17 The reaction of 2 with NBS in CHCl3 at room temperature was followed by the addition of C60 and Et3N in dry toluene at 40 °C. The mixture was stirred for 45 minutes to give compound 3 in 16% isolated yield after flash column chromatography (silica gel, toluene) followed by centrifugation in hexane, methanol and diethyl ether.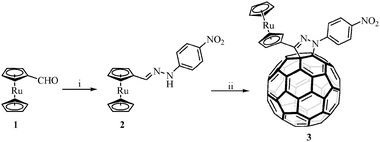 | ||
| Scheme 1 (i) 4-Nitrophenylhydrazine and (ii) NBS, C60 and Et3N. | ||
On the other hand, pyrrolidino[60]fullerene system 4 was prepared in 26% yield by a 1,3-dipolar cycloaddition reaction18 between the ruthenocenecarboxaldehyde (1), α-aminophenyl- acetic acid and C60 in chlorobenzene under microwave irradiation19 at 210 W for 45 minutes in a focused microwave oven (Scheme 2). 1′-(4-Nitrophenyl)-3′-(ferrocenyl)pyrazolino [60]fullerene (5) (Chart 1) was prepared as previously described.23
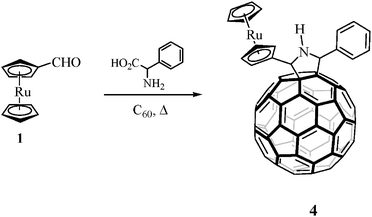 | ||
| Scheme 2 | ||
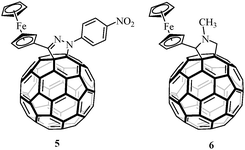 | ||
| Chart 1 Reference compounds 5 and 6. | ||
The structures of dyads 3 and 4 were confirmed by spectroscopic analysis (NMR, FT-IR and MS). The 1H NMR spectra of C60 derivatives exhibited all expected signals for the organic addends. In the case of compound 3, the 4-nitrophenyl group signals were observed between 8.00 and 8.50 ppm and the ruthenocene protons appeared as a singlet around 4.50 ppm for the unsubstituted cyclopentadienyl ring and as two multiplets, between 4.50 and 5.50 ppm, for the C5H4 moiety. Similar characteristic signals for the ruthenocene moiety were also observed in the 1H NMR spectrum of compound 4, together with signals for the pyrrolidine ring, which appear as singlets at 5.91 and 5.58 ppm, and the signals for the protons of the phenyl group between 7.26 and 8.00 ppm. The 13C NMR spectra are also consistent with the proposed structures, with the signals from the ruthenocene fragment between 70.0 and 75.0 ppm and those due to the corresponding sp2 carbons of the sphere between 160.0 and 134.0 ppm. In addition, the two sp3 carbon signals for the functionalized C60 cage were observed at around 89.0 and 76.0 ppm. The MALDI-MS analyses for 3 and 4 revealed the molecular ion peaks to be in agreement with the calculated ones. Finally, in the UV-Vis spectra, measured in CH2Cl2, the characteristic absorption of C60 monoadducts was observed at around 430 nm.
Optimized structures and frontier MO’s.
Optimized geometries (B3PW91/LanL2DZ) for 3 and 4 are shown in Fig. 1. The most important structural difference arises from the fact that conjugation of the para-nitrophenyl group with the ruthenocene moiety across the pyrazoline ring in compound 3 gives rise to an almost planar arrangement, with the pyrazoline ring forming an angle of 8° with the cyclopentadiene ring linked to it.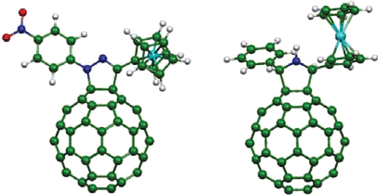 | ||
| Fig. 1 Optimized geometries (B3PW91/LanL2DZ) of compounds 3 (left) and 4 (right). | ||
On the other hand, the lack of conjugation between the ruthenocene group and the pyrrolidine ring in compound 4 allows free rotation around the bond linking these units and the ruthenocene group is arranged away from the C60 spheroid. The distances (RCC) from the Rc center to the center of the C60 moiety were estimated to be 7.55 and 8.40 Å, respectively, for compounds 3 and 4.
The HOMO and LUMO of compounds 3 and 4 are depicted in Fig. 2. It can be seen that the LUMO is localized on the C60 moiety whereas the main contribution to the HOMO is from ruthenium d orbitals in 4 and the HOMO in dyad 3 spreads from ruthenocene to the para-nitrophenyl group. These orbital topologies indicate that the charge-separated state has a structure like Rc˙+∼C60˙−, but the positive charge in 3 is also partially supported by the pyrazoline ring and the para-nitrophenyl group attached to it. It should also be noted that there is a significant difference in the calculated HOMO–LUMO gaps, which are 1.86 eV and 2.30 eV for 3 and 4, respectively.
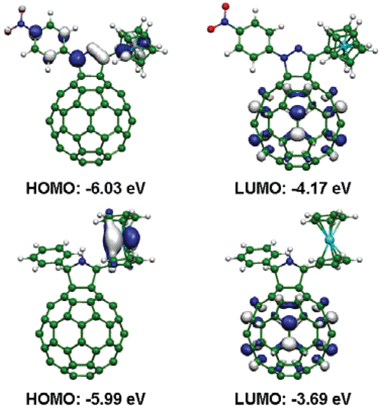 | ||
| Fig. 2 The HOMO and LUMO of dyads 3 (top) and 4 (bottom). | ||
Electrochemistry
Ruthenocene (Rc) based D–A systems have been much less widely studied than systems derived from ferrocene, presumably partly due to the irreversible redox chemistry of ruthenocene itself. Recently, however, it has been found that a number of substituted Rc derivatives undergo chemically (though not electrochemically) reversible two-electron oxidations.20 With the aim of estimating the energies of charge-separated states formed by photoinduced electron transfer, the reduction and oxidation potentials of dyads 3 and 4 were determined by cyclic voltammetry (CV) in ortho-dichlorobenzene(DCB)/acetonitrile (4 ∶ 1) containing 0.1 M tetra-n-butylammonium perchlorate [(n-C4H9)4NClO4] as a supporting electrolyte.The cyclic voltammogram (CV) of compound 4 in DCB/acetonitrile (4 ∶ 1) is shown in Fig. 3. Three reversible peaks can be seen in the negative potentials down to −2.5 V vs. Ag/Ag+ and these are attributed to the reduction potentials (Ered) of the C60 core. In the positive potential, an irreversible potential is observed at 0.71 V vs. Ag/Ag+ and this corresponds to the oxidation potential (Eox) of the Rc moiety. A similar cyclic voltammogram was obtained for 3, but a new non-reversible reduction wave at −1.82 V, assigned to the para-nitrophenyl moiety, also appeared. It can be seen that the Eox value for 3 is less positive by 0.13 V than that of 4, indicating the better electron-donor capability of the Rc connected to the pyrazoline ring. On the other hand, the Ered value of 3 is less negative than that of 4 by 0.10 V, indicating that the C60 moiety with the pyrazoline ring (3) is more electron-negative than that with pyrrolidine ring (4) as reported previously.17 The data obtained are summarized in Table 1 together with comparison data for C60, ruthenocene, formylruthenocene (1) and hydrazone 2.
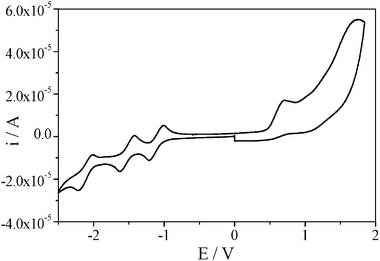 | ||
| Fig. 3 Cyclic voltammogram of compound 4 in ortho-dichlorobenzene/acetonitrile (4 ∶ 1) (V vs. Ag/AgNO3; scan rate was 100 mV s−1). | ||
| E 11/2(red) | E 21/2(red) | E 31/2(red) b | E 41/2(red) | E 1ox b | E 2ox b | HOMO–LUMO | |
|---|---|---|---|---|---|---|---|
| a V vs. Ag/AgNO3; GCE as working electrode; 0.1 M (n-C4H9)4NClO4; scan rate was 100 mV s−1. b Irreversible. c Assigned to the para-nitrophenyl group. | |||||||
| 1 | 0.68 | 1.17 | |||||
| 2 | −1.78c | 0.61 | |||||
| 3 | −1.01 | −1.41 | −1.82c | −1.96 | 0.58 | 1.42 | 1.59 |
| 4 | −1.11 | −1.52 | −2.12 | 0.71 | 1.82 | ||
| C60 | −0.99 | −1.40 | −1.92 | ||||
| Rc | 0.73 | ||||||
The experimental HOMO(Rc)–LUMO(C60) gap, determined as the difference between Ered and Eox, is significantly lower for 2-pyrazoline-based dyad 3 (1.59 eV) than that for pyrrolidine derivative 4 (1.82 eV) according to theoretical calculations. This difference suggests an easier photoinduced electron transfer in 3 than in 4.
From the first Eox and Ered values, the free-energies (ΔGRIP) of the radical ion-pairs of Rc˙+∼C60˙− were calculated using the Rehm–Weller equation (eqn (1)).21
| ΔGRIP = Eox(Rc) − Ered(C60) − ΔGS | (1) |
| ΔGS = e2/(4πε0εRRD–A) | (2) |
| Compound | Solvent | ΔGRIP/eV | ΔGCS/eV via1C60* | ΔGCS/eV via3C60* |
|---|---|---|---|---|
| a E 00 = 1.75 eV for 1C60*, and E00 = 1.50 eV for 3C60*. | ||||
| 3 | PhCN | −1.38 | −0.37 | −0.15 |
| Toluene | −1.97 | 0.22 | 0.44 | |
| 4 | PhCN | −1.61 | −0.14 | 0.08 |
| Toluene | −2.20 | 0.45 | 0.67 | |
From these ΔGCS values, the charge-separation process of 3 and 4via the excited singlet state of C60 (1C60*) is sufficiently exothermic in benzonitrile. In toluene, the CS process seems to be slightly endothermic, taking into consideration that the Weller model in toluene is likely an oversimplification, and the exact values quoted above are probably not completely reliable. The charge-separation process via the excited triplet state of C60 (3C60*) is exothermic for 3 in PhCN, but endothermic in toluene.
| −ΔGCS = ΔGCR − E00 | (3) |
Steady-state absorption spectra
The absorption spectra of dyads 3 and 4 measured in PhCN are shown in Fig. 4. The absorption bands above 400 nm are attributed to the C60 moiety. The absorption band of the Rc moiety is expected to appear at wavelengths below 400 nm, but the intensity of this band is weak compared with the huge absorption band of C60 in this region. The absorption intensities of compound 3 are slightly stronger than those of 4 in the 380–480 nm region. The absorption spectrum of pyrrolidino[60]fullerene dyad 4 is essentially a linear combination of the absorption spectra of the reference compounds, ruthenocene and N-methylpyrrolidino[60]fullerene, suggesting that there is no significant electronic interaction between the ruthenocene and fullerene in the ground state. On the other hand, the absorption band of compound 3 in the 380–480 nm region suggests interaction between the C60 moiety and Rc through the pyrazolino group. The absorption band at around 400 nm for dyad 3 changes with solvent polarity, as depicted in Fig. 4b. It can be seen that the broad band at around 400 nm decreases in toluene, suggesting a polar electronic interaction between ruthenocene and C60 in the ground state.8a,22 Similar behaviour has been observed in the analogous ferrocene-2-pyrazolino[60]fullerene dyad 5.23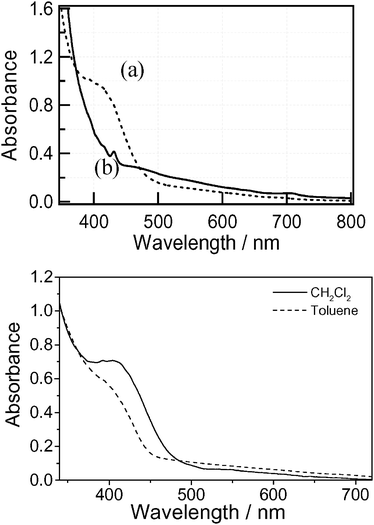 | ||
Fig. 4 (top) Steady-state absorption spectra of compounds 3 (a, ![[dash dash, graph caption]](https://www.rsc.org/images/entities/char_e091.gif) ) and 4 (b, —) in PhCN. (bottom) UV-vis spectra of 3 in dichloromethane (—) and toluene ( ) and 4 (b, —) in PhCN. (bottom) UV-vis spectra of 3 in dichloromethane (—) and toluene (![[dash dash, graph caption]](https://www.rsc.org/images/entities/char_e091.gif) ). The concentrations were kept at 2 × 10⁻⁵ M. ). The concentrations were kept at 2 × 10⁻⁵ M. | ||
Steady-state fluorescence spectra
The photochemical behaviour of dyads 3 and 4 was investigated using steady-state fluorescence measurements. The steady-state fluorescence spectra of compounds 3 and 4 are shown in Fig. 5. The spectra were obtained using a detector consisting of a special photomultiplier tube with relatively high sensitivity in the wavelength region above 600 nm. The measurements were carried out in different solvents (PhCN, DCB and toluene) by applying an excitation wavelength of 400 nm, which exclusively excites the C60 moiety. The emission observed in the range 700–760 nm for 4 in toluene is a typical fluorescence of the pyrrolidino-C60 moiety. In the case of 3 in toluene, a new fluorescence was observed at 653 nm in addition to the peak at 720 nm.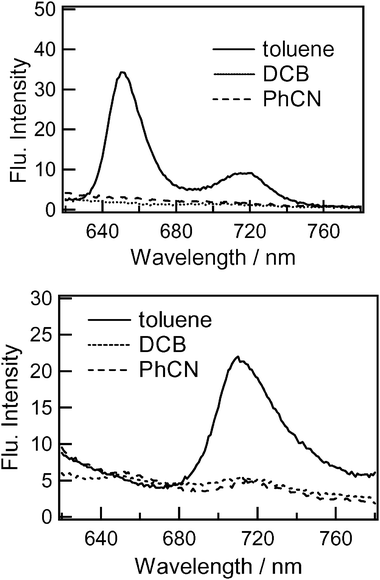 | ||
| Fig. 5 Steady-state fluorescence spectra of (top) dyad 3 and (bottom) dyad 4 in different organic solvents; λex = 400 nm. | ||
The emission peak at 653 nm is typical of a pyrazolino-C60 moiety attached to the Rc moiety. In polar solvents, these emission intensities were almost completely quenched compared with those in toluene. These observations suggest efficient quenching of the singlet excited state of the C60 moiety by the appended Rc moieties in polar solvents. The close spatial separation between the fullerene and the Rc group is expected to lead to efficient deactivation of the fullerene singlet excited state. In toluene the 720 nm emission of 3 was weak compared with that for 4, suggesting a weak quenching process for 3 even in toluene.
Time-resolved fluorescence spectra and fluorescence lifetimes
The time-resolved fluorescence spectral features of dyads 3 and 4 in polar solvents (DCB and PhCN) and a non-polar solvent (toluene) are shown in Fig. 6; the emission spectra are depicted in the time range of 0.1–0.6 ns.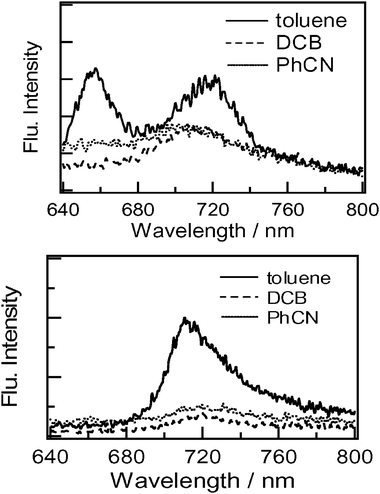 | ||
| Fig. 6 Time resolved spectra of (top) dyad 3 and (bottom) dyad 4 in different solvents; λex = 400 nm. | ||
In these experiments a streak-scope was used as the detector. The observed emission spectra in toluene are similar to those of the steady-state measurements, supporting the reliability of our measurements for these weak emissions. For compound 3 in DCB, the emission band at 653 nm disappeared but the remaining 700–720 nm emission is consistent with the steady-state measurement thus providing evidence of efficient quenching in polar solvents.
The fluorescence decay-time profiles at 700 nm for dyads 3 and 4 are shown in Fig. 7. The fluorescence time profile of the reference C60 exhibited a single exponential decay with a lifetime (τf0) of 1.3 ns. The attachment of donor moieties introduces a new quenching pathway for the lowest excited singlet state of the C60 moieties in dyads 3 and 4. In polar and non-polar solvents, the recorded fluorescence lifetimes monitored at 720 nm for both dyads are shorter than the (τf0) value, suggesting that the fluorescence quenching occurs from the 1C60* moiety. The fluorescence decay time profile can be fitted with two exponential components for 3, from which two lifetimes can be evaluated (see Table 3).
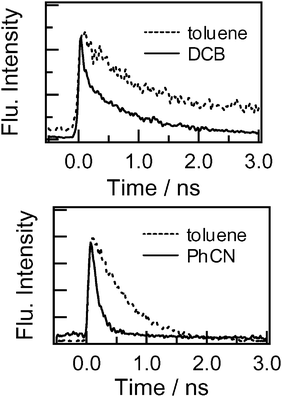 | ||
| Fig. 7 Fluorescence decay profiles monitored at 720 nm of (top) 3 and (bottom) 4; λex = 400 nm. | ||
| Compound | Solvent | τ FS/ps | k CS/s−1 | Φ CS |
|---|---|---|---|---|
| 3 | PhCN | Very fast | >1.0 × 10¹⁰ | >0.90 |
| DCB | 200(65%) 1550(35%) | 4.1 × 10⁹ | 0.83 | |
| Toluene | 750(70%) 2000(40%) | 5.6 × 10⁸ | 0.42 | |
| 4 | PhCN | 150 | 5.8 × 10⁹ | 0.87 |
| DCB | 400 | 1.6 × 10⁹ | 0.66 | |
| Toluene | 700 | 5.9 × 10⁸ | 0.41 |
The short lifetimes (τf) are in the 200 and 420 ps range in DCB and toluene, respectively. In PhCN, the fast part of the process was too fast to record. For compound 4, the lifetimes were evaluated by curve-fitting with a single exponential and gave values in the range 150–620 ps. The fluorescence lifetimes became shorter on increasing the solvent polarity, suggesting that the quenching process is due to the charge separation from the donor moieties to the C60 moiety to yield the charge-separated (CS) state. The rate constants for charge separation (kCS) were calculated using the eqn (4):
| kCS = 1/τf − 1/τf0 | (4) |
| ΦCS = (1/τf − 1/τf0)/1/τf | (5) |
Transient absorption measurements
The nanosecond transient spectra of 3 in PhCN by 355 nm laser light photolysis (Fig. 8, top), where C60 can be predominantly excited, were measured. Immediately after laser excitation (spectrum at 50 ns), the transient absorption peak appeared at 720 nm with a broad absorption in the 1000–1600 nm region. At 500 ns, the broad absorption in the near-IR region disappeared and the absorption at 720 nm remained. This remaining absorption band was assigned to the triplet state of C60 (3C60*). The rapidly decaying absorption can be ascribed to the radical ion pair Rc˙+∼C60˙−. In general, the C60˙− moiety shows a clear absorption peak at 1000 nm; however, only a broad absorption was observed in the case of compound 3. One possible explanation for this is overlap of the absorption due to Rc˙+.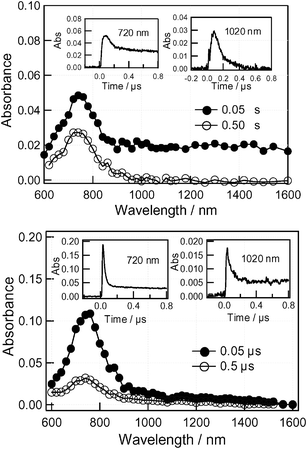 | ||
| Fig. 8 Transient absorption spectra of compound 3 (0.1 mM) obtained by 355 laser light photolysis in Ar-saturated (top) PhCN and (bottom) toluene. | ||
The time profiles in the inset in Fig. 8 (top) show that the decay processes in the near-IR region give a decay rate constant of k(1020 nm) = 9.6 × 10⁶ s−1, which is attributed to the charge-recombination rate constant (kCR) of Rc˙+∼C60˙−. The inverse of the kCR value gave the lifetime (τRIP) of Rc˙+∼C60˙− to be 100 ns in PhCN at room temperature. The decay-time profile at 720 nm shows dual decays; the initial decay rate is in good agreement with the kCR value, suggesting the absorption of Rc˙+∼C60˙− is overlapping in this region. The difference transient absorption spectrum obtained subtracting the transient spectrum at 500 ns from that at 50 ns is all attributed to Rc˙+∼C60˙−. The slow decay at 720 nm can be attributed to the lifetime of Rc∼3C60*. In toluene (Fig. 8 (bottom)) the predominant absorption peak appeared at 720 nm and this is due to the 3C60* moiety. The rapid decay at 720 nm can be attributed mainly to rapid decay of the 3C60* moiety due to the heavy atom effect.
The transient absorption spectra of 2 observed by exciting the Rc moiety with 532 nm light in PhCN are shown in Fig. 9, which exhibited the broad absorption spectra with maxima at 640, 950 and 1200 nm in the 50 ns spectrum. These bands might be attributed to the radical ion-pairs (Rc˙+∼PhNO2˙−). The lifetime of the radical-pairs was evaluated as 20 ns which is shorter than that of 3.
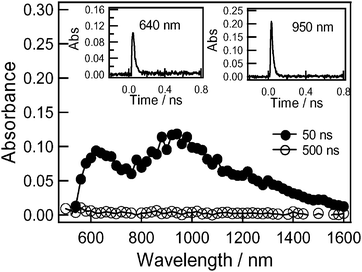 | ||
| Fig. 9 Transient absorption spectra of compound 2 (0.1 mM) obtained by 532 laser light photolysis in Ar-saturated PhCN. | ||
In the case of 5, the transient absorption spectra (supporting information; Fig. S2†) exhibited only the weak absorption band of triplet C60 at 720 nm without evidence of the forming of radical ion-pairs. This suggests that the charge recombination after efficient charge separation is fast, because of stronger donor ability of the Fc moiety. On the contrary, the charge-recombination of the Rc derivatives is slow, because the charge-recombination process may belong to the Marcus inverted region24 due to sufficiently negative ΔGRIP values in Table 2.
The transient absorption spectra of compound 4 in PhCN are shown in Fig. 10 (top). In the spectrum at 50 ns, the strong absorption appearing at 720 nm is due to the 3C60* moiety. In comparison to dyad 3, the absorbance of 4 at 720 nm is stronger by a factor of 10, suggesting the predominant generation of the 3C60* moiety. In the near-IR region, the broad absorption tail seems to be extended, although the relative intensity of the near-IR band of compound 4 is weak compared with that at 720 nm. The rapid-decay in the near-IR band can be attributed to Rc˙+∼C60˙−. On the other hand, the band at 720 nm can be attributed to the 3C60* moiety, although the decay was very fast, probably due to the heavy atom effect of Rc.
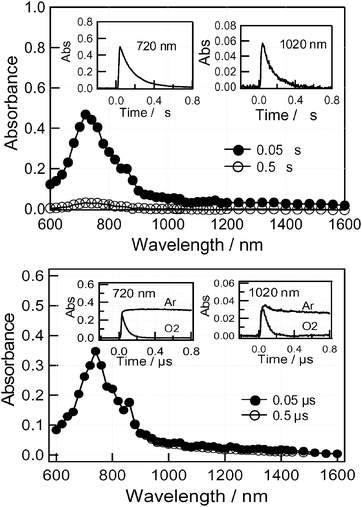 | ||
| Fig. 10 Transient absorption spectra of compound 4 (0.1 mM) obtained by 355 laser light photolysis in Ar-saturated (top) PhCN and (bottom) toluene. | ||
In the case of 4 in toluene, similar transient absorption spectra were observed and these are shown in Fig. 10 (bottom). Although the absorption shape is quite similar to that in PhCN, the time-profiles were quite different. The decay rates at 720 nm and the near-IR region were quite slow, which suggests that these bands are due to the 3C60* moiety. Indeed, the decay was accelerated on addition of O2 and this provides further evidence for this assignment. From the fluorescence quenching, the charge-separation takes place via the 1C60* moiety; however, the fast charge-recombination produces the 3C60* moiety.
In Table 4, the charge-recombination rate constants (kCR) of Rc˙+∼C60˙− evaluated from the decay at 1020 nm are summarized. The kCR value in PhCN is larger than that in toluene for 3. Lifetimes of the radical ion-pairs are as long as 100 ns in PhCN for both 3 and 4. Compared with 6 (kCR = 4.5 × 10⁹ s−1 in PhCN),8 the kCR values for the Rc derivatives are quite smaller, probably because of the high hole trapping ability of the Rc moiety.
Energy diagram
The energy diagram after photo-excitation is depicted in Fig. 11, in which the lowest excited state data were evaluated from the 0–0 band of the longest wavelength of the transition. The energy level of Rc˙+∼C60˙− in PhCN is slightly lower than those in DCB/acetonitrile in Table 2. The negative ΔGCS values in polar solvents render charge separation from both 1Rc* and 1C60*, suggesting possible charge-separation. However, the energy level of Rc˙+∼C60˙− in toluene is higher than that in PhCN, although the values in toluene may be associated with considerable error.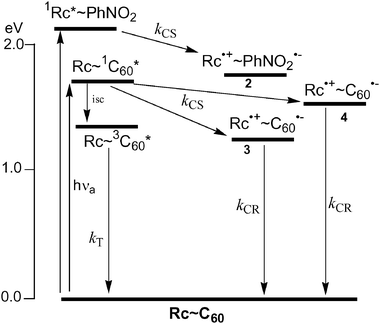 | ||
| Fig. 11 Energy diagram of 3 and 4 in benzonitrile. | ||
In the case of compound 3 in PhCN, the charge-separation process takes place mainly via1C60* moiety generating Rc˙+∼C60˙−. Minor contribution of forming Rc˙+∼C60˙− may arise via the electron migration (transfer) from Rc˙+∼PhNO2˙− to C60 to yield the final Rc˙+∼C60˙− in PhCN. As in Table 1, the energy level of Rc˙+∼PhNO2˙− is higher than that of Rc˙+∼C60˙−, because the reduction potential of PhNO2 group was more negative than that of C60 moiety. The charge-recombination of ion-pair, Rc˙+∼C60˙− may produce the ground states. In toluene, the charge-separation process of 3 is minor, because of the endothermic process; therefore, intersystem crossing takes place competitively with the charge-separation process. The charge-recombination of ion-pair, Rc˙+∼C60˙− may produce the 3C60* in addition to the direct production of the ground states.
In the case of dyad 4 in PhCN, the charge-separation process via the 1C60* moiety is a minor process. Similar results were observed for 6.8 The considerable 3C60* moiety is produced via intersystem crossing and via the charge-recombination process since the charge-separated state is higher than 3C60*. For the generation of 3C60* moiety in toluene, the contribution of the intersystem crossing increases compared with that of the charge-recombination process, if any.
Conclusions
In summary, we have synthesized two new donor–acceptor dyads based on ruthenocene as the electron donor and 2-pyrazolino[60]fullerene and pyrrolidino[60]fullerene as electron acceptors. The electrochemical and photophysical properties of the two dyads have been studied. Cyclic voltammetry measurements show a lower HOMORc–LUMOC60 gap in the 2-pyrazolino[60]fullerene dyad (3) than in the pyrrolidino[60]fullerene (4) system and this order is supported by theoretical calculations at the B3PW91/LanL2DZ level. The photophysical properties of the ruthenocene-C60 dyads were investigated by measuring the time-resolved fluorescence and nanosecond transient spectra in polar and non-polar solvents. A different type of behaviour was observed in each of these two dyads. The photoinduced charge separation takes place efficiently in 2-pyrazolino[60]fullerene-ruthenocene, whereas the charge-separation efficiency becomes quite low in pyrrolidino[60]fullerene-ruthenocene. This finding reveals that the pyrazoline ring mediates charge-separation due to the higher electron-donating ability of the pyrazoline ring compared with that of that pyrrolidine ring. Compared with the corresponding ferrocene-C60 derivatives, the slower charge-separation and slower charge-recombination were confirmed for ruthenocene- C60 derivatives.Experimental
General remarks
All cycloaddition reactions were performed under argon. C60 was purchased from MER Corporation (Tucson, AZ). TLC using Merck silica gel 60-F254 was used to monitor cycloaddition reactions. 1H NMR and 13C NMR spectra were recorded on Varian Mercury 200 and Varian Inova 500 spectrometers. FT-IR spectra were recorded on a Nicolet Impact 410 spectrophotometer using KBr disks. MALDI-TOF mass spectra were obtained on a Bruker ReflexIII spectrometer. Elemental analyses were performed on a Perkin-Elmer 2400 CHNS/O Series II analyzer.The UV/Vis spectra were obtained using a Jasco model V570 DS spectrophotometer or a Shimatzu spectrophotometer. Steady-state fluorescence spectra were measured on a Shimadzu RF-5300 PC spectrofluorophotometer equipped with a photomultiplier tube with high sensitivity in the 700–800 nm region.
Cyclic voltammetry measurements were carried out on an Autolab PGSTAT 30 potentiostat using a BAS MF-2062 Ag/0.01 M AgNO3, 0.1 M (n-C4H9)4ClO4 in acetonitrile reference electrode, an auxiliary electrode consisting of a Pt wire, and a Metrohm 6.1247.000 conventional glassy carbon electrode (3 mm o.d.) as a working electrode directly immersed in the solution. A 10 mL electrochemical cell from BAS, Model VC-2, was also used. The reference potential was shifted by 290 mV towards a more negative potential compared with the Ag/AgCl scale. E1/2 values were taken as the average of the anodic and cathodic peak potentials. Scan rate: 100 mV s−1.
The picosecond time-resolved fluorescence spectra were measured by a single-photon counting method using a second harmonic generation (SHG, 410 nm) Ti:sapphire laser (Spectra-Physica, Tsunami 3950-L2S, 1.5 ps fwhm) and a streak-scope (Hamamatsu Photonics, C43334-01) equipped with a polychromator (Action Research, SpectraPro 150) as an excitation source and a detector, respectively. Lifetimes were evaluated with software attached to the equipment.
The nanosecond transient absorption measurements in the near-IR region were measured by means of laser-flash photolysis; 532 nm light from a Nd:YAG laser (Spectra-Physics and Quanta-Ray GCR-130, 6 ns fwhm) was used as an excitation source. For transient absorption spectra in the near-IR region (600–1200 nm), monitoring light from a pulsed Xe-lamp was detected with Ge-avalanche photodiode module (Hamamatsu Photonics, B2834). For spectra in the visible region (400–800 nm), a Si-PIN photodiode (Hamamatsu Photonics, S1722-02) was used as a detector. All the samples were placed in a quartz cell (1 × 1 cm) and were deaerated by bubbling Ar through the solution for 15 min.
The computational calculations were performed by ab initio B3LYP/3-21G(*) methods with the GAUSSIAN 03 software package on high-speed computers. The images of the frontier orbitals were generated from Gauss View-03 software.
Synthesis
Acknowledgements
Financial support for this work was provided by a grant from the Ministerio de Educación y Ciencia of Spain, FEDER funds (Project CTQ2004-00364/BQU) and the Junta de Comunidades de Castilla-La Mancha (Project PAI-02-023). This research was partially supported by a Grant-in-Aid for the COE project, Giant Molecules and Complex Systems, 2002. This work was also supported by a Grant-in-Aid for Scientific Research on Priority Area (417) from the Ministry of Education, Culture, Sports, Science, and Technology of Japanese Government.References
- (a) The Photosynthetic Reaction Center, ed. J. Deisenhofer and J. R. Norris, Academic Press, New York, 1993 Search PubMed; (b) T. Brixner, J. Stenger, H. M. Vaswani, R. E. Blankenship and G. Fleming, Nature, 2005, 434, 625–628 CrossRef CAS.
- J. Chlistunoff, D. Cliffer and A. J. Bard, in Handbook of Organic Conductive Molecules and Polymers, ed. H. S. Nalwa, John Wiley & Sons, New York, 1997, vol. 1, ch. 7 Search PubMed.
- Optical and Electronic Properties of Fullerenes and Fullerene-based Materials, ed. J. Shinar, Z. V. Vardeny and Z. H. Kafafi, Marcel Dekker Inc., New York, 2000 Search PubMed.
- P. J. Bracher and D. Schuster, in Fullerenes: from synthesis to optoelectronic properties, ed. D. Guldi and N. Martín, Kluwer Academic Publishers, Dordrecht, 2002 Search PubMed.
- (a) C. J. Brabec, N. S. Sariciftci and J. C. Hummelen, Adv. Funct. Mater., 2001, 11, 15–26 CrossRef CAS; (b) F. Wudl, J. Mater. Chem., 2002, 12, 1959–1963 RSC; (c) J.-F. Nierengarten, Sol. Energy Mater. Sol. Cells, 2004, 83, 187–199 CrossRef CAS.
- (a) D. M. Guldi, Chem. Soc. Rev., 2002, 31, 22–36 RSC; (b) D. Gust, T. A. Moore and A. L. Moore, Acc. Chem. Res., 2001, 34, 40–48 CrossRef CAS.
- For recent reviews see: (a) N. Martín, L. Sánchez, B. Illescas and I. Pérez, Chem. Rev., 1998, 98, 2527–2547 CrossRef CAS; (b) M. Prato and M. Maggini, Acc. Chem. Res., 1998, 31, 519–526 CrossRef CAS; (c) F. Diederich and M. Gómez-López, Chem. Soc. Rev., 1999, 28, 263–277 RSC; (d) H. Imahori and Y. Sakata, Eur. J. Org. Chem., 1999, 2445–2457 CrossRef CAS; (e) H. Imahori, K. Tamaki, H. Yamada, K. Yamada, Y. Sakata, Y. Nishimura, I. Yamazaki, M. Fujitsuka and O. Ito, Carbon, 2000, 38, 1599–1605 CrossRef CAS; (f) D. I. Schuster, Carbon, 2000, 38, 1607–1614 CrossRef CAS; (g) J. L. Segura and N. Martín, Chem. Soc. Rev., 2000, 29, 13–25 RSC; (h) D. M. Guldi, Chem. Soc. Rev., 2002, 31, 22–36 RSC; (i) J.-F. Nierengarten, N. Armaroli, G. Accorsi, Y. Rio and J.-F. Eckert, Chem.–Eur. J., 2003, 9, 36–41 CrossRef.
- (a) D. M. Guldi, M. Maggini, G. Scorrano and M. Prato, J. Am. Chem. Soc., 1997, 119, 974–980 CrossRef CAS; (b) H. Imahori, H. Yamada, Y. Nishimura, I. Yamazaki and Y. Sakata, J. Phys. Chem. B, 2000, 104, 2099–2018 CrossRef CAS; (c) F. Langa, P. de la Cruz, E. Espildora, A. Gonzalez-Cortes, A. de la Hoz and V. Lopez-Arza, J. Org. Chem., 2000, 65, 8675–8684 CrossRef CAS; (d) H. Imahori, H. Norieda, H. Yamada, Y. Nishimura, I. Yamazaki, Y. Sakata and S. Fukuzumi, J. Am. Chem. Soc., 2001, 123, 100–110 CrossRef CAS; (e) F. D. D′Souza, M. E. Zandler, P. M. Smith, G. R. Deviprasad, F. M. Arkady and O. Ito, J. Phys. Chem. A, 2002, 106, 649–656 CrossRef CAS; (f) M. E. Zandler, P. M. Smith, M. Fujitsuka, O. Ito and F. D. D′Souza, J. Org. Chem., 2002, 67, 9122–9129 CrossRef CAS; (g) S. Campidelli, E. Vazquez, D. Milic, M. Prato, J. Barbera, D. M. Guldi, M. Marcaccio, D. Paolucci, F. Paolucci and R. Deschenaux, J. Mater. Chem., 2004, 14, 1266–1272 RSC.
- J. J. Oviedo, P. de la Cruz, J. Garín, J. Orduna and F. Langa, Tetrahedron Lett., 2005, 46, 4781–4784 CrossRef CAS.
- S. Evans, M. L. H. Green, B. Jewitt, A. F. Orchard and C. F. Pygall, J. Chem. Soc., Faraday Trans. 2, 1972, 68, 1847–1865 RSC.
- C. Cauletti, J. C. Green, M. R. Kelly, J. Robbins and J. C. Smart, J. Electron Spectrosc. Relat. Phenom., 1980, 19, 327–353 CrossRef CAS.
- S. Barlow, L. M. Henling, M. W. Day, W. P. Schaefer, J. C. Green, T. Hascall and S. R. Marder, J. Am. Chem. Soc., 2002, 124, 6285–6296 CrossRef CAS.
- S. Barlow and S. R. Marder, Chem. Commun., 2000, 1555–1562 RSC.
- S. Barlow, H. E. Bunting, C. Ringham, J. C. Green, G. U. Bublitz, S. G. Boxer, J. W. Perry and S. R. Marder, J. Am. Chem. Soc., 1999, 121, 3715–3727 CrossRef CAS.
- R. Sanders and U. T. Mueller-Westerhoff, J. Organomet. Chem., 1996, 512, 219–224 CrossRef CAS.
- P. de la Cruz, A. Díaz-Ortiz, J. J. García, M. J. Gómez-Escalonilla, A. de la Hoz and F. Langa, Tetrahedron Lett., 1999, 40, 1587–1590 CrossRef.
- (a) F. Langa, P. de la Cruz, E. Espíldora, A. de la Hoz, J. L. Bourdelande, L. Sánchez and N. Martín, J. Org. Chem., 2001, 66, 5033–5041 CrossRef CAS; (b) J. L. Delgado, P. de la Cruz, V. Lopez-Arza, F. Langa, D. B. Kimball, M. M. Haley, Y. Araki and O. Ito, J. Org. Chem., 2004, 69, 2661–2668 CrossRef CAS.
- M. Prato and M. Maggini, Acc. Chem. Res., 1998, 31, 519–526 CrossRef CAS.
- Microwave irradiation has proven to be a useful source of energy in fullerene chemistry. See: A. de la Hoz, A. Díaz-Ortiz and F. Langa, in Microwaves in Organic Synthesis, ed. A. Loupy, Wiley-VCH, New York, 2002, pp. 295–343 Search PubMed.
- (a) M. Sato, A. Kudo, Y. Kawata and H. Saitoh, Chem. Commun., 1996, 25–26 RSC; (b) M. Sato, Y. Kawata, A. Kudo, A. Iwai, H. Saitoh and S. Ochiai, J. Chem. Soc., Dalton Trans., 1998, 13, 2215–2224 RSC.
- A. Z. Weller, Z. Phys. Chem., Neue Folge, 1982, 133, 93–98 CAS.
- (a) Y. Nakamura, T. Minowa, S. Tobita, H. Shizuka and J. Nishimura, J. Chem. Soc., Perkin Trans. 2, 1995, 2351–2357 RSC; (b) J. Llacay, J. Veciana, J. V. Gancedo, J. L. Bourdelande, R. G. Moreno and C. Rovira, J. Org. Chem., 1998, 63, 5201–5210 CrossRef CAS; (c) R. Fong II, D. I. Schuster and S. R. Wilson, Org. Lett., 1999, 1, 729–732 CrossRef CAS; (d) T. Ohno, K. Moriwaki and T. Minaya, J. Org. Chem., 2001, 66, 3397–3401 CrossRef CAS.
- E. Espíldora, J. L. Delgado, P. de la Cruz, A. de la Hoz, V. López-Arza and F. Langa, Tetrahedron, 2002, 58, 5821–5826 CrossRef CAS.
- R. A. Marcus, J. Chem. Phys., 1956, 24, 966–978 CrossRef CAS.
- (a) A. Ouchi, R. Hatsuda, B. Z. S. Awen, M. Sakuragi, R. Ogura, T. Ishii, Y. Araki and O. Ito, J. Am. Chem. Soc., 2002, 124, 13364–13365 CrossRef CAS; (b) A. Ouchi, B. Z. S. Awen, R. Hatsuda, R. Ogura, T. Ishii, Y. Araki and O. Ito, J. Phys. Chem. A, 2004, 108, 9584–9592 CrossRef CAS.
Footnote |
| † Electronic supplementary information (ESI) available: copies of 1H NMR, 13C NMR and MS spectra for compounds 2, 3 and 4 and transient absorption spectra of 5 in toluene and benzonitrile. See DOI: 10.1039/b509221c |
| This journal is © The Royal Society of Chemistry and the Centre National de la Recherche Scientifique 2006 |
