Microparticle sampling by electrowetting-actuated droplet sweeping
Yuejun
Zhao
a and
Sung Kwon
Cho
*b
aDepartment of Mechanical Engineering, University of Pittsburgh, 633 Benedum Hall, Pittsburgh, PA 15261, USA. E-mail: yuz21+@pitt.edu; Fax: +1-412-624-4846; Tel: +1-412-624-1769
bDepartment of Mechanical Engineering, University of Pittsburgh, 636 Benedum Hall, Pittsburgh, PA 15261, USA. E-mail: skc@engr.pitt.edu; Fax: +1-412-624-4846; Tel: +1-412-624-9798
First published on 3rd November 2005
Abstract
This paper describes a new microparticle sampler where particles can be efficiently swept from a solid surface and sampled into a liquid medium using moving droplets actuated by the electrowetting principle. We successfully demonstrate that super hydrophilic (2 µm and 7.9 µm diameter glass beads of about 14° contact angle), intermediate hydrophilic (7.5 µm diameter polystyrene beads of about 70° contact angle), and super hydrophobic (7.9 µm diameter Teflon-coated glass beads and 3 µm size PTFE particles of over 110° contact angles) particles on a solid surface are picked up by electrowetting-actuated moving droplets. For the glass beads as well as the polystyrene beads, the sampling efficiencies are over 93%, in particular over 98% for the 7.9 µm glass beads. For the PTFE particles, however, the sampling efficiency is measured at around 70%, relatively lower than that of the glass and polystyrene beads. This is due mainly to the non-uniformity in particle size and the particle hydrophobicity. In this case, the collected particles staying (adsorbing) on the air-to-water interface hinder the droplet from advancing. This particle sampler requires an extremely small amount of liquid volume (about 500 nanoliters) and will thus be highly compatible and easily integrated with lab-on-a-chip systems for follow-up biological/chemical analyses.
Introduction
Exposure to airborne microorganisms or toxic chemicals in environments such as indoor, healthcare, agricultural and industrial workplaces causes millions of episodes of various health complications and disorders. Many respiratory and other adverse health effects, such as infectious hypersensitivity pneumonitis and toxic reactions, can be caused by airborne biological particles.1–6 In particular, recently there has been an increased bio-terrorism threat that certain microorganisms such as anthrax-causing Bacillus anthracis spores can be used as bio-warfare agents. A mason jar of anthrax sprayed over an urban area could infect 400![[thin space (1/6-em)]](https://www.rsc.org/images/entities/char_2009.gif) 000 urban residents and possibly kill half of them in weeks. In order to control and prevent exposure to airborne biological particles in an immediate manner, efficient monitoring tools are crucially required, especially with the fast response capability to avoid such a catastrophe possibly caused by anthrax.
000 urban residents and possibly kill half of them in weeks. In order to control and prevent exposure to airborne biological particles in an immediate manner, efficient monitoring tools are crucially required, especially with the fast response capability to avoid such a catastrophe possibly caused by anthrax.
To assess bacterial and fungal contents suspended in the air, generally they are sucked and impacted on an agar surface or impinged into a liquid medium by air flowing.2 Then, the collected bacteria and fungi are cultured in a separated system for a period of from 2–3 days for most microorganisms up to 3–5 weeks for M. tuberculosis. By counting the colony forming unit (CFU) and observing its morphology, bacterial and fungi levels are enumerated and their genera are identified. However, all these processes require skilled technicians and this conventional method shows several drawbacks: (1) high fluctuations in measured data,7,8 (2) long analysis time due to culture-based analysis, (3) likely misidentification of cultured morphology (since the identification is not based on DNA match or immunoassay), and (4) detecting only culturable microorganisms. These drawbacks often result in significant underestimations of airborne microbial concentrations, or false negative results.9,10 Furthermore, it is difficult to detect most of the sensitive microorganisms vulnerable to vitality loss by the impaction as well as non-culturable microorganisms. However, such microorganisms also need to be monitored since the allergenic, toxic and inflammatory responses can be provoked by exposure not only to the viable but also to non-viable microorganisms present in the air.5,6 Therefore, a highly specific and sensitive direct measurement technique is more desirable than the culture-based analysis system.
For the direct measurement of airborne biological/chemical particles, the lab-on-a-chip system11–14 may be very promising since it brings us many advantages over the conventional analytical technologies: short processing time, drastic reduction in reagent and sample consumption, small mass of the equipment, full automation, parallel analysis, high throughput, highly sensitive and specific output signals, and so on. However, a bottleneck in employing the lab-on-a-chip system for airborne particle monitoring is lack of efficient particle samplers which are compatible with the lab-on-a-chip system. The conventional techniques require not only a large volume of liquid in impinging particles into liquid or washing particles from agar surfaces for the follow-up analyses, but also numerous manual handling steps. Thus, they become impractical for such a fully automated lab-on-a-chip system that requires a micro-to-pico liter range volume of liquids and miniaturized electromechanical components.
Filtration or electrostatic collection seems to be more attractive in such microscale applications. Desai et al.,15 for example, reported a MEMS particle sampler in which particles of interest were collected on microfilter membranes with electrostatic electrodes and swept into a liquid solution by moving the air-to-liquid interface of the bulk liquid with an external pressure source. Although the collection efficiency was not very high and the devices easily failed since they were based on the continuous flow system associated with complicated mechanical structures and pressure sources, the technique of moving air-to-liquid interfaces rather than moving particles is more promising for particle sampling into liquid in microscale devices, especially in lab-on-a-chip systems. Besides, more implications for this technique are found in works by Leenaars and O'Brien16 and O'Brien and van den Brule17 with supportive experimental results. They achieved high sampling efficiencies with various particles on silicon surfaces by immersing silicon plates into a liquid. Immersing the silicon surfaces generates equivalent effects of moving the air-to-liquid interface. When the air-to-water interface sweeps particles on the solid surface, the interfacial tension acts on the particles as a detaching force against adhesion forces. Importantly, this technique is expected to be highly efficient, even with much smaller particles since the interfacial tension becomes dominant as the scale goes down.
In this paper, the interface sweeping technique is integrated with the electrowetting principle to sample particles on a solid surface. The electrowetting (to be exact, electrowetting-on-dielectric or EWOD18–20) principle is considered very effective in driving droplets, and thus many efforts have been made to utilize it for lab-on-a-chip systems.21–23 The dielectric surface can be reversibly switched from hydrophobic to hydrophilic in many cases by applying an electrical input to the electrodes underneath the dielectric layer. Upon this switching, the air-to-water interface on the dielectric solid surface can advance spontaneously and simultaneously pick up particles, as illustrated in Fig. 1. For example, the activation of the electrode under the left end of the droplet (the fourth electrode from the right in Fig. 1) makes the droplet wet over the activated electrode and then move to the left. Furthermore, sequential activations of addressable electrodes can produce a continuous movement in a programmed way. Therefore, the droplet can move around in any direction on a two-dimensional platform. In this case, the particle sampling may occur in the advancing as well as receding regions of the droplet as shown in Fig. 1.
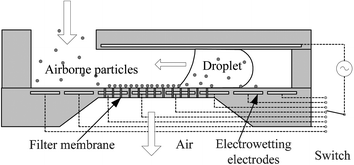 | ||
| Fig. 1 Envisioned airborne particle collection system. The droplet actuated by the electrowetting principle with patterned electrodes sweeps the particles on the filter membrane. Note that the particles can be sampled into the liquid in the advancing as well as receding regions of the droplet. The filter membrane surface in the advancing region turns hydrophilic under electrowetting actuation while the surface in the receding region remains hydrophobic. | ||
This sweeping system may be further integrated with a filter membrane (Fig. 1). Airborne particles of interest which are lager than the filter hole size are stopped on a filter membrane. Then, the sampled particles by electrowetting-actuated droplets can be automatically transported to an adjacent lab-on-a-chip system (not shown in Fig. 1) by driving the droplets. This automatic transportation will eliminate manual handling of the agar substrates or liquid solutions between particle sampling and analysis steps in the conventional system. Various fluidic operations and analysis steps can follow immediately, enabling on-chip analysis. Furthermore, this technique requires an extremely small volume of sampling liquid (micro-to-pico liter range) and no moving mechanical parts. As a result, this system will be highly compatible with the lab-on-a-chip systems based on continuous flows11–14 as well as droplets,22,23 probably enabling a fully automated portable monitoring system.
As fundamental issues in the course of developing the integrated particle sampler envisioned, this paper describes particle sampling from flat solid surfaces, not from the filter membrane (structured surface). In order to quantitatively assess the particle sampling efficiency by electrowetting-actuated droplets, three different types of microparticles are selected based on their hydrophobicity, and carefully deposited on a solid surface. Then, their sampling efficiency is experimentally measured after a water droplet actuated by electrowetting principle sweeps and samples the particles.
Testing device fabrication and experiment setup
In order to examine particle sampling on flat solid surfaces, testing devices are fabricated based on the standard lithographic microfabrication technology, as illustrated in Fig. 2. The testing devices are mainly made up of two parallel plates (top and bottom). The main fabrication process on the bottom plate consists of three steps: metallization and patterning of the driving electrodes, deposition and patterning of the dielectric layer, and deposition of the hydrophobic layer.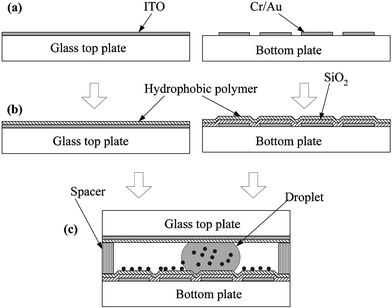 | ||
| Fig. 2 Fabrication process flow of the testing device: (a) top glass plate with ITO (indium tin oxide) layer/metallization and patterning of electrodes (Cr/Au) on the bottom plate; (b) deposition of oxide layer (SiO2) by PECVD on the bottom plate/deposition of polymer layer on both plates; and (c) integration of the top and bottom plates with spacers in between. | ||
For the driving electrodes, a chromium layer of 100 Å in thickness as an adhesion layer and a gold layer of 2000 Å in thickness are sequentially deposited on a glass wafer by an e-beam evaporator and then patterned by wet etching. Each planar driving electrode is of square type with an area of 1.4 × 1.4 mm2, separated by a 40 µm gap from the adjacent electrodes. Then, a 2000 Å silicon dioxide (SiO2) layer as the dielectric layer is deposited using a PECVD (plasma enhanced chemical vapor deposition) process, followed by opening of the oxide layer on electrode connection pads by wet etching in order to transmit activation signals to each driving electrode. Finally, the bottom plate is finished with a hydrophobic Teflon layer. Spin-coating of 2% Teflon solution (Teflon AF 1600® + Fluorocarbon solvent) results in the 2000 Å thick Teflon layer. This Teflon AF® layer acts as the dielectric layer as well. The relationship between the required voltage for reliable electrowetting actuations and the selection of dielectric layers has been discussed by Moon et al.24
Meanwhile, the top glass plate first coated with an ITO (indium tin oxide) layer is also spin-coated with a hydrophobic Teflon layer. The ITO layer covering the entire area of the top glass plate serves as grounding and its transparency makes droplet motions visible. The last fabrication process is to integrate the two plates (Fig. 2(c)). The first step in the integration is that dry particles are indirectly deposited on the bottom plate with particular care. To improve the uniformity in the deposited particle distribution, dry particles are first deposited on a dummy vinyl membrane which is afterwards turned upside down over the bottom plate. The particles are still adhered to the dummy membrane surface. By gently tapping the dummy membrane, the particles adhered on the dummy membrane surface are detached and land on the bottom plate. This method is simple, yet provides much better uniformity than the direct deposition method. The second step in the integration is that after pipetting a water droplet on the bottom plate the top glass plate is carefully pressed against the spacers for which four layers of the double-sided tape of about 150 µm thickness are placed in stacks in the four corners on the bottom plate. Therefore the gap between the top and bottom plates, which is around 600 µm, is defined by the spacers.
For droplet actuations, the integrated testing device is connected to the driving circuit system consisting of a personal computer, a digital output board (DAQPad-6507, National Instrument), and a custom-made interface circuit mainly made up of photo-coupled relays. A PC-based program generates control signals output through the digital output board. Then, the control signals switch the relays in the custom-made interface circuit that provide activation voltages to the electrodes on the testing device. The applied voltage to the electrodes is set at Vcc = 65 V AC (1 kHz).
Results and discussion
Proof of concept
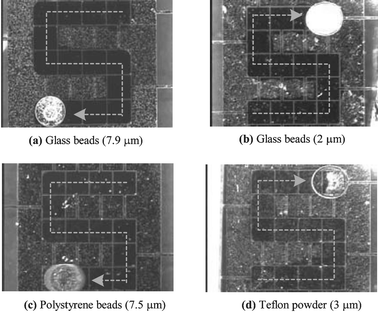
First of all, in order to prove the present sampling concept, two extreme cases of particle types in terms of hydrophobicity are selected: super† hydrophilic and super hydrophobic. For the super hydrophilic particle type, borosilicate glass beads (7.9 µm in diameter, 9000 series, Duke Scientific Inc.) of which the contact angle (α) with water is 14°25 are selected and tested. For the super hydrophobic particle type the borosilicate glass beads are coated with an amorphous Teflon layer as coated on the testing device. The contact angle α with water is around 120°, which is close to the maximum intrinsic contact angle attainable as of today. This angle is estimated based on the measured values with millimeter-size water droplets on flat amorphous Teflon layers.23,24The super hydrophilic (7.9 µm diameter glass beads) particles are first examined as demonstrated in sequentially captured pictures in Fig. 3. Our preliminary results have been previously reported at a conference.26 A similar sampling concept was recently introduced by another group27 but their result was very limited to only one particular type of particle of which the hydrophobic properties were not described in detail. An array of driving electrodes is patterned in such a manner that the droplet moves in a square path (Fig. 3(a)). Millions of borosilicate glass microspheres are then deposited on the bottom plate using the indirect method. After a droplet (∼500 nanoliters in volume) is in place, the top cover is pressed against the spacers (Fig. 3(b)). The solid surface of the bottom plate looks frosted due to the deposited particles. It is seen that some area around the droplet has already been cleaned. This is because the droplet is moved a little bit during manual droplet dispensing and top plate assembling. By sequentially activating the driving electrodes in a counter clockwise direction (65 V AC, 1 kHz), the droplet moves along the square path, simultaneously sweeping and sampling the particles into the droplet (Fig. 3(b)–(e)). The path on which the droplet has passed becomes clear, not frosted any more, indicating that very few particles remain on the path. Furthermore, this sampling technique effectively works even with clustered particles (Fig. 3(c)–(e)). Although particles are indirectly deposited using the dummy membrane, many particle clusters are still found as observed in the form of large circular dots in Fig. 3. However, these clustered particles are effectively picked up by the droplet as well. Finally, we can see that the sampled particles are suspended inside the droplet (Fig. 3(f)).
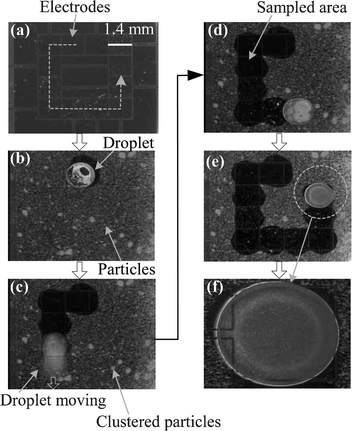 | ||
| Fig. 3 Sequential pictures of 7.9 µm diameter borosilicate glass bead sampling viewed through the transparent top glass plate. The particles (even clustered particles) on the flat solid surface can be efficiently sampled into the droplet. The dashed line in (a) indicates the path of the droplet; (f) close-up view of the droplet. The sampled particles are suspended within the droplet. | ||
Interestingly, it is observed during droplet moving that the electric field inside the droplet induced by electrowetting actuation signals generates violent motions in the suspended particles. This phenomenon gives us a positive effect that prevents the suspended particles from attaching to the surface again. Furthermore, whether this particle motion exists or not can be used as an indicator to determine whether or not particles are completely sampled into and suspended in the water droplet. When particles stay on the air-to-water interface or remain on the solid surface as deposited, violent particle motion is not observed. It is speculated that the electrokinetic force28 is responsible for this particle motion. The electric field for the electrokinetic force can be produced by electrowetting actuation signals without adding any additional electrodes. Of course, the frequency of the applied electric signal and the shape and arrangement of the electrodes need to be optimized if it is necessary to maximize the electrokinetic effect. However, the frequency of the applied signal can be chosen almost independently without significantly affecting electrowetting actuations since the electrowetting actuation is effective in a relatively wide range of applied frequency.
The present sampling method also works with Teflon-coated glass beads (super hydrophobic particle, 7.9 µm in diameter), as shown in Fig. 4. Due to difficulty in finding super hydrophobic spherical particles, they were prepared in-house by coating the borosilicate glass beads with an amorphous Teflon layer. The glass beads are immersed into a 0.2% Teflon AF® solution diluted with a fluorocarbon solvent and then dried in an ultrasonic bath to minimize the particle aggregation. As a result, the surface of the glass bead becomes super hydrophobic. Presumably, the contact angle on the Teflon-coated particle can be considered equal to that on the bulk Teflon material (around 120°23,24). As shown in Fig. 4(a), the coated particles are deposited on the bottom plate. Differently from the hydrophilic particle case, the Teflon-coated particles are easily aggregated as the white dots on the black background are much bigger than those in Fig. 3. The strong aggregation of the Teflon-coated particles was also confirmed under a high power microscope.
 | ||
| Fig. 4 Sequential pictures of particle sampling of Teflon-coated glass beads (super hydrophobic, 7.9 µm in diameter): (a) Teflon-coated particles and a water droplet are deposited; (b) the droplet is sampling the particles along the electrowetting-actuated path; (c) magnified view of the droplet. Most particles are adsorbed on the air-to-water interface. Note that the top glass cover is removed to enhance evaporation; (d) the sampled particles are piled up on the surface after the water droplet is completely evaporated. | ||
To confirm the sampling concept, the droplet is also actuated along an ‘s’-shaped pattern as shown in Fig. 4(b). As the droplet moves, the hydrophobic particles are also picked up. As a result, the ‘s’ path becomes clean, not very frosted any more. Other than the super hydrophilic particles that are absorbed or suspended inside the water solution, the picked-up super hydrophobic particles are staying (adsorbing) on the air-to-water interface of the droplet, as shown in Fig. 4(c). This is because the Teflon-coated particles are super hydrophobic. The interfacial tension prevents the particles from detaching from the air-to-water interface and moving inside the water solution. As a result, all the collected particles are accumulated on the air-to-water interface. This causes the following problems. The total distance a single droplet can sweep over is much shorter than the hydrophilic particle case since particle storage is restricted to the interface of the droplet which is not enough for all deposited particles. In order to sample all particles in a given area, many fresh droplets need to be provided. Furthermore, the particles on the interface hinder droplet movement as will be discussed in more detail later. It was observed many times that the droplet could not be actuated any more by electrowetting after travelling a certain distance, especially on surfaces highly deposited with the Teflon-coated particles.
Meanwhile, the present sampling method can be used to concentrate particles by incorporating an evaporation process. The top glass plate was deliberately removed to enhance evaporation (Fig. 4(c)). About 3 minutes later the water droplet was completely evaporated, as shown in Fig. 4(d), leaving a large pile of collected particles.
Sampling efficiency
In addition to the aforementioned two extreme cases, other types of particles were also examined, as tabulated in Table 1, in order to study the following issues: (1) to see whether or not the present sampling method works with the intermediate contact angle. Being intermediate between two extreme contact angles, polystyrene particles (DRI-CAL™, Duke Scientific Co.) of which the contact angle (α) is about 66°29 have been selected and examined; (2) to see the particle size effects on the sampling behaviour. Borosilicate glass beads of diameter 2 µm (9000 series, Duke Scientific Co.) were also examined and compared with the similar glass beads of different size (7.9 µm); (3) to re-confirm the sampling behaviour with the super hydrophobic particle. Since the Teflon-coated glass beads strongly aggregated together and may not be fully covered with the Teflon layer, although this could not be checked, 3 µm PTFE particles (polytetrafluoroethylene) powder, Zonyl® MP 1200, Dupont Inc.) were also examined. The estimated contact angle (α) is about 110°;25 (4) to quantify the sampling efficiency for each particle type listed in Table 1.| Borosilicate glass | Polystyrene | Teflon coated glass | Teflon powder | ||
|---|---|---|---|---|---|
| a Strong particle aggregation makes it difficult to quantify the sampling efficiency. b Averaged size: size distribution is relatively wide compared to the others. Over 80% of the total particle volume used is made up of the particles smaller than 9 µm and larger than 1 µm in size. | |||||
| Diameter/µm | 2 ± 0.5 | 7.9 ± 0.8 | 7.5 ± 0.5 | 7.9 ± 0.8 | 3b |
| Contact angle (α) with water/° | 14 | 14 | 66 | 120 | 110 |
| Sampling efficiency η (%) | 93.9 | 98.7 | 93.3 | N/Aa | 68.7 |
Fig. 5 shows the experimental results for the four different types of particles: 7.9 µm glass beads, 2 µm glass beads, 7.5 µm polystyrene beads and 3 µm PTFE particles (powder). The droplets are also actuated following through ‘s’ shaped patterns. It is seen that the 7.9 µm glass beads (Fig. 5(a)), the 2 µm glass beads (Fig. 5(b)) and the 7.5 µm polystyrene beads (Fig. 5(c)) are almost completely picked up by the droplets. After the droplets pass, their paths become clean, not frosted. For the PTFE particle case, however, the path still looks frosted, as shown in Fig. 5(d) and, more clearly, in Fig. 7, although a large number of particles have been picked up. These results can be also confirmed with the close-up pictures shown in Fig. 6. For comparison, a picture for each particle case is taken at the footprint edge of droplet. The right side of the broken line for each particle type is that on which each droplet has passed. Almost all the particles for the 2 µm and 7.9 µm glass bead and 7.5 µm polystyrene bead cases are effectively removed on the corresponding right side, as shown in Fig. 6(a)–(c), suggesting that the present sampling method is highly effective over a wide range of particle contact angle (α), at least up to 66°. However, the sampling efficiency seems to be lowered with the super hydrophobic particles. As shown in Fig. 6(d), numerous PTFE particles are still found on the right side of the broken line. Meantime, the particles on the left side remain intact as deposited. This area can be used as a base image to compare how many particles are sampled after droplet sweeping.
 | ||
| Fig. 5 Sampling results of different particle types. Droplets are moved along the ‘s’ letter path. Except for the Teflon powder case, the paths become clean (not frosted) after the droplets passed, showing the high sampling efficiency. The magnified views for the Teflon powder case are shown in Fig. 7. | ||
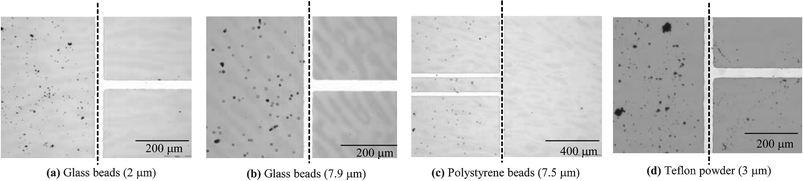 | ||
| Fig. 6 Close-up pictures at the footprint boundary of the moving droplet showing the particle sampling efficacy for each type of particle. The droplet has passed on the right side of each broken line. Almost all the deposited particles are removed on each right side except with the Teflon powder, while the particles on each left side remain intact as deposited. | ||
In order to quantify the sampling efficiency for each particle case, two areas for each particle case are taken along the edge of droplet footprint. One is from where the droplet swept and the other from where the droplet did not. Using the ‘touch count’ function in analySIS® FIVE image analysis software, the number of particles in the droplet-passed area is manually counted by m and the number of particles in the other area is counted by n. Then the sampling efficiency η is calculated by using η = (n − m)/n. For particle clusters, the total particle number was roughly estimated based on the cluster area. To minimize any marked deviation from the true values in the sampling efficiency, this procedure was repeated in ten different spots and the sampling efficiency was averaged out. The averaged sampling efficiency for each case is shown in Table 1. Consistent with the images shown previously, for the glass bead and polystyrene bead cases, the sampling efficiencies are all over 93%, in particular the highest efficiency of 98.7% was found for the 7.9 µm glass beads. There seems to be little size dependence in sampling, at least within our experimental range, considering only about 5% difference between the 2 µm and 7.9 µm glass beads. Also, polystyrene beads show the high sampling efficiency. As expected, however, with the PTFE particles the sampling efficiency is significantly lower than for the other types of particles. The reasons for this are discussed in the subsequent paragraphs. In the range of 66° < α < 110°, it is not clear at this moment how the sampling efficiency would change. There might be a rapid or gradual drop in the sampling efficiency. More in-depth studies are required to answer this question.
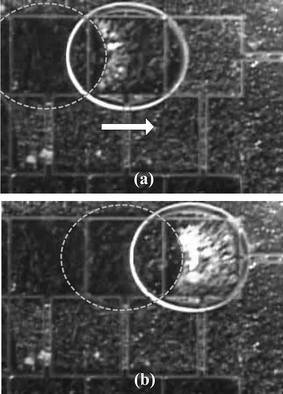
Since the camera used here is not fast enough, it is not sure whether particles are mostly sampled in the advancing region or the receding region for each particle type. However, for the PTFE particle case only, it turns out that most of the particles are sampled in the receding region, as shown in Fig. 7. The broken circles in Fig. 7 indicate the droplet positions prior to the next actuation. After actuation, the droplet moves one step right. Note in Fig. 7(a) that, after the droplet moves to the right, the particles (in white) gather in a certain area within the droplet contour, but not within the contour of the previous droplet position. As the droplet moves one more step right again, the particles gather again in the similar way, as shown in Fig. 7(b). Here, one interesting thing is that the gathered particles appearing in Fig. 7(a) disappeared in Fig. 7(b). Since the PTFE particles are super hydrophobic, they are supposed to stay (adsorb) on the air-to-water interface of the droplet, not inside the droplet. This means that the gathered particles stay in between the droplet and the solid surface, not inside the droplet, and then are removed from the solid surface when the droplet leaves the receding solid surface. Eventually, all the collected particles are staying on the air-to-water interface.
 | ||
| Fig. 7 Sequential close-up views of sampling the Teflon powder. The broken circles are drawn to depict the previous shape of the droplet before moving to the next right electrode. (a) It is seen inside the contour of the droplet that the particles gather. (b) The particles gathered in the previous step disappear and another group of particles gathers inside the droplet contour again, but not in the overlapping area with the previous droplet footprint. | ||
More details for this plausible scenario are described in Fig. 8. As the droplet moves right, a circulating fluid motion in a clockwise direction is induced in the lower part of the droplet while a fluid motion occurs in a counter clockwise direction in the upper part. Therefore the particles in the advancing region of the droplet experience the downward flow to the solid surface and then are held down on the lower interface of the droplet. Since the particles are super hydrophobic, they cannot be absorbed into the droplet. It is speculated that this configuration explains the low sampling efficiency for the hydrophobic particles. If there is a wide distribution in deposited particle size (as described in Table 1, for the PTFE particle case the standard deviation in particle size is much larger than the other cases tested), relatively smaller particles on the solid surface have less chances to be touched by the air-to-water interface than larger particles since the interface is levitated by larger particles. This can lower the sampling efficiency. With better uniformity in particle size, the sampling efficiency would be higher.
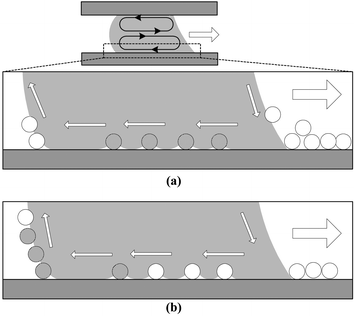 | ||
| Fig. 8 Possible scenario of the super hydrophobic particle interaction with the moving droplet. (a) Fluid motions circulating in clockwise and counter clockwise directions are induced in the lower and upper parts of the droplet, respectively. The particles in the advancing region of the droplet experience the downward flow to the solid surface and are held underneath the droplet since they are super hydrophobic. (b) The particles underneath the droplet reach the receding region of the droplet and then are lifted up by the upward fluid motion as the droplet moves right. | ||
As the droplet moves further, the particles (shaded particles in Fig. 8) reach the receding region of the droplet and are then lifted up from the solid surface. The interfacial tension is strong enough to detach the particles from the surface. In contrast to the advancing region, the particles experience the upward fluid motion. In this scenario, the advancing region is where the particles are likely to be accumulated due to the circulating flows in the droplet. The particle accumulation in the advancing region will be one of the main causes hindering the droplet from advancing. Apparently, the particles underneath the droplet, especially near the advancing region, reduce the contacting area of the droplet advancing front to the solid surface. As a result, the electrowetting driving force will be lowered.
Conclusions
In this paper, a novel particle sampling technique is described which may be highly compatible and easily integrated with the lab-on-a-chip system. With this technique, particles on the solid surface are swept and sampled by electrowetting-actuated moving droplets. We demonstrate that glass beads (super hydrophilic particles of 2 and 7.9 µm in diameter with about 14° contact angle) and polystyrene beads (intermediate hydrophilic particles of 7.5 µm in diameter with about 70° contact angle) can be successfully sampled from a solid surface with high sampling efficiencies (over 93%) while droplets are driven along a programmed path by the electrowetting principle. Also, PTFE (3 µm in size) and Teflon-coated (7.9 µm in diameter) particles which are super hydrophobic (over 110° in contact angle) can be sampled by electrowetting-actuated droplets. However, the sampling efficiency for the PTFE particles is relatively lower (∼69%) than the glass and polystyrene beads. This may be due to the non-uniformity in size and the hydrophobicity of the particles. The collected particles staying (adsorbing) on the air-to-water interface hinder the droplet from advancing and sampling more particles from the solid surface. Considering the results with two different sizes of glass beads (2 µm and 7.9 µm), the effect of the particle size on the sampling efficiency does not seem to be substantial within the present experimental range of particle size.Acknowledgements
This work was partially supported by the John A Swanson Center for Micro and Nano Systems and Central Research Development Fund at the University of Pittsburgh. The authors wish to deeply thank Dr Woosik Kim for helping fabricate the testing devices.References
- S. K. Mishra, L. Ajello, D. Ahearn, H. Burge, V. P. Kurup, D. L. Pierson, D. L. Price, R. B. Samsons and K. F. Switzer, Environmental mycology and its importance to public health, J. Med. Vet. Mycol., 1992, 30, 286–305 Search PubMed.
- W. D. Griffiths and A. L. DeCosemo, The assessment of bioaerosols: A critical review, J. Aerosol Sci., 1994, 25(8), 1425–1458 CAS.
- Bioaerosols, ed. H. A. Burge, Lewis Publishers, Boca Raton, FL, 1995 Search PubMed.
- H. A. Burge, D. L. Pierson, T. O. Groves, K. F. Strawn and S. K. Mishra, Dynamics of airborne fungal populations in a large office building, Curr. Microbiol., 2000, 40, 10–16 CrossRef CAS.
- C. A. Robbins, L. J. Swenson, M. L. Neally and R. E. Gots, Health effects of mycotoxins in indoor air: a critical review, Appl. Occup. Environ. Hyg., 2000, 15, 773–784 CrossRef CAS.
- R. L. Gorny, T. Reponen, K. Willeke, D. Schmechel, E. Robine, M. Boissier and S. A. Grinshpun, Fungal fragments as indoor air biocontaminants, Appl. Environ. Microbiol., 2002, 68, 3522–3531 CrossRef CAS.
- S. K. Mehta, S. K. Mishra and D. L. Pierson, Evaluation of three portable samplers for monitoring airborne fungi, Appl. Environ. Microbiol., 1996, 62(5), 1835–1838 CAS.
- S. K. Mehta, D. M. Bell-Robinson, T. O. Groves, L. D. Stetzenbach and D. L. Pierson, Evaluation of portable air samplers for monitoring airborne culturable bacteria, Am. Ind. Hyg. Assoc. J., 2000, 61, 850–854 CrossRef CAS.
- T. J. Mukoda, L. A. Todd and M. D. Sobsey, PCR and gene probes for detecting bioaerosols, J. Aerosol Sci., 1994, 25(8), 1523–1532 CrossRef CAS.
- M. P. Schafer, J. E. Fernback and M. K. Ernst, Detection and characterization of airborne Mycobacterium tuberculosis H37Ra particles, a surrogate for airborne pathogenic M. tuberculosis, Aerosol Sci. Technol., 1999, 30, 161–173 CAS.
- R. F. Service, Labs on a chip: Coming soon: The pocket DNA sequencer, Science, 1998, 282, 399–401 CrossRef.
- A. W. Chow, Lab-on-a-chip: Opportunities for chemical engineering, AIChE J., 2002, 48(8), 1590–1595 CrossRef CAS.
- R. Ehrnstrom, Miniaturization and integration: challenges and breakthroughs in microfluidics, Lab Chip, 2002, 2, 26N–30N RSC.
- A. R. Kopf-Sill, Successes and challenge of lab-on-a-chip, Lab Chip, 2002, 2, 42N–47N RSC.
- A. Desai, S.-W. Lee and Y.-C. Tai, An air-to-liquid MEMS particle sampler,Proceedings of 13th MEMS Conference, Sendai, Japan, 2000, pp. 733–738 Search PubMed.
- A. F. M. Leenaars and S. B. G. O'Brien, Particle removal from silicon substrates using surface tension forces, Philips J. Res., 1989, 44, 183–209.
- S. B. G. O'Brien and H. A. A. van den Brule, A mathematical model for the cleansing of silicon substrates by fluid immersion, J. Colloid Interface Sci., 1991, 144(1), 210–221 CrossRef CAS.
- M. G. Lippmann, Relations entre les phénomènes electriques et capillaires, Ann. Chim. Phys., 1875, 5(11), 494–549 Search PubMed.
- B. Berge, Electrocapillarity and wetting of insulator films by water, C. R. Acad. Sci. Ser. II, 1993, 317, 157–163 Search PubMed.
- F. Mugele and J.-C. Baret, Electrowetting: from basics to applications, J. Phys.: Condens. Matter, 2005, 17, R705–R774 CrossRef CAS.
- G. Ehrenman, Shrinking the lab down to size, Mech. Eng., 2004, 126, 26–29 Search PubMed.
- M. G. Pollack, R. B. Fair and A. D. Shenderov, Electrowetting-based actuation of liquid droplets for microfluidic applications, Appl. Phys. Lett., 2000, 77(11), 1725–1726 CrossRef CAS.
- S. K. Cho, H. Moon and C.-J. Kim, Creating, transporting, cutting, and merging liquid droplets by electrowetting-based actuation for digital microfluidic circuits, J. Microelectromech. Syst., 2003, 12, 70–80 CrossRef.
- H. Moon, S. K. Cho, R. L. Garrell and C.-J. Kim, Low voltage electrowetting-on-dielectric, J. Appl. Phys., 2002, 92(7), 4080–4087 CrossRef CAS.
- W. J. O'Brien, Capillary penetration of liquids between dissimilar solids, Doctoral Dissertation, Ann Arbor, University of Michigan, 1967 (Univ. Microfilm No. 6715666) Search PubMed.
- Y. Zhao and S. K. Cho, Micro particle sampling using electrowetting-actuated droplet sweeping, The 13th International Conference on Solid-State Sensors, Actuators and Microsystems (Transducers 2005), Seoul, Korea, June 5–9, 2005, pp. 129–134 Search PubMed.
- R. B. Fair, A. Khlystov, V. Srinivasan, V. K. Pamula and K. N. Weaver, Integrated chemical/biochemical sample collection, pre-concentration, and analysis on a digital microfluidic lab-on-a-chip platform, presented at OpticsEast 2004, Conference 5591-17, Philadelphia, October 25–28, 2004.
- H. Morgan and N. G. Green, AC Electrokinetics: Colloids and Nanoparticles, Research Studies Press Ltd., Baldock, Hertfordshire, England, 2003 Search PubMed.
- R. Arshady, Microsperes for biomedical applications: preparation of reactive and labelled microspheres, J. Biomater., 1993, 14, 5–15 Search PubMed.
- J. Bico, C. Marzolin and D. Quéré, Pearl drops, Europhys. Lett., 1999, 47(2), 220–226 CrossRef CAS.
Footnote |
| † For convenience, the term ‘super’ is used to classify the extent of particle hydrophobicity (or hydrophilicity) using the intrinsic contact angle (α). In this paper, super hydrophilic is used for 0 ≤ α ≤ 30°, intermediate hydrophilic for 30° < α ≤ 90°, and super hydrophobic for α > 110°. The meaning of ‘super’ is different from what is used in describing the wettability on micro/nano-structured surfaces with the apparent contact angle.30 |
| This journal is © The Royal Society of Chemistry 2006 |