DOI:
10.1039/B509939K
(Paper)
Lab Chip, 2006,
6, 131-136
Shear force induced monodisperse droplet formation in a microfluidic device by controlling wetting properties
Received
12th July 2005
, Accepted 11th October 2005
First published on 1st November 2005
Abstract
Perpendicular flow is used to induce oil droplet breakup by using a capillary as water phase flow channel. It is a new route to produce monodisperse emulsions. The wetting properties of the fluids on the walls are exceedingly important parameters. Depending on the oil and water flow rates, different spatial distributions of the two phases as laminar, plugs, cobbles and drops, are obtained. The effects of two-phase flow rates on plugs and drop size are studied, and the different droplet formation mechanisms of plug flow and drop flow are discussed. Two quantitative equations utilized to predict the droplet size are developed.
Introduction
Droplets of one fluid in a second immiscible fluid are useful in a wide range of applications, such as drug delivery systems, food emulsions, atomic spectrometry and so on. Typically, a surfactant is essential to stabilize the droplets against coalescence as they are thermodynamically metastable. Conventional emulsification techniques use inhomogeneous extensional and shear flows to rupture droplets, commonly resulting in droplets with a wide size distribution. However, many important potential uses of emulsions require precise control over droplet size and polydispersity. Several strategies have been proposed to reduce the polydispersity of droplets.1–3 The distribution of drop fragments resulting from breakup in shear flow was studied,4 numerical simulations have been developed,4–6 and monodisperse emulsions of large numbers of droplets with controlled sizes were generated in flow using the tip-streaming phenomenon.7 Recently, the growing trends in the miniaturization of experimental systems and the development of advanced functional materials have facilitated the expansion of droplet-based applications from the traditional emulsions to microanalysis, on-chip separation, and protein crystallization.8–10 In these devices, the interaction between two immiscible fluids can be used to introduce nonlinearity and instability.11–14 The control of small volumes of fluids and the understanding of multiphase flows are required. Liquid–liquid dispersions in microfluidic devices have been generated via a number of methods, including geometry-dominated breakup,12,15,16 crossflow rupturing through microchannel arrays,17 hydrodynamic flow focusing through a small orifice,14,18,19 and two-phase crossflowing rupture streams in T-junction microchannels.8,10,11,13,20 Highly uniform emulsion droplets with standard deviations less than 5% can be generated.11,12,15,16 It has also been found that the droplet formation of a dispersed phase was affected by all the parameters relevant to the drag force of the continuous phase and the momentum of the dispersed phase, such as flow rates, viscosities, and the interfacial tension.11,12,15,16
Despite the significant advances made in the past few years, major challenges remain in the development of microchannel droplet formation techniques and its mechanism, such as the difficulty of controlling production rate, the dependence of droplet size on channel size and geometry, and effects of wetting properties on two-phase flow patterns. In this paper, we develop a new flow route: so-called perpendicular shear force induced droplet formation in T-junction microchannels. The perpendicular shear force caused by a water phase and interfacial tension between two immiscible fluids was used to introduce nonlinearity and instability for two-liquid phase flow in T-junction microchannels, and the oil phase was broken into plugs or drops at the junction of two microfluidic channels. The water phase partially obstructed the oil phase flow at the junction, but was not broken off at the channel interface as in traditional crossflow devices. Unexpectedly, oil droplet formation was achieved by the water phase shear forces in perpendicular direction to the oil phase flow, generating micro-scale oil droplets. Although the system remains at low Reynolds number, the flow is nonlinear because of interactions at the interface of the two fluids. We also discovered that the wetting properties of the fluids on the walls are exceedingly important parameters. Additionally, the effects of the two-phase flow rates on droplet size were studied, and the droplet formation mechanism has been discussed.
Materials and methods
The experiments were performed in T-junction microchannels fabricated on 50 mm × 30 mm × 10 mm polymethyl methacrylate (PMMA) using an end mill (kindly provided by Department of Biological Sciences and Biotechnology, Tsinghua University, Beijing, China). Fig. 1 shows a micrograph of the T-junction section of the channels. The oil phase flow channel dimensions are approximately 200 µm wide × 150 µm high. In order to increase the shear force on oil phase flow by the water phase, a quartzose capillary with inner-diameter of 40 µm was embedded into the perpendicular channel (200 µm wide × 150 µm high) as the water phase flow channel. After that, the microfluidic device was sealed using another PMMA thin plate with 1 mm thickness. Finally, the microfluidic chip was sealed by overnight curing at 80 °C using high pressure thermal sealing techniques. Two microsyringe pumps were used to pump the two phases into the microfluidic device. n-Octane was injected into the bottom channel, whereas deionized water with different concentrations of sodium dodecyl sulfate (SDS) was injected into the perpendicular capillary. The surfactant molecules tend to collect at the two-phase interface, with their polar heads in the water phase and their tails in the oil phase. Experiments were carried out with a microscope at magnifications from 20× to 200×. A high-speed CCD video camera was connected to the microscope and the images were recorded with a frequency of 200 images per second. The length of oil plugs or the diameter of oil drops in the channel were measured from microscope images.
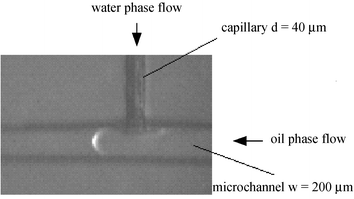 |
| | Fig. 1 Micrograph of the cross section of the microfluidic device. | |
Effect of surfactant concentration on two-phase flow properties
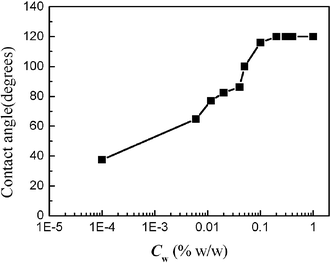
In ordinary membrane (or microchannel array) emulsification processes, the effect of the interfacial tension on droplet size is significant, and the droplet diameter increases with an increase of the interfacial tension.21,22 On the other hand, the interfacial tension decreases with an increase of surfactant concentration in the water phase. So the droplet size decreases with an increase of surfactant concentration. In order to examine how the surfactant concentrations affect two-phase flow properties in microchannels, different concentrations of SDS in the water phase were used in our experiments. The evolution of the interfacial tension of n-octane/water–SDS with different surfactant concentrations is shown in Fig. 2. It clearly shows that the interfacial tension decreases with increasing surfactant concentration. When the surfactant concentration was varied from 10−3 to 0.05% w/w, the interfacial tension decreased to a minimum of 2.54 mN m−1, and the interfacial tension retained the minimum value at higher concentrations. This is mainly because the adsorption of the surfactant at the o/w interface is saturated when the surfactant concentration approaches the critical micellar concentration (Cmc). For the working system the value of Cmc is close to 0.05% w/w. Fig. 3 shows the effect of surfactant concentration on the two-phase flow properties when the oil flow rate was 10 µL min−1 and the water flow rate was 20 µL min−1. The droplet formation process was not observed when the surfactant concentration was less than 0.04% w/w, while isolated oil plugs were obtained at higher surfactant concentration. We continuously varied the surfactant concentration to investigate how the system evolves from structureless to structured regimes. At lower surfactant concentrations, disordered states were reached, with the oil phase partially adhered to the channel walls. At higher concentrations, well-defined oil plugs were formed, continuously moving with the water phase flow. For this particular study, the transition between the disordered and ordered regimes takes place at a concentration around 0.05% w/w (Cmc). The phenomena are very different to the emulsification process in macro-channels.21,22 To explain the unexpected results, the contact angles of the oil phase, immersed in water (with different concentrations of SDS), in contact with the PMMA wall surface, were measured by using a contact angle meter, as shown in Fig. 4. At low concentration, the contact angle is less than 90°, so oil wets the wall surface. The contact angle increases with the increase of surfactant concentration. Above a concentration of 0.05% w/w (Cmc), the contact angle sharply increases up to more than 90° (with a maximum of 120°). So it can be concluded that the wetting properties of oil on the wall surface determine whether the ordered flow of oil drops can be obtained. When the contact angle is less than 90°, only disordered flow patterns can be seen. Whereas when the contact angle is more than 90°, ordered flow of drops can be obtained, similarly to ref. 9. This shift is worthwhile noting, to form ordered patterns, one must start with surfactant concentrations well above Cmc. So in our subsequent experiments, the surfactant concentration was retained at 1% w/w.
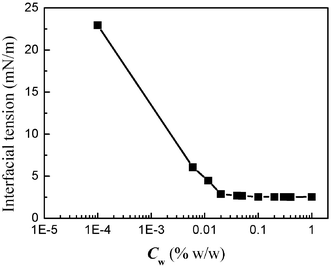 |
| | Fig. 2 Effect of surfactant concentration on interfacial tension. | |
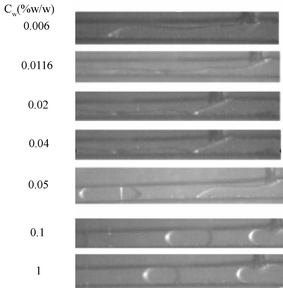 |
| | Fig. 3 Effects of surfactant concentration on two-phase flow patterns. | |
Two-phase flow patterns
Depending on the oil and water flow rates, different spatial distributions of the two phases were obtained in our experiments. Fig. 5 shows the situation of different observed flow patterns. We found that the flow patterns are dependent on the ratio of water phase flow rate Qw to oil phase flow rate Qo. Oil–water laminar flow is obtained at low water flow rates and high oil flow rates, low values of Qw/Qo as shown in the upper left corner of Fig. 5. In these situations, shear forces from the vertically flowing water phase on the oil phase flow are low and cannot rupture the oil phase to plugs, so the water phase flows stably as a thin layer parallel to the oil phase flow in the channel. As Qw/Qo is increased, the shear force is high enough to induce the oil phase to isolate into plugs because their diameters are greater than the microchannel width. Once a plug is formed, it is entrained by the flow, and its shape does not evolve in the channel. When we continuously increase values of Qw/Qo, oil drops as cobbles and spheres can be observed, where cobbles are the transition between plugs and drops. Here the regime is determined by the hydrodynamical characteristics taking place in the intersection region: the interfacial instability, wetting properties, viscous forces caused by vertical water phase flow and interfacial tension with the oil phase flow. To quantify the droplet sizes in this new droplet formation process, we investigated the effects of the two-phase flow rates on oil plug lengths and drop diameters as two-phase flow patterns were in plugs and drops regimes respectively.
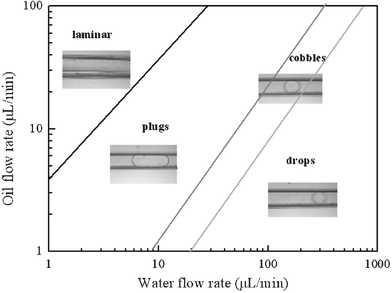 |
| | Fig. 5 Flow patterns with different two-phase flow rates at surfactant concentration of 1% w/w. We form four well-defined flow patterns when the oil phase and water phase flow rates are in the ranges of 1–100 µL min−1 and 1–1000 µL min−1 respectively. The flow patterns are mainly dependent on the ratio of water phase flow rate Qw to oil phase flow rate Qo. | |
Effect of flow rates on droplet size and discussion of different droplet formation mechanisms
Fig. 6a and 6b show micrographs of oil plugs under different total flow rates at a constant value of Qw/Qo and under different water phase flow rates with a fixed oil flow rate of 20 µL min−1 respectively. Fig. 7a and 7b show the effects of total flow rate and values of Qw/Qo on oil plug length. The plug length decreases with increasing Qw/Qo (Fig. 6b and 7b), but is virtually independent of the total flow rate (Fig. 6a and 7a). In previous crossflow droplet formation processes in similar T-junction microchannels20,23–25 and macrochannels,21,22 the dispersed plug's length was influenced by total flow rate. The most likely reason for the difference is that the wall effects and interfacial tension in our perpendicular shear droplet breakup process are more dominant over the shear caused by crossflow when the water phase flow rate is low. In this perpendicular shear force induced droplet formation process, the plug length could be easily controlled by varying the values of Qw/Qo. Shorter plugs can be formed when the water phase flow rate is greater than that of the oil stream, and long plugs formed when the oil flow rate is greater than the water flow rate. Also the production rate could be increased easily with the increase of total flow rate at a certain value of Qw/Qo. When we increase the total flow rate to 600 µL min−1 keeping the value of Qw/Qo at 5, the production rate can reach as much as 200 s−1.
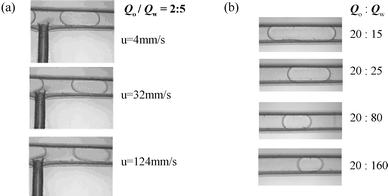 |
| | Fig. 6 Micrographs illustrating the influences of two-phase flow rates on oil plugs: (a) total flow velocity and (b) water flow rate. | |
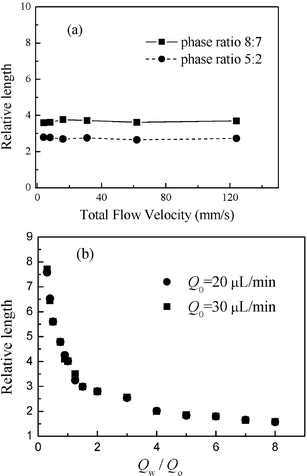 |
| | Fig. 7 Influences of two-phase flow rates on oil plug length (a) total flow rate and (b) ratio of water and oil flow rate. All measurements of length are reported relative to the width of channels (200 µm). Relative size is defined as the ratio of plug length to channel width. | |
To predict the influence of Qw/Qo on plug lengths, exploration of the oil plug formation mechanism is required. We imaged the intersection and observed the evolution of the oil–water interface shape. The changes of minimal width wm of the oil collapsing neck with breakup time t were recorded. From the recorded images, a single plug breakup process can be described by three stages (Fig. 8). Firstly the oil thread penetrates into the outlet channel (Fig. 8a). Secondly, the vertical water flow causes the development of a clear oil thread neck and wm decreases at a certain rate (Fig. 8b–8d). In the third stage, the oil thread collapses and breaks rapidly, retracts upstream in the outlet channel, and the whole process starts again (Fig. 8e–8f). The quantitative evolution of wm is shown in Fig. 8g.
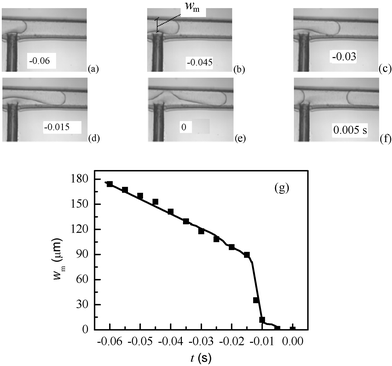 |
| | Fig. 8 Evolution of the oil–water interface and minimal width wm with breakup time when oil phase flow rate was 16 µL min−1 and water phase flow rate 40 µL min−1. (a)–(f) Micrographs of the oil–water interface at the intersection of channels, where the moment of breakup was set as zero in time. (g) The relationship between wm and breakup time t in a whole breakup process. Here wm is the minimum width of the oil thread during breakup process. | |
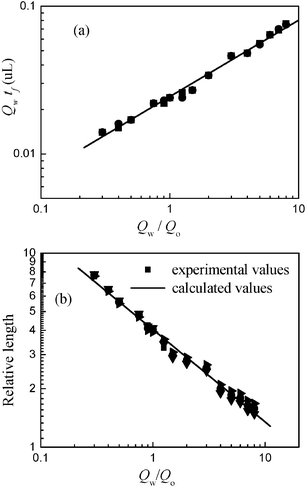
From the plug formation process shown in Fig. 8 one can see that the main effect on plug sizes is water–oil interface shape during collapse, which is dependent on two-phase flow rate and contact angle between oil and the microchannel wall for a given working system. We analyzed all the interface shapes in different total flow rates and values of Qw/Qo, and found that the interface shape is only dependent on the value of Qw/Qo. The variety of total flow rates at a certain value of Qw/Qo does not influence the interface shape apparently. So we can quantify the dynamics of this process by identifying the droplet formation time tf with values of Qw/Qo. Then the relevant water flow volume during oil plug formation time tf is dependent on Qw/Qo. Fig. 9a gives the relationship between Qw
×
tf and Qw/Qo for all experimental data. By fitting the experimental values, Qw
×
tf can be predicted with the following equation:
| | | Qw
×
tf (µL) = 0.024(Qw/Qo)0.5 | (1) |
 |
| | Fig. 9 (a) The relationship between Qw
×
tf and Qw/Qo. (b) Comparison between experimental values and calculated values from eqn (3). All experimental data in plugs regime were used. | |
And the final oil plug volume Vd can be calculated as Vd = Qo
×
tf. So the oil plug volume and oil plug relative length ld/w are approximately equal as:
| | | Vd (µL) = 0.024(Qw/Qo)−0.5 | (2) |
We assume the oil plug is square, so Vd = ld
×
w
×
h, then
| | | ld/w = Vd/w/w/h = 4.07(Qw/Qo)−0.5 | (3) |
From eqn (3), the plug sizes can be precisely predicted (Fig. 9b). So it is easy to quantify the droplet sizes in our vertically shear force induced droplet breakup process when the two-phase flow pattern is in the plugs regime.
Furthermore, we investigated the effects of two-phase flow rates on drop diameters when the two-phase flow pattern was in the drops regime. Fig. 10a and 10b show the micrographs of oil drops in different total flow rates at a constant value of Qw/Qo (20) and in different water phase flow rates at a fixed oil flow rate of 1 µL min−1 respectively. Fig. 11 shows the effects of two-phase flow rates on oil droplet diameter Dd. The drop diameter decreases linearly with increasing Qw, while the oil phase flow rate Qo has little influence on droplet size. Drop diameter also decreases with increasing total flow rate. The results are very different to those for plugs flow. Fig. 12 shows the drop formation process, it is similar to crossflow rupture droplet formation in T-junction microchannels.11,20,25 In this process, drops are small enough that the hydrodynamic forces exerted by the channel are not important and breakup fully relies on the interaction of the shear force of the continuous flow and interfacial tension.
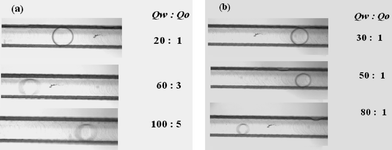 |
| | Fig. 10 Micrographs illustrating the influences of two-phase flow rates on oil drop sizes. (a) Effect of total flow rate when the value of Qw/Qo is fixed at 20. (b) Effect of water flow rate at a fixed oil flow rate of 1 µL min−1. The units of flow rates in the figures are all µL min−1. | |
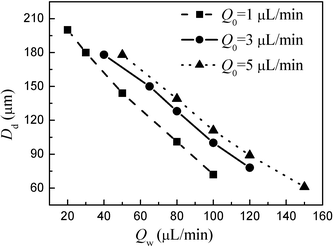 |
| | Fig. 11 Influences of two-phase flow rates on oil drop diameters. | |
 |
| | Fig. 12 Micrographs of the oil drop formation process when the oil phase flow rate is 3 µL min−1 and the water phase flow rate 40 µL min−1. The time interval of each picture is 0.03 s. | |
A dimensionless number, namely the capillary number (Ca), which is the ratio of viscous-to-interfacial tension stress, can be used to predict the droplet diameter.
Where μ is the viscosity of continuous flow (here the water phase), γ is the oil/water interfacial tension, and uc is the velocity of continuous flow in the capillary channel (here the water phase). In our experiments, μ = 10−3 kg m s−1, γ = 2.54 × 10⁻³ N m−1, and uc = uw
≈ 0.2–3.0 m s−1 (30–500 µL min−1). The drop diameters are then described by the equation according to the crossflow droplet rupture process11,25
Where Di is the hydraulic diameter of the intersection of the microchannel, here Di = Dcapillary = 40 µm. From eqn (4) and (5) we can see that the droplet diameter decreases with increasing Qw, which is in agreement with our experimental results (Fig. 11). Fig. 13 shows the comparison between the predicted and actual drop size. The predicted droplet sizes are within a factor of 1.5 of experimental droplet sizes. So it is appropriate to predict drop sizes of our vertically flow induced droplet breakup process using the scaling law of crossflow droplet formation in T-junction microchannels when two-phase flow is in the drops regime.
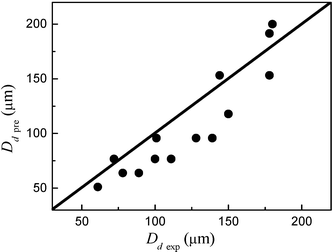 |
| | Fig. 13 Comparison between predicted and actual drop size when two-phase flow is in the drops regime. The predicted sizes were calculated using eqn (5). | |
Conclusions
We have developed a new route for producing monodisperse emulsions by using a capillary as water phase flow channel. Perpendicular flow was used to induce oil droplet breakup. Wetting properties of the fluid to the walls could determine the two-phase flow conditions. Ordered flow of drops can only be formed when the contact angle is more than 90°. The flow patterns are strongly dependent on the ratio of water phase flow rate Qw to oil phase rate Qo. Different spatial distributions of the two phases as laminar, plugs, cobbles and drops flow, were obtained as the value of Qw/Qo changed in our experiments. The different droplet formation mechanisms of plugs flow and drops flow have been discussed, and two quantitative equations were utilized to predict the droplet size accurately. The plug length decreases with increasing Qw/Qo, but is independent of the total flow rate when the two-phase flow pattern is in the plugs regime, and the oil plug volume approximates as Vd (µL) = 0.024(Qw/Qo)−0.5. The drop diameter decreases with increasing Qw and total flow rate when the two-phase flow pattern is in the drops regime, and the drop diameter can be described by the equation Dd
≈
Di/Ca.
The understanding of the influences of flow, contact angle and wetting properties on the dynamics of plug and drop formation is very important to the theoretical understanding of the scaling law of droplet formation in microfluidic devices, especially when it is in the plugs regime. This might lead to applications in precise control of droplet sizes in small volumes.
Acknowledgements
We would like to acknowledge the Department of Biological Sciences and Biotechnology in Tsinghua University for providing the microfluidic device. We also gratefully acknowledge the support of the National Science Foundation of China (20476050, 20490200) and SRFDP (20040003032) for this work.
References
- T. Nakashima, M. Shimizu and M. Kikizaki, Key Eng. Mater., 1991, 61, 513.
- T. G. Mason and J. Bibette, Langmuir, 1997, 13, 4600 CrossRef CAS.
- P. B. Umbanhowar, V. Prasad and D. A. Weitz, Langmuir, 2000, 16, 347 CrossRef CAS.
- V. Cristini, S. Guido, A. Alfani, J. Blawzdziewicz and M. Loewenberg, J. Rheol., 2003, 47, 1283 CrossRef CAS.
- V. Cristini, J. Blawzdziewicz and M. Loewenberg, Phys. Fluids, 1998, 10, 1781 CrossRef CAS.
- V. Cristini, J. Blawzdziewicz and M. Loewenberg, J. Comput. Phys., 2001, 168, 445 CrossRef CAS.
- R. A. de Bruijn, Chem. Eng. Sci., 1993, 277, 48.
- H. Song and R. F. Ismagilov, J. Am. Chem. Soc., 2003, 125, 14613 CrossRef CAS.
- X. Chen, H. Wu, C. Mao and G. M. Whitesides, Anal. Chem., 2002, 74, 1772 CrossRef CAS.
- B. Zheng, L. S. Roach and R.F. Ismagilov, J. Am. Chem. Soc., 2003, 125, 11170 CrossRef CAS.
- T. Thorsen, R. Roberts, F. Arnold and S. Quake, Phys. Rev. Lett., 2001, 86, 4163 CrossRef CAS.
- S. Sugiura, M. Nakajima, S. Iwamoto and S. Seki, Langmuir, 2001, 17, 5562 CrossRef CAS.
- R. Dreyfus, P. Tabeling and H. Willaime, Phys. Rev. Lett., 2003, 90, 144505/1 CAS.
- S. L. Anna, N. Bontoux and H. A. Stone, Appl. Phys. Lett., 2003, 82, 364 CrossRef CAS.
- D. R. Link, S. L. Anna, D. A.. Weitz and H. A. Stone, Phys. Rev. Lett., 2004, 92, 054503/1 CAS.
- Y. C. Tan, J. Fisher, A. L. Lee, V. Cristini and A. P. Lee, Lab Chip, 2004, 4, 292 RSC.
- T. Kawakatsu, Y. Kikuchi and M. Nakajima, J. Am. Oil Chem. Soc., 1997, 74, 317 CrossRef CAS.
- Q. Xu and M. Nakajima, Appl. Phys. Lett., 2004, 85, 3726 CrossRef CAS.
- P. Garstechi, H. A. Stone and G. M. Whitesides, Phys. Rev. Lett., 2005, 94, 164501 CrossRef.
- T. Nisisako, T. Torii and T. Higuchi, Lab Chip, 2002, 2, 24 RSC.
- S. M. Joscelyne and G. Tragardh, J. Membr. Sci., 2000, 169, 107 CrossRef CAS.
- J. H. Xu, G. S. Luo, G. G. Chen and B. Tan, J. Membr. Sci., 2005, 249, 75 CrossRef CAS.
- J. R. Burns and C. Ramshaw, Lab Chip, 2001, 1, 10 RSC.
- J. D. Tice, A. D. Lyon and R. F. Ismagilov, Anal. Chim. Acta, 2004, 507, 73 CrossRef CAS.
- V. Cristini and Y. C. Tan, Lab Chip, 2004, 4, 257 RSC.
|
| This journal is © The Royal Society of Chemistry 2006 |
Click here to see how this site uses Cookies. View our privacy policy here. 


