Ligand effect on the kinetics of hydroperoxochromium(III)–oxochromium(V) transformation and the lifetime of chromium(V)†
Kelemu Lemma, Arkady Ellern and Andreja Bakac*
Chemistry Department, Iowa State University of Science and Technology, Ames, IA 50011, USA. E-mail: bakac@ameslab.gov
First published on 28th October 2005
Abstract
A macrocyclic superoxochromium complex L2(H2O)CrOO2+ (L2 = meso-Me6-[14]aneN4) is generated from L2Cr(H2O)22+ and O2 with kon = (2.80 ± 0.07) × 107 M−1 s−1. One-electron reduction of L2(H2O)CrOO2+ produces a transient hydroperoxo complex that readily undergoes intramolecular conversion to L2Cr(V), k1 = 1.00 ± 0.01 s−1 in acidic aqueous solutions, and 0.273 ± 0.010 s−1 at pH >7, with an apparent pKa of 5.9. The decay of L2Cr(V) in the pH range 1.3–6.2 obeys the rate law, −d[L2Cr(V)]/dt = (0.0080 (± 0.0049) + 8.19 (± 0.13) [H+])[L2Cr(V)]. Both the kinetics of formation and lifetime of L2Cr(V) are significantly different from those for the closely related [14]aneN4 complex. The X-ray structure of the parent Cr(III) complex, [L2Cr(H2O)2](ClO4)3·4H2O, shows that the macrocyclic ligand adopts the most stable, “two up-two down” configuration around the nitrogens.
Introduction
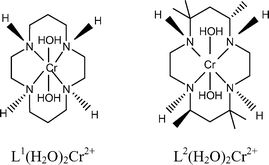
The reaction between L1Cr(H2O)22+ (L1 = cyclam, or [14]aneN4) and molecular oxygen generates intermediates whose chemistry in many respects resembles that observed for cytochrome P450 enzymes.1–3 Previously, we have studied the formation and reactivity of the chromium intermediates, and characterized them spectroscopically and kinetically.4–6 Undoubtedly, the most intriguing reaction is the facile and rapid intramolecular conversion of the hydroperoxochromium(III) complex to L1Cr(V). Such transformations are not only a mechanistic curiosity; there is a realistic possibility that such chemistry might provide a way for “innocent” chromium(III) complexes in biological environments to be converted to higher, carcinogenic oxidation states,7 Cr(V) and ultimately Cr(VI).8Somewhat unexpectedly, there is no kinetic dependence on [H+] for this step5 for either of the two hydrolytic forms of the hydroperoxo complex, L1(H2O)CrOOH2+ and L1(HO)CrOOH+, which are related by a pKa of 5.6, eqn (1)–(3).
| L1(H2O)CrOOH2+ ⇄ L1(HO)CrOOH+ + H+: pKa = 5.6 | (1) |
| L1(H2O)CrOOH2+ → L1(OH)CrVO2+ + H2O: k = 0.191 s−1 | (2) |
| L1(OH)CrOOH2+ → L1CrV(O)2+ + H2O: k = 0.025 s−1 | (3) |
We have now turned to another chromium complex, L2(H2O)2Cr2+
(L2
= Me6-[14]aneN4). Chemically and structurally, L1 and L2 are closely related, but the change of the macrocyclic ligand was expected to influence the kinetics of various steps, and, ideally, increase the lifetime of some intermediates to allow more detailed spectroscopic and mechanistic studies. Such effects have precedents in the cobalt and rhodium chemistry. In both cases, the L2 superoxo complexes homolyze much more readily than the L1 analogues.9,10 We expected the opposite effect on the lifetime of Cr(V), which should derive extra stability from electron donation by the methyl groups of L2.
Experimental
C-meso-Me6-1,4,8,11-tetraazacyclotetradecane (L2) and [L2CrCl2]Cl were prepared according to literature methods.11,12 The purity of the prepared samples was checked by 1H NMR (ligand) and UV-Vis spectroscopy (metal complex). The ethylchromium complex, L2(H2O)CrCH2CH32+, was prepared from the Cr(II) precursor and tert-amylhydroperoxide by a procedure reported earlier for the L1 analogue, and purified by ion exchange on Sephadex C-25. Commercial samples of [Ru(NH3)6]Cl3, (NH4)2ABTS (ABTS2− = 2,2′-azino-bis(ethylbenzothiazoline-6-sulfonate)), both Aldrich, 2-(N-morpholino)ethanesulfonic acid (MES), piperazine-N,N′-bis(4-butanesulfonic acid) (PIPBS), both GFS chemicals, were used as received. Other chemicals were of reagent grade or better. Acidic stock solutions of L2Cr(H2O)23+ (21–64 mM) were prepared by a method described earlier for the L1 complex.13 A suspension of 1.0 g of [L2CrCl2]Cl in 500 mL of 15 mM CF3SO3H was reduced on zinc amalgam in an argon atmosphere. When all the material dissolved, the amalgam was removed, and oxygen was passed through the solution to oxidize L2Cr(H2O)22+ to L2Cr(H2O)23+. The complex was purified by ion exchange on Sephadex C-25 and eluted with 1.0 M CF3SO3H.Stock solutions of L2Cr(H2O)22+ were prepared by zinc amalgam reduction of L2(H2O)2Cr3+ under argon. Fresh stock solutions of L2(H2O)CrOO2+ were prepared daily by injecting small amounts of L2Cr(H2O)22+ into oxygen-saturated solutions of dilute (1–50 mM) HClO4 or CF3SO3H, and kept under oxygen in an ice bath. Stock solutions of Ru(NH3)63+ (10 mM) and ABTS2− (20 mM) were prepared in dilute HClO4 and stored under argon.
The acidity of kinetic solutions was maintained with HClO4 and CF3SO3H at pH < 3, and with MES and PIBPS buffers at pH >3. Laboratory-distilled water was further purified by passage through a Millipore Milli Q water purification system. Unless noted otherwise, the kinetic data are given at 25 ± 0.2 °C and 0.10 M ionic strength.
Most kinetic experiments used an Olis RSM 1000 stopped-flow apparatus. Kinetic data were collected by rapid scanning (Δt = 1 ms) in the range 336–562 nm. A Shimadzu 3101 PC UV-VIS spectrophotometer was used for slow kinetics and for UV-Vis spectral measurements. Data were analyzed with OLIS GlobalWorks v2.0.190 and KaleidaGraph 3.6 PC software. pH measurements utilized a Corning 320 pH meter.
The kinetics of O2 binding to L2Cr(H2O)22+ were determined by laser flash photolysis of L2(H2O)CrCH2CH32+ in oxygenated solution, λexc 266 nm. The photochemical event generates ethyl radicals and L2Cr(H2O)22+. The reaction of the latter with O2 was monitored at 293 nm, an absorption maximum for L2(H2O)CrOO2+ (ε = 3.0 × 10³ M−1 cm−1).
ESR spectra were obtained on frozen samples (T = 115 K) at pH 2.0 and 4.3 with a Bruker ER 200 D-SRC spectrometer. Solutions of L2Cr(V), prepared from equimolar amounts of L2(H2O)CrOO2+ and Ru(NH3)62+, were mixed with an equal volume of propylene glycol, transferred into ESR tubes and frozen to a glass in liquid nitrogen. After the completion of data collection, the samples were warmed up to room temperature to allow L2Cr(V) to decompose, and the spectrum was recorded again at 115 K. The difference between the spectra of fresh and decomposed samples is shown in the Results. The spectra were run again on a new set of solutions containing 2,2-diphenyl-1-picrylhydrazyl (DPPH) in addition to L2Cr(V). The g value for L2Cr(V) was obtained relative to g = 2.0036 for DPPH.
Crystal structure of [L2(H2O)2Cr](ClO4)3·4H2O
A solution of L2(H2O)2Cr3+ in dilute HClO4 was allowed to evaporate slowly at room temperature. Single crystals for crystal structure determination were obtained within a week. The data collection (at 193 K) and structure determination were undertaken in the usual way.A pink crystal with approximate dimensions 0.3 × 0.1 × 0.1 mm of [L2(H2O)2Cr](ClO4)3·4H2O: C16H44Cl3CrN4O18, T = 193 K: monoclinic, space group P21/c, Z = 4, a = 8.7575(15), b = 20.964(4), c = 17.009(3) Å, β = 99.195(3)°, V = 3082.5(9) Å3, Dc = 1.592 Mg m−3, µ = 0.712 mm−1, F(000) = 1548. X-Ray intensity data were measured on a Bruker SMART CCD 1000™ diffractometer [λMoKα = 0.711069 Å, graphite monochromator, a scan width of 0.3° in ε and exposure time of 10 s frame−1, detector–crystal distance 5.03 cm]. A full sphere algorithm and narrow-frame integration lead to a total of 25436 reflections (θ < 26.43°), of which 6284 reflections were independent (Rint = 0.0856) and 4676 with Fo > 4σ(Fo). Data were corrected for absorption using Bruker SADABS (Bruker Analytical X-Ray Systems, Madison, WI, USA, 2001) program. The structure was solved by direct methods and refined by least squares in full-matrix approximation. Hydrogen atoms of the cyclam ligand were placed in calculated positions and refined using the “riding model’. H-atoms of the ligand water and solvent water were not located and were not included in the refinement. The structure was refined (385 parameters) to R1 = 0.0947, wR2 = 0.2597, GOF = 1.047. The SHELXTL version 5.1 (Bruker Analytical X-Ray Systems, Madison, WI, USA, 2001) software package was used for calculations and drawings.
CCDC reference number 279794.
For crystallographic data in CIF or other electronic format see DOI: 10.1039/b511084j
Results
The ORTEP diagram of the cation trans-L2Cr(H2O)23+ is shown in Fig. 1. Selected bond distances and angles are listed in Table 1.| Cr(1)–O(1) | 2.008(4) | Cr(1)–N(3) | 2.061(4) |
| Cr(1)–O(2) | 2.009(4) | Cr(1)–N(5) | 2.042(5) |
| Cr(1)–N(1) | 2.075(4) | Cr(1)–N(6) | 2.051(4) |
| N(1)–Cr(1)–N(3) | 179.67(19) | O(1)–Cr(1)–N(3) | 88.03(17) |
| N(1)–Cr(1)–N(5) | 84.80(19) | O(1)–Cr(1)–N(5) | 89.03(18) |
| N(1)–Cr(1)–N(6) | 94.83(18) | O(1)–Cr(1)–N(6) | 91.32(17) |
| N(3)–Cr(1)–N(5) | 95.31(18) | O(2)–Cr(1)–N(1) | 87.64(17) |
| N(3)–Cr(1)–N(6) | 85.06(18) | O(2)–Cr(1)–N(3) | 92.04(17) |
| N(5)–Cr(1)–N(6) | 179.50(19) | O(2)–Cr(1)–N(5) | 90.82(18) |
| O(1)–Cr(1)–O(2) | 179.83(17) | O(2)–Cr(1)–N(6) | 88.84(17) |
| O(1)–Cr(1)–N(1) | 92.29(17) | ||
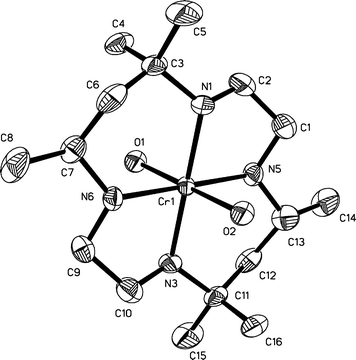 | ||
| Fig. 1 ORTEP drawing of the molecular structure of the cation trans-L2Cr(H2O)23+ (L2 = C-meso-Me6-1,4,8,11-tetraazacyclotetradecane) with H-atoms omitted for clarity. Thermal ellipsoids are drawn at the 50% probability level. | ||
The geometry around the chromium is octahedral with two water molecules in the axial positions. The four equatorial sites are occupied by the nitrogen atoms of the macrocycle in the thermodynamically most stable “two up-two down” (R,R,S,S) configuration. The chromium atom is coplanar with the four nitrogen atoms (RMS = 0.0023 Å). No intermolecular interactions related to N atoms have been observed as the shortest N⋯O distances exceed 3 Å. The shortened “water ligands–water solvent” intermolecular O⋯O distances (all exceed 2.58 Å) were observed. This can indicate a weak intermolecular interaction in the solid state between the cluster and water ligands, but those distances are too long for strong hydrogen bonding. The typical disorder of highly symmetrical perchlorate anions has resulted in comparatively large values of R-factors and thermal displacement coefficients for oxygen atoms.
ESR spectra at pH 2 and pH 4.3 are shown in Fig. 2. The two spectra have identical g values, 2.0024, calibrated against DPPH (g 2.0036). The spectrum at pH 4.3 is, however, broader and has an additional feature that is not found at pH 2.
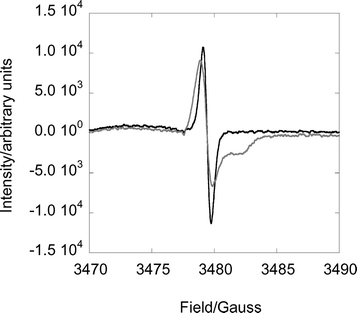 | ||
| Fig. 2 Difference ESR spectra between the fresh and decomposed samples of L2Cr(V) at pH 2.0 (black) and 4.3 (grey) in 1 : 1 (v/v) water–propylene glycol glass at 115 K. Instrument settings: center field 3400 G, sweep width 800 G, microwave frequency ∼4.7 GHz, modulation 12.5, receiver gain 1.25 × 10⁵, time constant 100 ms, 25 scans. | ||
Kinetics of O2 binding
Laser flash photolysis experiments were carried out at three different O2 concentrations in 0.60 M CF3SO3H. A linear plot of kobsvs. [O2] (Fig. S1, ESI†) gave kon = (2.80 ± 0.07) × 107 M−1 s−1, eqn (4). | (4) |
Reaction of L2(H2O)CrOO2+ with reductants
Guided by our previous experience with L1(H2O)CrOOH2+, we determined the rate constants kCrOO, k1 and k2 in the reactions with Ru(NH3)62+ and ABTS2− according to Scheme 1.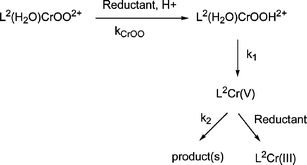 | ||
| Scheme 1 | ||
The reaction of 8 × 10⁻⁵ M L2(H2O)CrOO2+ with an equimolar amount of Ru(NH3)62+ at 3 × 10⁻⁶ −0.054 M H+ was monitored at 270–415 and 375–523 nm as a function of [H+] and temperature. The initial redox step was too fast for precise kinetic determinations, and only an estimate was obtained, kCrOO ∼106 M−1 s−1. The observed kinetic traces were biphasic, Fig. 3, and yielded the rate constants for the formation (k1) and decay (k2) of L2Cr(V). These experiments also yielded UV-Vis spectral data for the intermediate L2Cr(V), Fig. 4. The assignment of the specific rate constants to the individual steps in Scheme 1 was confirmed in experiments with ABTS2−, as described later.
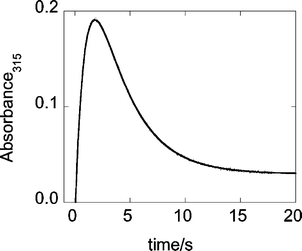 | ||
| Fig. 3 Kinetic curve and the biexponential fit for the formation and decay of L2Cr(V) generated from 6.4 × 10⁻⁵ M L2(H2O)CrOO2+ and 7.0 × 10⁻⁵ M Ru(NH3)62+ at 0.035 M H+. | ||
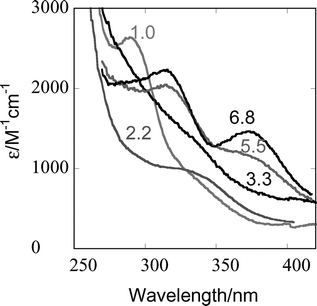 | ||
| Fig. 4 UV spectra of L2Cr(V), derived from biexponential stopped-flow traces at pH 1.0, 2.2, 3.3, 5.5 and 6.8. | ||
The rate constant k1 exhibited a titration-type behavior, as shown in Fig. 5. The limiting values are k1a = 1.00 ± 0.01 s−1 (acidic range) and k1b = 0.273 ± 0.010 s−1 (pH > 7). The data were fitted to eqn (5) to yield the acid dissociation constant for L2(H2O)CrOOH2+, pKa = 5.9 (eqn (6)).
 | (5) |
| L2(H2O)CrOOH2+ ⇄ L2(HO)CrOOH+ + H+ | (6) |
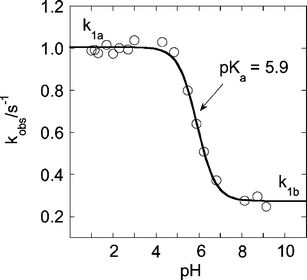 | ||
| Fig. 5 Plot of kobsvs. pH for the transformation of L2(H2O)CrOOH2+ to L2Cr(V) at 25 °C. | ||
The kinetics of L2Cr(V) decay were exponential in the pH range 1–6, although some tailing at longer times was observed at pH > 5. The dependence on pH is shown in Fig. 6, which also shows a plot of kobs against [H+]. This plot is linear with a slope of 8.19 ± 0.13 M−1 s−1 and an intercept of 0.0080 ± 0.0049 s−1.
![Plot of kobsvs. pH for the decay of L2Cr(v). Inset: plot of kobsvs. [H+].](/image/article/2006/DT/b511084j/b511084j-f6.gif) | ||
| Fig. 6 Plot of kobsvs. pH for the decay of L2Cr(V). Inset: plot of kobsvs. [H+]. | ||
The temperature dependence of the rate constants k1 and k2 is shown in the Eyring plots in Fig. S2 and S3 (ESI†).
The reaction between L2(H2O)CrOO2+ and ABTS2− in 0.020 M HClO4 yielded single exponential traces in the limits of low (<0.04 mM) and high (>0.15 mM) concentrations of ABTS2−, but appeared biphasic in the intermediate regime. Under all the conditions, the reaction generated three equivalents of ABTS˙− for each mole of L2(H2O)CrOO2+ consumed. At low [ABTS2−], the rate constants were [ABTS2−]-dependent and yielded an estimate for kCrOO of ca. 2 × 10⁴ M−1 s−1, Fig. S4 (ESI†).
At high [ABTS2−], the redox step was completed in mixing time and produced one equivalent of ABTS˙−. The initial absorbance jump was followed by a first-order absorbance increase that generated two more equivalents of ABTS˙− and had a rate constant k1 = 1.00 ± 0.01 s−1, independent of [ABTS2−] and identical to that observed for one of the stages in the Ru(NH3)62+ reaction. The lack of dependence on [ABTS2−] defines this step as k1, followed by a rapid reduction of a newly formed L2Cr(V) by two more equivalents of ABTS2−. The biphasic behavior at the intermediate concentrations of ABTS2− is easily understood by the gradual change of rate determining step from kCrOO to k1.
The initial redox step between L2(H2O)CrOO2+ and ABTS2−, measurable only at very low [ABTS2−], see above, is acid catalyzed at low [H+], but reaches a constant value at about 0.1 M H+, Fig. 7. Both reactants can be protonated in the acidity range examined, and the saturation in Fig. 7 must result from the cancellation of two opposing acid/base equilibria, see Discussion.
![Plot of kobsvs. [H+] for the reduction of L2CrOO2+
(0.6 µM) with ABTS2−
(10 µM).](/image/article/2006/DT/b511084j/b511084j-f7.gif) | ||
| Fig. 7 Plot of kobsvs. [H+] for the reduction of L2CrOO2+ (0.6 µM) with ABTS2− (10 µM). | ||
The reaction between L2(H2O)CrOO2+ and iodide was examined briefly in the acidity range 0.005 ≤ [H+] ≤ 0.030 M. The absorbance increase at 351 nm (I3−) obeyed the mixed third-order rate law of eqn (7), and yielded kI = 729 ± 13 M−2 s−1. The data are shown in Fig. S5 (ESI†). All the kinetic data are summarized in Table 2.
| −d[L2(H2O)CrOO2+]/dt = kI[H+][I−][L2(H2O)CrOO2+] | (7) |
| Reaction | L = L2 | L = L1 | Conditions | Sourceb | |
|---|---|---|---|---|---|
| a At 25.0 ± 0.2° C; L1 = [14]aneN4; L2 = Me6-[14]aneN4. Units: k/M−1 s−1, ΔH‡/kJ mol, ΔS‡/J mol−1 K−1). Numbers in parentheses represent one standard deviation.b For L = L1.c Ru(NH3)62+ used as reductant for L(H2O)CrOO2+.d Units: s−1.e ABTS2− used as reductant for L(H2O)CrOO2+.f Units: M−2 s−1. | |||||
| kon | L(H2O)2Cr2+/O2 | 2.80 (± 0.07) × 107 | 1.80 (± 0.06) × 108 | 20 mM H+ | 4 |
| kCrOO | L(H2O)CrOO2+/Ru(NH3)62+ | >2 × 10⁶ | 7.0 (± 0.1) × 104 | 20 mM H+ | 4 |
| kCrOO | L(H2O)CrOO2+/ABTS2− | ∼2 × 10⁴ | 2.5 × 10⁴ | 20 mM H+ | 4 |
| k1a | L(H2O)CrOOH2+ → LCr(V) c | 1.00 (± 0.01) sd | 0.18 (± 0.01)d | pH 1–4 | 5 |
| ΔH‡1a | 63.1 (± 0.8) | 53.7 (± 7.3) | |||
| ΔS‡ | −33.1 (± 2.7) | −80.5 (± 24.0) | |||
| k1a | L(H2O)CrOOH2+ → LCr(V)e | 1.00 (± 0.02)d | 0.17 (± 0.01)d | pH 1–3 | 5 |
| k1b | L(OH)CrOOH2+ → LCr(V)c | 0.273 (± 0.010)d | 0.025 (± 0.003)d | pH > 7 | 5 |
| ΔH‡1b | 62.7 (± 1.3) | ||||
| ΔS‡1b | −44.4 (± 4.3) | ||||
| pKa | L(H2O)CrOOH2+ ⇄ L(HO)CrOOH+ | 5.9 (± 0.1) | 5.6 (± 0.1) | pH 1–7 | 5 |
| k2 | LCr(V) → productsc | 8.06 (± 0.23) [H+] + 0.0080(± 0.0049) | 0.416 (± 0.008)d | pH 1–2 | 5 |
| ΔH‡2 | 43.7 (± 1.4) | 57.2 (± 4.5) | |||
| ΔS‡2 | −108 (± 5) | −59.7 (± 14.6) | |||
| kI | L(H2O)CrOO2+/I− | 729 (± 13)f | 402 (± 7)f | 5–30 mM H+ | 14 |
Discussion
The chemistry and intermediates involved in the L2Cr(H2O)22+/O2 reaction for the most part follow closely those observed for the L1 analogue. This includes the rapid initial O2 capture to generate L2(H2O)CrOO2+, and its facile reduction to L2(H2O)CrOOH2+ followed by intramolecular conversion to a Cr(V) complex. The kinetic data for various steps are shown for both series of complexes in Table 2.The greatest difference between the two series was observed at the Cr(V) stage. The rate constant k1 for the formation of L2Cr(V) is ∼5 times larger than that for the L1 complex, and the decay rate constant k2 is under most conditions lower for L2Cr(V). This behavior is consistent with L2 providing greater stabilization to the Cr(V) state, which is easily explained by the electron donation from the peripheral methyl groups.
The rate constant k1 follows the same general pattern for both hydroperoxides, i.e. the reaction displays a titration-type behavior, as shown for L2Cr(V) in Fig. 5. As discussed in detail earlier,5 this somewhat unexpected result and lack of direct acid catalysis suggest a formal intramolecular proton shift from coordinated water to the hydroperoxo group to create the pull–push effect and “turn on” the intramolecular electron transfer and simultaneous dissociation of a molecule of water to generate L2Cr(V). The negative entropies of activation reflect the tightening of both first and second coordination spheres around the metal as the oxidation state increases. The pKa values for the two hydroperoxo complexes are comparable, 5.9 vs. 5.6. The somewhat larger value for the L2 complex is as expected from the increased basicity of the L2 ligand.
The decay of the two Cr(V) complexes follows different patterns. L1Cr(V) exhibits two limiting first order rate constants (0.416 s−1 and 0.103 s−1) and a pKa of 4.9.5 The decay of L2Cr(V), on the other hand, is dominated by a term that is first order in [H+] at high [H+], and exhibits an acid independent term measurable at [H+] < 3 mM.
On the basis of spectral and charge data we suggested previously that L1(OH)CrO2+ and L1Cr(O)2+, related by a pKa of 4.9,5 are the dominant forms of L1Cr(V) in acidic solutions. The UV-Vis spectrum (Fig. 2) of L2Cr(V) suggests that there is an additional form, most likely L2(H2O)CrO3+, present in strongly acidic solutions of the L2 complex. The dramatic change in the UV-Vis spectrum as the pH increases from 1 to 2 coincides with the large decrease in k2, Fig. 6. The linear dependence of k2 on [H+] requires that pKa < 1 for L2(H2O)CrO3+/L1(OH)CrO2+. The aqua-oxo form, L2(H2O)CrO3+, decays much more readily than any of the other hydrolytic forms and completely dominates the kinetics at [H+] > 3 mM. The reactivity of other form(s) is represented by the intercept in the inset in Fig. 6, although the precision of the fitted parameter is low, k = (0.0080 ± 0.0049 s−1). Much more convincing are the experimental rate constants which are much larger than calculated for the acid dependent path at pH >3. The measured values of 0.016–0.022 s−1 in the pH range 3.5–4.5 are 5–40 times greater than those calculated for the acid-catalyzed path. Clearly, the more hydrolyzed forms, L1(OH)CrO2+ and L2Cr(O)23+ also decompose, although the small rate constants combined with the eventual departure from exponential kinetics has thwarted our efforts to determine the pKa relating these two forms. For the L1 complex, the pKa is 4.9.5
The kinetic and spectral evidence obtained for L2(H2O)CrO3+ at pH 1–2 stands in contrast with the corresponding data for the L1 complex, for which the decay rate constant k = 0.41 s−1 remained unchanged in the pH range 1–4. Qualitatively, the trend is as expected on the basis of the greater electron-donating ability of L2, but it is surprising that the effect is so much greater at the Cr(V) level than for the Cr(III) hydroperoxo complexes where the acidity constants of the L1 and L2 species differ by only a factor of two, Table 2.
Despite the clear differences in rate laws, complexes L1Cr(V) and L2Cr(V) both decay faster at higher [H+], as expected if an oxo or hydroxo chromium(V) is reduced to aqua chromium(III). Although work with low concentrations has prevented us from isolating the products of Cr(V) decay for either macrocycle, we believe that the reaction is initiated by an intramolecular electron transfer to yield a Cr(III) complex of modified (oxidized) macrocycle. The other, much less likely option that involves the loss of macrocycle and disproportionation of the metal is ruled out by the absence of HCrO4− among the products.
Some increase in the rate of formation, and increased stability of L2Cr(V) as compared to L1Cr(V) was to be expected on electronic grounds. Still, the two complexes are very much alike and yet the observed kinetic differences are significant. In a biological milieu, a number of potential ligands are available to chromium, and it is plausible that some of them may facilitate the chemistry of the type shown in eqn (1)–(3), as suggested by other authors.16
In our earlier work, we have presented evidence that superoxometal complexes become more powerful oxidants upon protonation, although the protonated forms eluded spectroscopic detection, probably because L(H2O)CrOOH3+ (L = (H2O)4 and L1) is only a minor species even at the highest acid concentrations used.14 The kinetic evidence was, however, convincing. The reductants selected for those experiments (I−, Br−, (NH3)5Ru(py)2+) do not participate in acid–base equilibria under experimental conditions, which leaves the superoxo complexes as the only reasonable proton acceptors and thus the source of the observed acid dependence. The oxidation of I− by L2(H2O)CrOO2+ in this work follows the same pattern and has a rate constant that is somewhat larger than that for the L1 complex.
Another reductant chosen in this work, ABTS2−/HABTS−, has pKa,A = 2.2.17 Of the two forms, ABTS2− is the more reducing.17 On these grounds, it is reasonable to expect that the reactive species in the present case would be L2(H2O)CrOOH3+ and ABTS2−, as shown in eqn (8)–(10).
| L2(H2O)CrOOH2+ ⇄ L2(H2O)CrOO2+ + H+: Ka,Cr | (8) |
| HABTS− ⇄ ABTS2− + H+: Ka,A | (9) |
 | (10) |
After introducing the inequality Ka,Cr ≫ [H+], the rate law in eqn (11) is derived, where [ABTS2−]av represents the sum {[ABTS2−] + [HABTS−]}. The fit of the data to eqn (11) is shown in Fig. 8 and yields k10/Ka,Cr = (3.56 ± 0.04) × 106 M−2 s−1. The excellent linearity of the plot in Fig. 8 places a limit on Ka,Cr at > 1 M which in turn requires that k10 be greater than 106 M−1 s−1, a reasonable value for a reaction with a large driving force (>0.3 V) and a large self-exchange rate constant for at least one reactant, ABTS2−/ABTS˙−.
 | (11) |
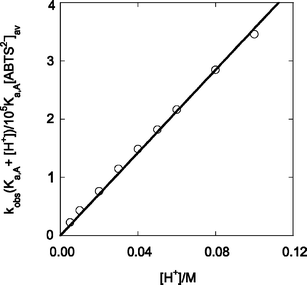 | ||
| Fig. 8 Plot according to eqn (11) for the reaction between L2(H2O)CrOO2+ and ABTS2−. | ||
The [H+] dependence of the L2(H2O)CrOO2+/ABTS2− reaction provides strong support for the existence and reactivity of the so far unobserved protonated form, L2(H2O)CrOOH3+.
The rate constant kon for oxygen binding to L2Cr(H2O)22+, 2.80 × 10⁷ M−1 s−1, is somewhat smaller than the value for the L1 complex. The same pattern, believed to be determined by steric factors, was observed earlier for the Co complexes of the same ligands.9
Acknowledgements
This work was supported by a grant from the National Science Foundation, CHE 0240409. Some of the work was conducted with the use of facilities at the Ames Laboratory.References
- A. Bakac, Prog. Inorg. Chem., 1995, 43, 267–351 CAS.
- A. Bakac, Adv. Inorg. Chem., 2004, 55, 1–59 CrossRef CAS.
- P. R. O. De Montellano and J. J. De Voss, Nat. Prod. Rep., 2002, 19, 477–493 RSC.
- A. Bakac and W.-D. Wang, Inorg. Chim. Acta, 2000, 297, 27–35 CrossRef CAS.
- O. Pestovsky and A. Bakac, Dalton Trans., 2005, 556–560 RSC.
- O. Pestovsky and A. Bakac, J. Am. Chem. Soc., 2003, 125, 14714–14715 CrossRef CAS.
- R. P. Farrell, R. J. Judd, P. A. Lay, N. E. Dixon, R. S. U. Baker and A. M. Bonin, Chem. Res. Toxicol., 1989, 2, 227–229 CrossRef CAS.
- A. Levina and P. A. Lay, Coord. Chem. Rev., 2005, 249, 281–298 CrossRef CAS.
- A. Bakac and J. H. Espenson, J. Am. Chem. Soc., 1990, 112, 2273–2278 CrossRef CAS.
- O. Pestovsky and A. Bakac, J. Am. Chem. Soc., 2002, 124, 1698–1703 CrossRef CAS.
- R. W. Hay and G. A. Lawrance, J. Chem. Soc., Perkin Trans. 1, 1975, 591–593 RSC.
- D. A. House, R. W. Hay and M. A. Ali, Inorg. Chim. Acta, 1983, 72, 239–245 CrossRef CAS.
- A. Bakac, V. Butkovic, J. H. Espenson and M. Orhanovic, Inorg. Chem., 1993, 32, 5886–5888 CrossRef CAS.
- A. Bakac, C. Shi and O. Pestovsky, Inorg. Chem., 2004, 43, 5416–5421 CrossRef CAS.
- O. Pestovsky and A. Bakac, Inorg. React. Mech., 2005, 5, 245–254 Search PubMed.
- R. Codd, C. T. Dillon, A. Levina and P. A. Lay, Coord. Chem. Rev., 2001, 216–217, 537–582 CrossRef CAS.
- S. L. Scott, W.-J. Chen, A. Bakac and J. H. Espenson, J. Phys. Chem., 1993, 97, 6710–6714 CrossRef CAS.
Footnote |
| † Electronic supplementary information (ESI) available: Fig. S1–S5. See DOI: 10.1039/b511084j |
| This journal is © The Royal Society of Chemistry 2006 |

