Chlorofluoroiodomethane as a potential candidate for parity violation measurements
Pascale
Soulard
a,
Pierre
Asselin
a,
Arnaud
Cuisset
b,
Juan Ramon
Aviles Moreno
b,
Thérèse R.
Huet
b,
Denis
Petitprez
b,
Jean
Demaison
b,
Teresa B.
Freedman
c,
Xiaolin
Cao
c,
Laurence A.
Nafie
c and
Jeanne
Crassous
*d
aUniversité Pierre et Marie Curie-Paris 6, CNRS Laboratoire Dynamique Interactions et Réactivité, UMR 7075, Case 49, Place Jussieu, 75252, Paris Cedex 05, France
bLaboratoire de Physique des Lasers, Atomes et Molécules (PhLAM), UMR 8523 CNRS-Université de Lille 1, 59655, Villeneuve d’Ascq Cedex, France
cDepartment of Chemistry, Syracuse University, Syracuse, New York
dLaboratoire de Chimie, Ècole Normale Supérieure de Lyon, UMR CNRS 5182, 46, Allée d’Italie, F-69364, Lyon 07, France. E-mail: jeanne.crassous@ens-lyon.fr; Fax: +33 04 72 72 84 83; Tel: +33 04 72 72 83 95
First published on 21st November 2005
Abstract
CHFClI is among the more favorable molecules for parity violation (PV) measurements in molecules. Despite the fact that calculated PV effects are two orders of magnitude smaller than in some organometallic compounds, CHFClI displays interesting features which could make possible a new experimental PV test on this molecule. Indeed, ultrahigh resolution spectroscopy using an ultrastable CO2 laser is favored by several intrinsic properties of this molecule. For example, the high vapor pressure of CHFClI allows investigation by supersonic beam spectroscopy. Indeed, the spectroscopic constants have been accurately determined by microwave and millimetre wave spectroscopy. This is important for the subsequent selection of an appropriate absorption band of CHFClI that could be brought to coïncide with the absorption of CO2. Partially resolved (+)- and (−)-CHFClI enantiomers with respectively 63.3 and 20.5% ee’s have been recently prepared and analyzed by molecular recognition using chiral hosts called cryptophanes. Finally, the S-(+)/R-(−) absolute configuration was ascertained by vibrational circular dichroïsm (VCD) in the gas phase.
Introduction
Among the four fundamental forces that rule the physical world, the weak force is responsible for symmetry breaking in chiral molecules and leads to different energies for the two enantiomers.1 To date, this energy difference due to parity violation, ΔEPV, has never been clearly experimentally observed in molecules.2 One of the possibilities to detect such a tiny effect (about 10−17kT at room temperature) would be to measure differences in the frequencies of absorption bands, from the infra-red (IR) spectra of the two enantiomers.3 Such a test has already been done in the past, first by Arimondo et al. with camphor4 then by Chardonnet et al. with bromochlorofluoromethane.5 Although parity violation was not observed, the latter gave an upper limit of ΔEPV/E = 10−13 for this effect.6 Contemporary with these experiments, very accurate DFT calculations including relativistic effects have predicted that PV in chiral molecules such as chiral fluorodiheterohalogenomethanes should exhibit differences between the two enantiomers in the C–F stretching band frequency up to 50 mHz when containing iodine (CHFClI and CHFBrI).7 Consequently, chlorofluoroiodomethane has appeared to be one favorable candidate for searching for parity violation effects. More recently, relative to the fact that the PV contribution is predicted to be proportional to Z5,8 bigger molecules have been investigated with the same DFT methods by Schwerdtfeger and Bast.9 Parity violation effects of the order of 1 Hz have been calculated for several organometallic compounds containing an Os![[double bond, length as m-dash]](https://www.rsc.org/images/entities/char_e001.gif) O or a ReO double bond,9 indicating that such transition metal complexes could be also good candidates for a PV experiment. Conversely, the high resolution spectroscopy of these molecules will not be a trivial issue.
O or a ReO double bond,9 indicating that such transition metal complexes could be also good candidates for a PV experiment. Conversely, the high resolution spectroscopy of these molecules will not be a trivial issue.
Although the synthesis of the racemic form was achieved by Hazeldine et al. in 195210 and later on by Novak et al.,11 very little was known about chlorofluoroiodomethane before the last two years. CHFClI is a small pentaatomic chiral molecule and as such it is an ideal model for theoretical studies. It has been possible to prepare the (+) and (−) enantiomers. Moreover Fourier transform infrared spectra in a supersonic beam for the racemic (±)-1 have been recorded. First of all, microwave spectroscopy enables determination of accurate spectroscopic constants for the ground vibrational state and the rovibrational spectrum of the C–F stretching band could be experimentally obtained and roughly analyzed. The latter has revealed many bands that coincide with the ultrastable CO2 laser which is currently used in Chardonnet’s laboratory,5 and whose frequency variation does not exceed typically about 10−15 over a period of 24 h and is one of the key elements for obtaining high accuracy in experimental PV measurements, together with the use of jet cooling. Indeed, besides the ultrastable CO2 laser, molecular beam spectroscopy using a two-photon Ramsey fringe experiment, recently developed in Villetaneuse, seems to be very promising mainly because the collisional effects can be reduced by more than three orders of magnitude.12
In this article, we present the properties of this simple chiral molecule for the purpose of PV measurements. In the first part, the synthesis of racemic CHFClI ((±)-1) and the main spectroscopic characteristics of the racemic molecule are given, namely the microwave spectroscopy and the rovibrational C–F stretching band both using a supersonic molecular beam. In this context, the rotational and centrifugal distortion constants, quadrupole coupling constants for both the iodine and the chlorine atoms and the spin–rotation constants for the iodine atom were obtained from the analysis of the observed pure rotational spectra supplemented by ab initio calculations. The IR spectra showed that some absorption bands should be favorable for PV test by ultrahigh resolution spectroscopy using a supersonic molecular beam. In the second part are presented the preparation of the two (+)- and (−)-1 enantiomers with respective enantiomeric excesses of 63% and 20%, and the gas phase vibrational circular dichroism (VCD) of a 50% ee (+)-CHFClI sample which enabled confirmation of the S-(+) (R-(−)) absolute configuration. Finally, chiral cavity hosts such as cryptophanes can be employed to determine the enantiomeric purities of (+) and (−) samples of CHFClI or CHFClBr;13 the first synthesis of (+)- and (−)-cryptophane E-(SCH3)6 is described and the former host is used to measure the 23 ± 3% ee of (−)-CHFClI by fluorine NMR (subsequently confirmed as being 20.5% by Schurig’s GPC method).
Synthesis of racemic CHFClI
For the preparation of CHFClI, a method was investigated which consisted of synthetizing chlorofluoroacetic acid (FClIC–CO2H) (±)-2 as an intermediate.14 This compound was indeed very important for the subsequent resolution and preparation of enantiomerically enriched (+)- and (−)-CHFClI. Furthermore this synthesis appeared to be convenient for large scale quantities of (±)-CHFClI (up to 4.5 g) essential for high resolution spectroscopy. The problems encountered relative to the low stability of iodinated compounds were solved by keeping all the compounds in solution.Chlorofluoroiodoacetic acid (±)-2 was prepared in four steps from chlorotrifluoroethene 3 (Scheme 1). The first step involved a regioselective nucleophilic substitution of a fluoride by an ethoxide moiety at the CF2 group and gave 2-chloro-1,2-difluoro-1-ethoxyethene 4 as a mixture of Z and E-isomers. In the second step, iodine monochloride was added to chloro-1,2-difluoro-1-ethoxyethene in dry dichloromethane and gave 1,2-dichloro-1,2-difluoro-2-iodo-1-ethoxyethane 5 in 45% yield as a mixture of two R*R*,R*S* diastereoisomers, which was subsequently hydrolyzed in 78% yield with concentrated sulfuric acid to ethyl chlorofluoroiodoacetate 6, following the classical transformation of a –CF2–OR group into a –CO–OR moiety. Finally, ester 6 was saponified by aqueous sodium hydroxide to give the acid (±)-2. This procedure allowed preparation of up to 40 g of (±)-2 kept in ethereal solution. Then its strychninium salt {(±)-FClIC-CO2H, (−)-strychnine} was decarboxylated into (±)-CHFClI by heating at 110 °C and under 110 mmHg in triethyleneglycol and gave (±)-1 with 33% yield.
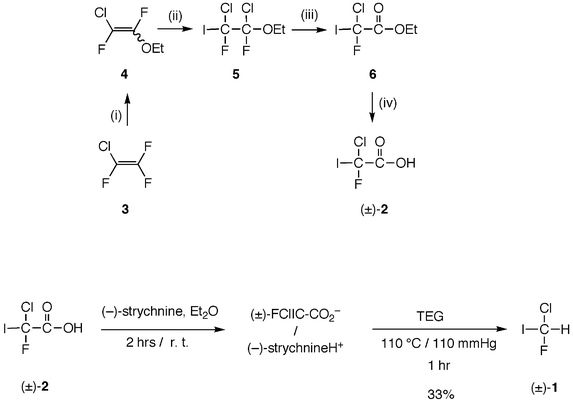 | ||
| Scheme 1 Synthesis of (±)-2 and (±)-1. (i) EtONa, Et2O; (ii) ICl, CH2Cl2, 99%; (iii) concd. H2SO4, 89%; (iv) aq. NaOH then H2SO4, 100%. | ||
Microwave spectroscopy
The pure rotational spectrum of CHFClI has been investigated by Fourier transform microwave and millimetre wave spectroscopies. The three μa, μb, μc-type rotational transitions have been observed in the spectra for the two isotopomers. Here μa, μb and μc are the components of the total permanent electric dipole moment along the principal axes of inertia of the molecule. Moreover each rotational energy level is split into several sub-levels due to the interaction between the electric field gradient and the nuclear quadrupole moment of the iodine and chlorine nuclei giving an extremely complicated hyperfine pattern. Finally the presence of the two isotopomers (CHF35ClI = 75.8% and CHF37ClI = 24.2%) adds difficulties for the identification of the spectra. All the observed components within the sensitivity of the spectrometer (328 for CHF35ClI and 140 for CHF37ClI) were assigned in the 6–20 GHz frequency range. In the millimetre wave region only transitions (281 for CHF35ClI) with relevant JKaKc quantum numbers were assigned in order to determine accurate centrifugal distorsion constants. No hot lines were observed. The predicted rotational constants of the CHF37ClI were derived from the calculated ab initio structure of the CHF35ClI isotopologue (see the ab initio calculation section) for which the chlorine atom was given the appropriate mass. It is supposed that the equilibrium structure is isotopically invariant.Due to the high resolution of the experimental techniques the analysis yielded accurate rotational and centrifugal distortion constants, the complete quadrupole coupling tensors for the iodine and chlorine nuclei, as well as the contribution of iodine to the spin–rotation interaction. These molecular parameters were determined for the two isotopomers CHF35ClI and CHF37ClI. They reproduce the observed transitions within the experimental accuracy.
 | (1) |
 | (2) |
The two-nuclear quadrupole interaction HQ terms are written as16
 | (3) |
 | (4) |
The observed microwave spectrum was analyzed using the Pickett’s program.18 In CHClFI, the quadrupole interaction effect from the iodine nucleus (Q(I) = −0.710(10) b,19) is larger than that for the chlorine nucleus (Q(35Cl) = −0.08165(80) b, Q(37Cl) = −0.06435(64) b,20) by almost one order of magnitude. Consequently we used the so-called sequential scheme for the addition of the angular momenta:
 | (5) |
The complete set of CH35ClFI transitions was fitted and the spectroscopic parameters were obtained by a least-squares procedure.18 They are listed in Table 1 and reproduce the observed transitions with a standard deviation of 44 kHz. The unblended lines of the 5–20 GHz region are reproduced with a standard deviation of 2.3 kHz, within the experimental accuracy. As no lines for the CHF37ClI isotopologue were recorded in higher frequency, all the values of the centrifugal distortion parameters were fixed to the corresponding CHF35ClI values. The molecular parameters presented in Table 1 reproduced the 140 fitted lines with a standard deviation of 2.1 kHz.
| CH35ClFI | CH37ClFI | ||
|---|---|---|---|
| Constant/MHz | Experimental | Ab initio | Experimental |
| a MP2/SDB-VTZ. b B3LYP/a′-VTZ-pp. c Experimental values fixed from the corresponding values of CH35ClFI. | |||
| A | 6278.651148(129) | 6290.82a | 6192.865335(197) |
| B | 1474.152806(76) | 1471.31a | 1432.702503(173) |
| C | 1224.416397(104) | 1222.95a | 1192.568955(193) |
| 10+4ΔJ | 2.22294(52) | 2.15b | 2.22294c |
| 10+5ΔJK | −1.622(42) | −5.68b | −1.622c |
| 10+3ΔK | 7.25410(103) | 7.48b | 7.25410c |
| 10+5δJ | 4.66127(133) | 4.39b | 4.66127c |
| 10+4δK | 9.3128(78) | 8.86b | 9.3128c |
| χ K 10+8 | 1.847(116) | — | 1.847c |
| Iodine nucleus | |||
| χ aa | −1704.58015(252) | −1685.7418(42) | |
| χ bb | 838.57959 | 820.3798 | |
| χ cc | 866.00056(244) | 865.3620(47) | |
| χ ab | 699.7668(61) | 731.8297(68) | |
| χ ac | 622.6878(160) | 622.004(132) | |
| χ bc | −140.4346(265) | −148.7207(247) | |
| 10+3Caa | 4.786(162) | 4.895(220) | |
| 10+3Cbb | 5.647(152) | 5.95(37) | |
| 10+3Ccc | 5.753(164) | 5.575(253) | |
| 10+3Cab | −2.17(34) | −2.18(46) | |
| Chlorine nucleus | |||
| χ aa | −13.3970(34) | −11.5924(59) | |
| χ bb | −15.4498 | −11.2132 | |
| χ cc | 28.8468(38) | 22.8056(67) | |
| χ ab | −51.3943(117) | −40.5472(139) | |
| χ ac | −22.7366(201) | −18.0474(234) | |
| χ bc | −21.107(40) | −16.343(46) | |
All the observed and calculated frequencies for the two chlorine isotopomers CHF35ClI and CHF37ClI are given in upon request from the authors.
The geometrical structure has been calculated at the second-order Møller–Plesset perturbation level of theory (MP2) using basis sets of different sizes. For the first row atoms (H, C, and F), the Dunning’s correlation-consistent polarized valence triple zeta basis sets24 were used. For chlorine which is a second row atom, these standard basis sets give rise to non-negligible errors. For this reason, the newly devised cc-pV(T+d)Z25 was used. Finally, for iodine, the correlation consistent polarized valence basis set with the Stuttgart–Dresden–Bonn (SDB) relativistic effective core potential,26 SDB-cc-pVTZ27,28 was used. The calculated structural parameters are collected in Table 2 together with those calculated at the CCSD(T)/cc-pVDZ level of theory by Schwerdtfeger et al.7
| CCSD(T)a | MP2 | |
|---|---|---|
| cc-pVDZ | SDB-VTZ | |
| a Ref. 7. | ||
| r C−I/pm | 218.9 | 214.69 |
| r C−H/pm | 110.1 | 108.32 |
| r C−F/pm | 135.9 | 134.96 |
| r C−Cl/pm | 177.9 | 175.40 |
| ∠HCI/° | 107.1 | 107.09 |
| ∠ICF/° | 109.3 | 109.45 |
| ∠ICCl/° | 113.3 | 112.23 |
| ∠HCF /° | 109.6 | 109.65 |
| ∠HCCl/° | 108.1 | 108.63 |
| ∠FCCl/° | 109.4 | 109.73 |
| A/MHz | 6222.99 | 6290.82 |
| B/MHz | 1405.27 | 1471.31 |
| C/MHz | 1174.96 | 1222.95 |
| μ/D | 1.33 | |
| ∣μa∣/D | 0.23 | |
| ∣μb∣/D | 0.21 | |
| ∣μc∣/D | 1.30 | |
Much effort was put into the calculation of the quartic centrifugal distortion constants in order to facilitate the prediction and the assignment of the high J and Ka transitions. The harmonic force field is required to calculate the quartic centrifugal distortion constants. Density functional theory was used with the Becke29 three-parameter hybrid exchange functional and the Lee–Yang–Parr correlation functional (B3LYP).30 This method is known to be inexpensive and remarkably accurate from the prediction of harmonic force fields.31 For this calculation, diffuse functions were used for fluorine (aug-cc-p-VTZ)32 and the small-core relativistic PP correlation consistent basis set (cc-pVTZ-PP)33 was used for iodine. The calculated centrifugal distortion constants obtained using the B3LYP harmonic force field are given in Table 1.
The permanent electric dipole moment has been also calculated for CHFClI at the MP2/SDB-VTZ level of theory. The test of this level of theory has been performed on CH3I, a similar molecule. The calculated value (1.62 D) is in good agreement with the experimental value (1.64 D).34 For CHFClI, we predicted that the three a-, b-, and c-type transitions should be observed in the pure rotational spectrum, with μa ≈ μb < μc (see Table 2).
A complete set of spectroscopic parameters has been determined for the ground vibrational state, including the rotational and the centrifugal distortion constants, all the elements of the quadrupole coupling tensor for the iodine and the chlorine nuclei and spin–rotation constants for the iodine nucleus.
Inspection of Table 1 shows that the MP2/SDB-VTZ rotational constants are very close to the experimental ground state constants. This indicates that the equilibrium structure is close to the ground vibrational state structure which was expected for such a heavy molecule. Since only two different isotopomers (CHF35ClI and CHF37ClI) were investigated the structural information directly available from the experimental data is limited. Nevertheless, the rs[Cl] coordinates of CHF35ClI can be compared to those determined by ab initio calculations. The Kraitchman equations16 gave |aCl| = 223.5 pm, |bCl| = 76.3 pm, |cCl| = 5.3 pm (where xCl, x = a, b, c are the Cartesian coordinates in the a, b, c principal axis system). These results are in good agreement with the ab initio equilibrium values calculated at a MP2/SDB-VTZ level of theory: aCl = −222.8 pm, bCl = −76.3 pm, cCl = −6.0 pm.
The centrifugal distortion constants show higher discrepancies, around 5%. The relative difference of 250% on the ΔJK constant is due to accidental cancellation of same order terms (ΔJK = 3/8(τbbbb + τaaaa) −1/4(τaacc + τbbcc + τccaa) = −0.6452 kHz + 0.5883 kHz = −0.0568 kHz for CH35ClFI).
Two independent quantities completely characterize the quadrupolar coupling tensor in its principal axis system: the χzz component of the tensor which measures the quadrupolar coupling in the bond direction, and the asymmetry parameter, η = (χxx − χyy)/χzz, which measures the deviation of the field-gradient tensor from axial symmetry.35 The principal elements χxx, χyy and χzz of the quadrupole coupling tensors were calculated by diagonalizing the quadrupole coupling tensors expressed in the a, b, c principal axis system. The small value for η (0.01917 for the iodine atom and 0.04011 for the chlorine atom) indicates that the z principal axis of the coupling quadrupole tensor nearly coincides with the carbon–halogen bond (C–X, X = I, Cl). CHFClI behaves like most of the molecules with one or several carbon–halogen bonds: the deviation from an axial charge distribution around the halogen nucleus is very weak36,37 indicating nearly cylindrical symmetry of the C–Cl and C–I bonds.
Rovibrational spectroscopy
The precise determination of the ground-state rotational constants of chlorofluoroiodomethane was an essential step before starting the rovibrational spectroscopy of two transitions involving the strong C–F stretching vibration, firstly the fundamental (ν4) and then the first overtone (2ν4). The fundamental transition, predicted at 1081.4 cm−1, should be a good candidate to evidence a parity violation effect between the two enantiomers, with the support of experimental techniques developed in Chardonnet’s laboratory, either of the type saturation-spectroscopy5 or in the near future from a two-photon Ramsey fringe experiment on a molecular beam.12 In relation with this latter project, the possibility of obtaining an infrared absorption spectrum of CHFClI from a continuous seeded supersonic expansion gives confidence for validating the principle of a parity violation measurement with a molecular beam. Although the very low rotational temperatures achieved in the supersonic expansion strongly limit the spectral range of possible coincidences with the CO2 laser, about ten could be obtained with the P and R-branch transitions of the 9 μm band of the CO2 laser, particularly if one considers a tuning range up to ±15 GHz for sub-Doppler spectroscopy with frequency fixed lasers. High resolution infrared spectra can be now carried out and analysed in order to select among all the rovibrational transitions the most favourable molecular resonance with a CO2 laser line.Experimental results from supersonic jet and cell (at room temperature) coupled to a high resolution Fourier transform infrared (FTIR) spectrometer are presented as well as preliminary routes for the rovibrational analysis of CHFClI.
Fig. 1 displays two FTIR spectra of the ν4 band of CHFClI recorded at 0.008 cm−1 resolution in a room temperature static cell (a) and in a supersonic expansion (b), respectively. The stick spectrum in Fig. 1c just serves to indicate some possible coincidences with P(JKaKc) and R(JKaKc) lines of the 9.4 μm band of the CO2 laser. At the present time the spectral analysis is not advanced enough to propose some assignments of the hyperfine structure which could enable the selection of the most favorable resonance.
 | ||
| Fig. 1 FTIR spectra of the ν4 band of CHFClI recorded at 0.008 cm−1 resolution (a) in a room temperature static cell; (b) in a supersonic expansion respectively; (c) stick spectrum of P(JKaKc) and R(JKaKc) lines of the 9.4 μm band of the CO2 laser. | ||
Fig. 2a displays a cell spectrum recorded in the same experimental conditions as that in Fig. 1a, but at full resolution (0.002 cm−1) with an expanded view of P(JKaKc) lines in the region 1056–057 cm−1. A characteristic PQR structure with a fine structure in the P and R branches is clearly visible for all the FTIR spectra. A significant variation of the intensity of the lines in the ν4 vibration–rotation band as a function of J is observed between cell and jet conditions. The separation ΔνPRmax of the two maxima of the P and R branches being approximately proportional to [(A + B + C)T]1/2 for an asymmetrical top molecule,38 where A, B and C are the rotational constants in the ground state of the transition, one can estimate the rotational temperature of the jet spectrum to about 70 K, with a rotational distribution centered around Jmax = 10.
 | ||
| Fig. 2 (a) Cell spectrum recorded in the same experimental conditions as that in Fig. 1a, but at full resolution (0.002 cm−1) with an expanded view of P(JKaKc) lines in the region 1056–1057 cm−1. (b) a first synthetic calculated spectrum about the ν4 fundamental of CHFClI. | ||
Before starting the rovibrational analysis, several points must be examined in detail: firstly, the possible congestion of cell spectra resulting for a low symmetry molecule from several hot bands of the low frequency vibrations (five between 200 and 800 cm−1), secondly the presence of two major isotopomers in natural abundance (CHF35ClI = 75.8%, CHF37ClI = 24.2%), thirdly the hyperfine structure of iodine which displays a large splitting in the microwave spectrum, and finally the occurrence of vibrational perturbations between ν4 and other vibrational states near in energy.
As a first result, only the isolated contribution of the ν4 fundamental band, neglecting all types of interactions with other modes, is introduced and we proceed as follows. Taking advantage of the large spectral simplification due to jet cooling, a direct line-by-line assignment is made simpler for low J transitions, in order to determine approximate excited-state constants with fixing the ground state constants to the microwave results.39 These spectroscopic parameters are then optimized using a least-squares fit with the program WANG40 of about one thousand assigned lines and finally included in the 300 K cell spectrum at 0.002 cm−1 for refining the set of rotational constants, centrifugal distortion constants and band centers for each isotopomer. A first synthetic spectrum about the ν4 fundamental of CHFClI is presented in Fig. 2b.
Synthesis of (+)- and (−)-CHFClI
For an accurate PV test it is necessary to have the two enantiomers of CHFClI available. Their synthesis was investigated by first resolving FClICCO2H and then by using a highly enantioselective decarboxylation reaction. For the resolution of chiral carboxylic acids, it is often convenient to use classical commercially available chiral amines to prepare diastereomeric salts and to resolve them by crystallization in an appropriate solvent.41 This method is convenient in our context because it will enable preparation of large quantities of enantiomerically enriched material for the subsequent spectroscopy in a supersonic beam, which requires large quantities of compound. Among the classical chiral amines tried for the resolution by crystallization, the best results were obtained with (−)-strychnine and either CHCl3 or MeOH as solvent for the crystallization. Indeed, after one crystallization in CHCl3 at room temperature of the 50∶50 mixture {(±)-FClICCO2H,(−)-strychnine}, the diastereomeric n salt 8ai.e. {(+)-FClICCO2H,(−)-strychnine} crystallized with 67–72% diastereomeric excess (de). The diastereomeric excess could directly be read from the 19F NMR spectrum of the salts in CDCl3 at 200 MHz.42 An enantioenriched sample of (+)-CHFClI with 63.3% ee could subsequently be obtained by decarboxylation of the strychninium n salt with 67% de in triethyleneglycol at 110 °C and 100 mm Hg with 30% yield (Scheme 2).14 On the other hand, the use of MeOH enabled recovery from the mother liquors of the p salt 8bi.e. {(−)-FClICCO2H,(−)-strychnine} less than 50% de. The decarboxylation of the strychninium p salt 8b in triethyleneglycol at 110 °C and 40 mm Hg gave (−)-CHFClI with 20.5% ee and with 22% yield. Due to the high solubility of the strychninium p salt in MeOH, the (−) enantiomer was contaminated with MeOH. | ||
| Scheme 2 Synthesis of (+)- and (−)-1 by decarboxylation of partially resolved strychninium salts 8a and 8b. a Diastereomeric excess determined by 19F NMR in CDCl3, see ref. 14. b Enantiomeric excess determined by GC on a chiral stationary phase, see ref. 14. c Enantiomeric excess determined by 19F NMR using cryptophane(−)-7. | ||
The ee’s of (+)- and (−)-CHFClI were determined by two different methods. For the (+) enantiomer, an ee of 63.3% was determined in Schurig’s laboratory by analytical gas chromatography on a Chirasil-γ-Dex column under cryogenic conditions.43,44 The ee of the (−) enantiomer was measured via the host–guest complexation process of CHFClI by a chiral thiomethylated cryptophane ((−)-7) as described below.
Enantioselective recognition of CHFClI by a chiral thiomethylated cryptophane
Cryptophane 745 was prepared for the first time in enantiomerically enriched form, by using the template method which consists of cyclotrimerizing a resolved and functionalized cyclotriveratrylene (CTV). Indeed, as described in Scheme 3, CTV’s M-(+)- and P-(−)-9 were prepared by an already known procedure57 then functionalized to (+)- and (−)-13 with appropriate benzylic alcohols 12 then cyclotrimerized under high dilution conditions. From a synthetic point of view, the templated method was found to be more efficient than the direct method described in ref. 45. However, because high temperature conditions were needed (up to 90 °C over 24–48 h), racemization occurred during this step. This is the reason why (+)- and (−)-7 were obtained with 81.6 and 65.6% ee’s (Fig. 3). The former ee’s could be determined by analytical HPLC on a Regis (S,S) Whelk-O1 column (eluent hexane/THF 40 ∶ 60).46 This method is much more convenient than the former one using a less stable column (Chiralpak-OT(+)).47 The two CD spectra of (+)- and (−)-7 were also recorded and showed the same CD patterns as their CTV parents and allowed assignment of the M-(+) and P-(−) absolute configuration for 7. | ||
| Scheme 3 Synthesis of M-(+)- and P-(−)-cryptophane-E-(SCH3)67 by the template method starting from resolved cyclotriveratrylenes M-(+)- and P-(−)-9. | ||
 | ||
| Fig. 3 Enantiomeric excess determination of M-(+)- and P-(−)-7 by HPLC on a Regis (S,S) Whelk-O1 column (eluent THF/pentane 60 ∶ 40, 1 ml min−1). | ||
The molecular recognition process was observed by proton and fluorine NMR and appeared to be slow at these NMR timescales (as in the case of the chloroform complexation45). Interestingly, cryptophane (±)-7 forms with (+)- and (−)-1 diastereomeric complexes which could be visualized by 1H and 19F NMR in C2D2Cl4 at 300 K (Fig. 4). Under these conditions, the respective association constants were found to be 37 M−1 for the {R-(−)-1 @ P-(−)-7}/{S-(+)-1 @ M-(+)-7} diastereomer and 29 M−1 for the {S-(+)-1 @ P-(−)-7}/{R-(−)-1 @ M-(+)-7} one (within 15% error) which revealed a low enantioselectivity. Cryptophane (−)-7 was subsequently used to determine the ee of enantioenriched (−)-CHFClI. Indeed, the latter was found to be 23 ± 3% with the use of (−)-7 having 65.6% ee by 19F NMR in C2D2Cl4 at 300 K and at 471.4 MHz (see Fig. 5). More accurately a 20.5% ee was obtained for the same (−)-1 sample when using analytical GPC on a Chirasil-γ-Dex column under cryogenic conditions.
 | ||
| Fig. 4 Complexation process of of (±)-CHFClI 1 by (±)-cryptophane-E-(SCH3)67 in C2D2Cl4 and at 300 K. (a) 1H NMR spectra at 500 MHz; the signals corresponding to the two diastereomeric complexes are expanded. b) 19F NMR spectra at 471.4 MHz. | ||
 | ||
| Fig. 5 Enantiomeric excess determination of (−)-1 by 19F NMR in C2D2Cl4 at 300 K using cryptophane (−)-7 as a chiral complexing agent. Two doublets corresponding to diastereomeric host–guest complexes {(+)-1 @ (−)-7} and {(−)-1 @ (−)-7}. | ||
Vibrational circular dichroism
Vibrational circular dichroism (VCD) which measures the difference in absorbance for left and right circularly polarized light for a vibrational transition, is a well established technique for identification of absolute configuration.48–50 The method involves comparison of observed VCD spectra with calculated VCD intensities for a specified enantiomer, carried out at the density functional theory (DFT) level.49,51Observed IR and VCD spectra are displayed in Fig. 6. Larger VCD noise was observed for the 1060 cm−1 band because the maximum absorbance is near 1.4. Difficulties with racemization of the sample during the 6 h measurement and subsequent storage in the cell or on the vacuum line at room temperature with some exposure to fluorescent lights precluded additional measurements at reduced pressure and/or longer collection times.
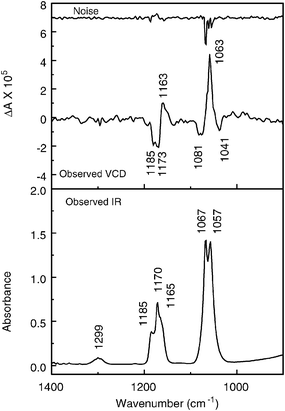 | ||
| Fig. 6 IR (lower frame) and VCD (upper frame) spectra of (+)-fluorochloroiodomethane, ∼100 torr, in 5 cm−1 gas cell equipped with BaF2 windows, 4 cm−1 resolution, 6 h collection, instrument optimized at 1400 cm−1. | ||
The observed spectra show different band contours in the IR and VCD spectra for the same vibrational mode. In order to identify an absolute configuration, the measurements were made on a gas phase sample. Consequently, the VCD intensity must be integrated over the full rotational band contour of the spectrum for comparison with calculations about a non-rotating molecule. Such integration yields net positive VCD intensity for the band near 1060 cm−1 (C–F stretch with C–H–Cl–I umbrella motion) and net negative VCD intensity for the band near 1170 cm−1 (H–C–I deformation). The VCD intensity for the band at 1299 cm−1 is too weak for accurate intensity measurement. The band contours will be discussed further below.
The five DFT calculations with a variety of functionals and basis sets yielded similar calculated frequencies and IR intensities, and the same VCD signs for all modes. The calculated frequencies, normal mode assignments and IR and VCD intensities are gathered in Table 3 for the B3LYP/SDD calculation, with comparison to observed frequencies obtained from Raman spectra of liquid CHFClI. This basis set gave the best agreement with observed relative IR and VCD intensities.
| Mode | Observed frequency (Raman) | Calculated frequency (DFT B3LYP/sdd; unscaled) | 1040 × Calculated dipole strength/esu2 cm2 | 1044 × Calculated rotational strength/esu2 cm2 | Assignment (largest contribution) |
|---|---|---|---|---|---|
| 1 | 197 | 185 | 0.4 | 0.1 | Cl−Cl−I deformation |
| 2 | 274 | 259 | 1.8 | −0.3 | F−C−I deformation |
| 3 | 418 | 371 | 14.2 | 0.5 | Cl−C−F deformation |
| 4 | 587 | 563 | 356.5 | −12.7 | C−I stretch |
| 5 | 764 | 684 | 1237.3 | 10.1 | C−Cl stretch |
| 6 | 1053 | 990 | 837.7 | 6.7 | C−F stretch |
| 7 | 1180 | 1197 | 284.2 | −4.5 | H−C−I deformation |
| 8 | 1301 | 1286 | 49.3 | 0.6 | H−C−F deformation |
| 9 | 3150 | 3215 | 5.6 | −1.7 | C−H stretch |
The observed IR and VCD spectra of the gas-phase sample are compared to the B3LYP/SDD calculation in Fig. 7. The anisotropy ratios (g = ΔA/A) measured from peak areas of the observed IR and VCD bands centered at 1170 and 1060 cm−1 are 2 × 10⁻⁵ and +5 × 10⁻⁵, respectively, approximately ten times larger than the corresponding calculated anisotropy ratios (g = 4R/D, from Table 3), 3 × 10⁻⁶ (1197 cm−1) and +6 × 10⁻⁶ (990 cm−1). We note, however, that the uncertainty in the measured anisotropy ratios is large, because of the VCD noise level.
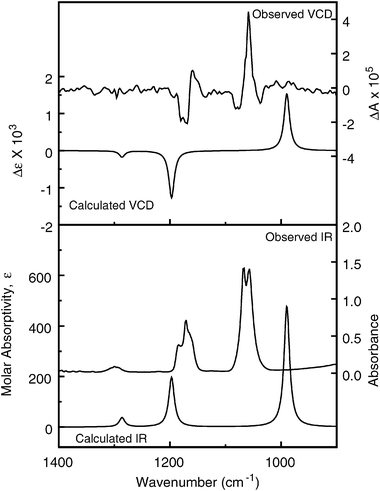 | ||
| Fig. 7 Comparison of IR (lower frame) and VCD (upper frame) observed for (+)-CHFClI in the gas phase (right axes) and calculated for (S)-CHFClI (left axes) at the DFT level, B3LYP functional, SDD basis set (6 cm−1 half-width Lorentzian bands). | ||
From the agreement in sign of the integrated VCD intensity for the two prominent VCD features, the C–F stretch (1060 cm−1, positive) the and H–C–I deformation (1170 cm−1, negative) bands, and the corresponding bands in all five calculations, this study unambiguously identifies the absolute configuration as (S)-(+)-fluorochloroiodomethane, in agreement with the previous assignment based on DFT calculations of the specific rotation.14
Few studies of rotational-vibrational VCD have appeared in the literature.52–56 For our measurements of trans-dideuteriocyclopropane52,53,55 and trans-dideuteriooxirane,54 with C2 symmetry, the band contours for the IR and VCD were similar, and the sign of the P, Q and R rotational branches is the same for each mode. For gas-phase methyloxirane, Polavarapu56 identified two modes for which the central Q-branch envelope had a sign opposite to that of the P- and R-branch envelopes. This observation was explained in terms of an accidental symmetric top molecule for which different components of the rotational strength scalar product contribute to different rotational branches. The rotational strength expression for mode a is
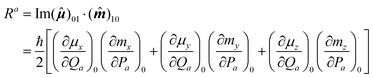 | (6) |
 | ||
| Fig. 8 Calculated geometry, inertial axes and dipole derivatives (μ, with subscript indicating calculated frequency in cm−1) for (S)-CHFClI, (DFT: (B3LYP functional/SDD basis set), for two normal modes. | ||
Conclusion
A complete investigation has been conducted on chlorofluoroiodomethane, one of the most simple model chiral molecule. Racemic CHFClI has been synthesized in multigram quantities, its spectroscopic parameters for the vibrational ground state have been determined by microwave spectroscopy whereas the rovibrational analysis of the C–F stretching band is under investigation. This spectroscopic analysis is one of the most important steps in the perspective of future ΔEPV measurements by ultrastable CO2 laser spectroscopy because it will enable selection of the most appropriate absorption line for the final PV test. For this purpose it has been shown that it is possible to prepare the two partially enriched S-(+) and R-(−)-1 enantiomers, whose absolute configuration has been determined by VCD studies in the gas phase. Finally, the enantioselective complexation process by a chiral cryptophane has shown to be effective and to be a practical tool for ee measurements. For future work, a way to improve the enantiomeric enrichment of (+)- and (−)-CHFClI would be to use gas chromatography on a chiral phase on the preparative scale.Experimental
1. Sample preparation
The same procedure starting from 110 mg of P-(−)-9 gave P-(−)-13 (140 mg, 53%). −108 (c 0.32, dioxane).
The same procedure starting from 127 mg of P-(−)-13 gave P-(−)-7 ((24.1 mg, 20%). Enantiomeric excess 65.6% (HPLC on a Regis (S,S) Welk-O1 column; eluent THF/pentane 60∶40, 1 ml min−1, wavelength 230 nm). CD (8.42 10−5 M in CH2Cl2) 245.6 (−29.4), 274.8 (32.4), 293 (30), 309 (−15.6), 311.8 (−16.6).
 | ||
| Fig. 9 Part of the well resolved F1 = 3 ← 3 and 4 ← 4 components of the JKaKc = 413 ← 303 transition of CHF35ClI. The figure is obtained by concatenation of several high resolution spectra obtained after Fourier transformation of 100 coadded free induction decays. | ||
The small available quantity of racemic CHFClI synthesized (4.3 g) for these continuous gas flow experiments represents a strong limitation to obtain a complete set of excited-state rotational constants, centrifugal distortion constants and band centers with a sufficient accuracy. Therefore our experimental strategy is based on the following considerations: firstly, with a throughput of 1 mol h−1 and in our seeded jet conditions, the whole CHFClI is consumed after only 20 min of recording. From the LN2 cooling traps installed at the end of the pumping system, about 85% of iodochlorofluoromethane injected was recovered after each cycle and could be reused without purification, which increased the recording time by a factor of four. Secondly, scan-by-scan acquisition mode of the interferograms was operated in order to record an individual phase correction, which contributes to significantly lower the statistical noise of the spectrum. In these conditions, the resulting jet spectrum is the Fourier transform of 50 coadded interferograms recorded at 0.008 cm−1 resolution.
The remaining quantity of CHFClI (about 1 g) was used for cell experiments. The vacuum chamber of our molecular beam device is used as a room temperature static cell with a volume of 50 dm3 and an absorption length of 5 m, which enables injection of low sample pressures (0.05 mbar for the ν4 band of CHFClI). The maximum optical path difference of our Bruker FTIR spectrometer is 2.25 m, resulting in an instrumental bandwidth (full width at half maximum) of 0.0022 cm−1 (unapodized) or 0.002 cm−1 (with boxcar apodization). Two cell spectra, which represent the Fourier transform of 150 and 75 coadded interferograms, have been recorded at 0.008 and 0.002 cm−1 resolution, respectively. During the static cell experiments, a significant evolution in the band contour of the C–F stretching band of CHFClI is observed after 40 min of recording. This is interpreted as resulting from the slow decomposition of the product, and consequently the vacuum chamber is evacuated and fresh CHFClI is reinjected after each cycle of ten scans.
Calculations: Optimized geometries, vibrational frequencies and IR and VCD intensities were calculated at the DFT level with Gaussian 0321 with a variety of basis sets and functionals for the (S)-enantiomer (B3LYP functional with LanL2DZ,62–64 CEP-121G,65 and SDD66 basis sets; B3PW91 functional with LanL2DZ basis set). Calculated intensities were converted to Lorentzian bands with 6 cm−1 half-width for comparison to experiment.
Acknowledgements
Professor Schurig and Dr Jiang are warmly thanked for their help in measuring the ee’s of CHFClI samples with their GPC apparatus. Professor Roussel and Dr Vanthuyne are also warmly thanked for their help in finding the wright conditions for the analytical HPLC separation of cryptophanes. Part of this work was supported by the Institut du Développement et des Ressources en Informatique Scientifique (IDRIS), contract 41715. Fabrice Willaert is thanked for the millimetre wave measurements.References
- T. D. Lee and C. N. Yang, Phys. Rev., 1956, 104, 254–258 CrossRef CAS.
- It has already been observed in nuclear and atomic physics. See (a) C. S. Wu, E. Ambler, R. W. Hayward, D. D. Hoppes and R. P. Hudson, Phys. Rev., 1957, 105, 1413–1415 CrossRef CAS; (b) M. A. Bouchiat and C. C. Bouchiat, Phys. Lett., 1974, 48B, 111–114 Search PubMed; (c) L. M. Barkov and M. S. Zolotorev, JETP, 1980, 52, 360–376; (d) M. A. Bouchiat and C. C. Bouchiat, Rep. Prog. Phys., 1997, 60, 1351–1396 CrossRef CAS; (e) C. S. Wood, S. C. Bennett, D. Cho, B. P. Masterson, J. L. Roberts, C. E. Tanner and C. E. Wieman, Science, 1997, 275, 1759–1763 CrossRef CAS.
- M. Quack, Angew. Chem., Int. Ed. Engl., 1989, 28, 571–586 CrossRef.
- E. Arimondo, P. Glorieux and T. Oka, Opt. Commun., 1977, 23, 369–372 CrossRef CAS.
- (a) C. Daussy, T. Marrel, A. Amy-Klein, C. T. Nguyen, C. J. Bordé and C. Chardonnet, Phys. Rev. Lett., 1999, 83, 1554–1557 CrossRef CAS; (b) C. Chardonnet, C. Daussy, T. Marrel, A. Amy-Klein, C. T. Nguyen and C. J. Bordé in Parity violation in atomic physics and electron scattering, eds. B. Frois and M. A. Bouchiat, World Scientific, New-York, 1999, pp. 325–355 Search PubMed; (c) C. Chardonnet, T. Marrel, M. Ziskind, C. Daussy, A. Amy-Klein and C. J. Bordé, J. Phys. IV, 2000, 10–Pr8, 45–54 Search PubMed; (d) M. Ziskind, T. Marrel, C. Daussy and C. Chardonnet, Eur. Phys. J., 2002, 20, 219–225 Search PubMed.
- (a) J. Crassous, C. Chardonnet, T. Saue and P. Schwerdtfeger, Org. Biomol. Chem., 2005, 3, 2218–2224 RSC; (b) J. Crassous, F. Monier, J.-P. Dutasta, M. Ziskind, C. Daussy, C. Grain and C. Chardonnet, ChemPhysChem, 2003, 4, 541–548 CrossRef CAS; (c) J. Crassous and A. Collet, Enantiomer, 2000, 5, 429–438 Search PubMed.
- P. Schwerdtfeger, J. K. Laerdahl and C. Chardonnet, Phys. Rev. A, 2002, 65, 042508 CrossRef.
- See J. K. Laerdahl and P. Schwerdtfeger, Phys. Rev. A, 1999, 60, 4439–4453 Search PubMed and references therein.
- P. Schwerdtfeger and R. Bast, J. Am. Chem. Soc., 2004, 126, 1652 CrossRef CAS.
- R. N. Haszeldine, J. Chem. Soc., 1952, 4259–4267 RSC.
- (a) I. Novak, D. B. Li and A. W. Potts, J. Phys. Chem. A, 2002, 106, 465–468 CrossRef CAS; (b) D. B. Li, S.-C. Ng and I. Novak, Tetrahedron, 2002, 58, 5923–5926 CrossRef CAS.
- A. Shelkovnikov, C. Grain, R. J. Butcher, A. Amy-Klein, A. Goncharov and C. Chardonnet, IEEE J. Quantum Electron., 2004, 40, 1023–1029 CrossRef CAS.
- (a) J. Canceill, L. Lacombe and A. Collet, J. Am. Chem. Soc., 1985, 107, 6993–6996 CrossRef CAS; (b) J. Costante-Crassous, T. J. Marrone, J. M. Briggs, J. A. McCammon and A. Collet, J. Am. Chem. Soc., 1997, 119, 3818–3823 CrossRef CAS; (c) J. Crassous and S. Hediger, J. Phys. Chem. A, 2003, 107, 10233–10240 CrossRef CAS.
- J. Crassous, Z. Jiang, V. Schurig and P. Polavarapu, Tetrahedron: Asymmetry, 2004, 15, 1995–2001 CrossRef CAS.
- H. W. Kroto, Molecular Rotation Spectra, Dover Publications, New York, 1975 Search PubMed.
- W. Gordy and R. L. Cook, Microwave Molecular Spectra, Wiley, New York, 1984 Search PubMed.
- P. Thaddeus, L. C. Krisher and J. H. N. Loubser, J. Chem. Phys., 1964, 40, 257 CrossRef CAS.
- H. M. Pickett, J. Mol. Spectrosc., 1991, 148, 371 CrossRef CAS.
- J. Bieròn, V. Kellö, P. Pyykkö, A. J. Sadlej and D. Sundholm, Phys. Rev. A, 2001, 64, 052507 CrossRef.
- D. Sundholm and J. Olsen, J. Chem. Phys., 1993, 98, 7152 CrossRef CAS.
- J. A. Pople et al., GAUSSIAN 03 (Revision B.04), Gaussian Inc., Pittsburgh PA, 2003 Search PubMed.
- MOLPRO 2000 is a package of ab initio programs written by H.-J Werner et al Search PubMed.
- P. J. Knowles, C. Hampel and H.-J. Werner, J. Chem. Phys., 2000, 112, 3106 CrossRef CAS.
- T. H. Dunning Jr., J. Chem. Phys., 1989, 90, 1007 CrossRef CAS.
- T. H. Dunning Jr., K. A. Peterson and A. K. Wilson, J. Chem. Phys., 2001, 114, 9244 CrossRef CAS.
- A. Bergner, M. Dolg, W. Küchle, H. Stoll and H. Preuss, Mol. Phys., 1993, 80, 1431 CAS.
- J. M. L. Martin and A. J. Sundermann, J. Chem. Phys., 2001, 114, 3408 CrossRef CAS.
- Basis sets were obtained from the Extensible Computational Chemistry Environment Basis Set Database, Version 6/19/03, as developed and distributed by the Molecular Science Computing Facility, Environmental and Molecular Sciences Laboratory which is part of the Pacific Northwest Laboratory, P.O. Box 999, Richland, Washington 99352, USA, and funded by the U.S. Department of Energy. The Pacific Northwest Laboratory is a multi-program laboratory operated by Battelle Memorial Institute for the U.S. Department of Energy under contract DE-AC06-76RLO 1830. Contact David Feller or Karen Schuchardt for further information.
- A. D. Becke, J. Chem. Phys., 1993, 98, 5648 CrossRef CAS.
- C. T. Lee, W. T. Yang and R. G. Parr, Phys. Rev. B, 1988, 37, 785 CrossRef CAS.
- J. A. Montgomery, M. J. Frisch, J. W. Ochterski and G. A. Petersson, J. Chem. Phys., 1999, 110, 2822 CrossRef CAS.
- R. A. Kendall, T. H. Dunning Jr. and R. J. Harrison, J. Chem. Phys., 1992, 96, 6796 CrossRef CAS.
- K. A. Peterson, D. Figgen, E. Goll, H. Stoll and M. Dolg, J. Chem. Phys., 2003, 119, 11099 CrossRef CAS.
- J. Gadhi, G. Wlodarczack, J. Legrand and J. Demaison, Chem. Phys. Lett., 1989, 156, 401 CrossRef CAS.
- E. A. C. Lucken, Nuclear Quadrupole Coupling Constants, Academic Press, London and New York, 1969 Search PubMed.
- A. Bauder, A. Beil, D. Luckhaus, F. Müller and M. Quack, J. Chem. Phys., 1996, 106, 7558.
- Z. Kisiel, L. Pszczolkowsky, W. Caminati and P. G. Favero, J. Chem. Phys., 1996, 105, 1778 CrossRef CAS.
- T. Ueda and T. Shimanouchi, J. Mol. Spectrosc., 1968, 28, 350–372 CrossRef CAS.
- A. Cuisset, J. R. Aviles Moreno, T. R. Huet, D. Petitprez, J. Demaison and J. Crassous, J. Phys. Chem. A, 2005, 109, 5708–5716 CrossRef CAS.
- D. Luckhaus and M. Quack, Mol. Phys., 1989, 68, 745–758 CAS.
- J. Jacques, A. Collet and S. H. Wilen, Enantiomers, Racemates and Resolutions, J. Wiley & Sons, New York, 1981 Search PubMed.
- The presence of the two chlorine isotopes was also observed by 19F NMR.
- Octakis(3-O-butanoyl-2,6-di-n-pentyl)-γ-cyclodextrin linked via an octamethylene spacer to polydimethylsiloxane.
- Z. Jiang, J. Crassous and V. Schurig, Chirality, 2005, 17, 488–493 CrossRef CAS.
- For the synthesis of the racemic 7 by the direct method, see C. Garcia, D. Humilière, N. Riva, A. Collet and J.-P. Dutasta, Org. Biomol. Chem., 2003, 1, 2207–2216 Search PubMed.
- (a) C. Roussel, A. Del Rio, J. Pierrot-Sanders, P. Piras and N. Vanthuyne, J. Chromatogr., A., 2004, 1037, 311–328 Search PubMed; (b) C. Roussel, J. Pierrot-Sanders and I. Heitmann and P. Piras, in Chiral Separation Techniques – A Practical Approach, ed. G. Subramanian, Wiley-VCH, Weinheim, 2nd edn, 2001 Search PubMed.
- A. Tambuté, J. Canceill and A. Collet, Bull. Chem. Soc. Jpn., 1989, 62, 1390–1392 CAS.
- L. A. Nafie and T. B. Freedman, in Circular Dichroism: Principles and Applications, ed. K. Nakanishi, N. Berova and R. Woody, Wiley-VCH, New York, 2nd edn, 2000, pp. 97–131 Search PubMed.
- T. B. Freedman, X. Cao, R. K. Dukor and L. A. Nafie, Chirality, 2003, 15, 743–758 CrossRef CAS.
- P. L. Polavarapu and C. Zhao, J. Anal. Chem., 2000, 366, 727–734 CAS.
- P. J. Stephens and F. J. Devlin, Chirality, 2000, 12, 172–179 CrossRef CAS.
- S. J. Cianciosi, K. M. Spencer, T. B. Freedman, L. A. Nafie and J. E. Baldwin, J. Am. Chem. Soc., 1989, 111, 1913–1915 CrossRef CAS.
- S. J. Cianciosi, N. Ragunathan, T. B. Freedman, L. A. Nafie and J. E. Baldwin, J. Am. Chem. Soc., 1990, 112, 8204–8206 CrossRef CAS.
- T. B. Freedman, K. M. Spencer, N. Ragunathan, L. A. Nafie, J. A. Moore and J. M. Schwab, Can. J. Chem., 1991, 69, 1619–1629 CAS.
- T. B. Freedman, S. J. Cianciosi, N. Ragunathan, J. E. Baldwin and L. A. Nafie, J. Am. Chem. Soc., 1991, 113, 8298–8305 CrossRef CAS.
- P. L. Polavarapu, Chem. Phys. Lett., 1989, 161, 485–489 CrossRef CAS.
- C. Garcia, C. Andraud and A. Collet, Supramol. Chem., 1992, 1, 31–45 CrossRef CAS.
- The faster running anti cryptophane M-(+)-7 was accompanied with the slower running syn cryptophane which is achiral. For the syn and anti nomenclature in cryptophanes see A. Collet, J.-P. Dutasta, B. Lozach and J. Canceill, Top. Curr. Chem., 1993, 165, 103–129 Search PubMed.
- S. Kassi, D. Petitprez and G. Wlodarczak, J. Mol. Struct., 2000, 517–518, 375 CrossRef CAS.
- M. Goubet, P. Asselin, P. Soulard, M. Lewerenz and Z. Latajka, J. Chem. Phys., 2004, 121, 7784–7794 CrossRef CAS.
- L. A. Nafie, Appl. Spectrosc., 2000, 54, 1634–1645 CrossRef CAS.
- T. H. Dunning Jr. and P. J. Hay, in Modern Theoretical Chemistry, ed. H. F. Schaefer III, Plenum, New York, 1976, vol. 3, pp. 1–28 Search PubMed.
- P. J. Hay and W. R. Wadt, J. Chem. Phys., 1985, 82, 299–310 CrossRef CAS.
- W. R. Wadt and P. J. Hay, J. Chem. Phys., 1985, 82, 284–298 CrossRef CAS.
- W. J. Stevens, M. Krauss, H. Basch and P. G. Jasien, Can. J. Chem., 1992, 70, 612–630 CAS.
- A. Bergner, M. Dolg, W. Kuechle, H. Stoll and H. Preuss, Mol. Phys., 1993, 80, 1431–1441 CAS.
| This journal is © the Owner Societies 2006 |