Flow injection on-line solid phase extraction for ultra-trace lead screening with hydride generation atomic fluorescence spectrometry
Zhuo
Wan
,
Zhangrun
Xu
and
Jianhua
Wang
*
Research Center for Analytical Sciences, Box 332, Northeastern University, Shenyang 110004, China. E-mail: jianhuajrz@mail.edu.cn; Fax: +86 24 83687659; Tel: +86 24 83688944
First published on 25th November 2005
Abstract
A flow injection (FI) on-line solid phase extraction (SPE) procedure for ultra-trace lead separation and preconcentration was developed, followed by hydride generation and atomic fluorescence spectrometric (AFS) detection. Lead is retained on an iminodiacetate chelating resin packed microcolumn, and is afterward eluted with 2.5% (v/v) hydrochloric acid to facilitate the hydride generation by reaction with alkaline tetrahydroborate solution with 1% (m/v) potassium ferricyanide as an oxidizing (or sensitizing) reagent. The hydride was separated from the reaction medium in the gas–liquid separator and swept into the atomizer for quantification. The chemical variables and the FI flow parameters were carefully optimized. With a sample loading volume of 4.8 ml, quantitative retention of lead was obtained, along with an enrichment factor of 11.3 and a sampling frequency of 50 h−1. A detection limit of 4 ng l−1, defined as 3 times the blank standard deviation (3σ), was achieved along with a RSD value of 1.6% at the 0.4 µg l−1 level. The procedure was validated by determining lead contents in two certified reference materials, and its practical applicability was further demonstrated by analysing a variety of biological and environmental samples.
Introduction
Trace lead in the biotic environment causes a series of threats, including the damage to almost all organs and organ systems1,2 at high levels of human exposure. The most prominent feature of lead is its long residence time in human soft tissues, bone compartment as well as various organs once absorbed into the human body,3 thus triggering carcinogenic effects to human health. One of the consequences of excessive lead deposition in human body is the destruction of the nervous system characterized by the significant decrease of intelligence quotient.4,5 Considering that very low levels of lead in biological and environmental samples are frequently encountered (e.g., only a few parts per trillion for mineral water and parts per billion for surface water samples), thus posing a challenge in improving the detection capability of the current analytical techniques.Among the most frequently employed detection techniques for trace heavy metals including lead, spectrometric procedures have attracted extensive attention. At this juncture, electrothermal atomic absorption spectrometry (ETAAS) and inductively coupled plasma mass spectrometry (ICPMS) are the most promising candidates, owing to their high sensitivities for metal species.6–9 Atomic emission spectrometry (AES) and flame AAS are often the choice for this purpose although their detection capacities are sometimes restricted. On the other hand, for a direct sampling system, ETAAS and ICPMS signals are sensitive to matrix components or total dissolved salts and thus suffer serious matrix effect,10–12 restricting their direct applications for samples with complex matrices. Appropriate sample pre-treatment or clean-up protocols are therefore frequently required. For hydride/vapour forming elements, hydride/vapour generation is most suitable for on-line operation, and thus is an elegant approach for eliminating matrix effects and at the same time improving sensitivities of detection.13–15 Atomic fluorescence spectrometry (AFS) has a flow through detector that is compatible with on-line vapor generation system, it is therefore one of the most suitable approach for measuring ultra-trace lead.16,17 However, the detection capability of hydride generation atomic fluorescence spectrometry is frequently restricted by the coexisting matrix components especially the transition metal species when analysing real world samples. An appropriate sample pretreatment step is thus called for before hydride generation and AFS detection.
The present communication reports a significant improvement for the detection capability of lead for hydride generation atomic fluorescence spectrometry, by coupling a flow injection on-line solid phase extraction separation and preconcentration procedure for ultra-trace lead in an iminodiacetate chelating resin packed microcolumn. Lead was retained on the column and afterwards eluted with hydrochloric acid followed by hydride generation with reduction by tetrahydroborate in the presence of ferricyanide as a oxidizing/sensitizing reagent and subsequent AFS quantification.
The sensitivity of the present procedure is not only much improved as compared with those of the main spectrometric techniques, but it is even superior to or at least at the same level as those of the published procedures with various on-line separation and preconcentration protocols with detection by ETAAS and ICPMS.
Experimental
Instrumentation
A Titan AFS-920 sequential injection atomic fluorescence spectrometer (Titan Instruments Co. Ltd, Beijing, China), with an electrically ignited concentric quartz tube atomizer, was employed. An auxiliary argon flow along the annular space between the walls of the two quartz tubes was applied as a shield gas to avoid the introduction of air into the atomizer. A high-intensity lead hollow cathode lamp (Beijing General Research Institute for Nonferrous Metals, China) was used as the radiation source at 283.3 nm. The generated lead hydride and the hydrogen were separated from the reaction mixture in the first-stage W-type gas–liquid separator (GLS1)16 and swept by a carrier argon flow through a second-stage gas–liquid separator of membrane type (GLS2) and finally into the atomizer. Peak area was employed for quantification.The incorporated SIS-100 sequential injection system furnished with two syringe pumps of 5.0 ml and an auxiliary peristaltic pump was employed for concentrate and fluids delivering during the hydride generation stage.
A FIA-3110 10-channel flow injection system (Titan Instruments Co. Ltd, Beijing, China) equipped with 2 peristaltic pumps was employed for the on-line ion exchange sample pretreatment. The flow manifold of the FI-HG-AFS system is shown in Fig. 1. All the externally used tubes were 0.8 mm id PTFE tubing, except for the reaction coil (RC), which was made from 1.8 mm id PTFE tubing.
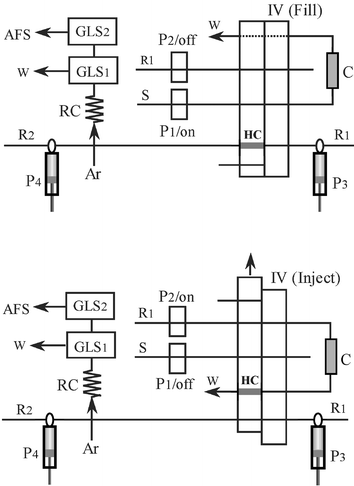 | ||
| Fig. 1 The flow manifold of FI on-line ion exchange preconcentration of lead coupled to HG-AFS. P1, P2: peristaltic pumps; P3, P4: syringe pumps; GLS1: W-type gas–liquid separator; GLS2: membrane type gas–liquid separator; HC: sample loop; RC: reaction coil; IV: injection valve; W: waste; C: packed column. | ||
In order to increase the retention capacity of the microcolumn, the iminodiacetate chelating resin beads (D401, Shanghai Huazhen Co., Shanghai, China) was grinded, and particles of ca.150 µm in diameter were collected by using a mesh filter. The resin beads were converted to H-form by a series of stirring procedure (30 min for each), including HCl (1 mol l−1), NaCl (5%, m/v), NaOH (1 mol l−1), HCl (1 mol l−1). After each stirring, a thorough rinsing with deionized water was followed until the acidity of the water approached pH 7. The column was packed with ∼80 mg beads in a piece of PTFE tubing (2.0 mm id/3.2 mm od with a length of ca.1.5 mm) blocked at both ends by glass wool.
All the operations were computer controlled, and the operating parameters of the AFS instrument are summarized in Table 1 after appropriate optimization.
| Parameters | Settings |
|---|---|
| Lead hollow cathode lamp | 283.3 nm |
| Lamp current | 60 mA |
| Atomizer height | 9 mm |
| Atomization temperature | 200 °C |
| Integration time | 5 s |
| Time delay | 1 s |
| Negative high voltage of photomultiplier | 320 V |
| Carrier argon flow | 500 ml min−1 |
| Shield argon flow | 1000 ml min−1 |
Reagents
All the reagents used were of the highest purity available but at least of reagent grade, and deionized water of 18 MΩ cm−1 was used throughout.Lead working standard solutions were prepared daily by step-wise dilution of a 1000 mg L−1 stock solution with 1.0% (m/v) potassium ferricyanide (A.R., Shenyang Chemicals Co., Shenyang, China), the acidity was adjusted to pH 5. A 1.0% (m/v) NaBH4 solution was prepared by dissolving NaBH4 (Shanghai Chemicals Co., Shanghai, China) in 0.8% (m/v) NaOH (G.R., Beijing Beihua Fine Chemicals Co., Beijing, China). A potassium ferricyanide solution was prepared by dissolving appropriate amount in ion-free water, which was afterward loaded through an iminodiacetate chelating resin column (only used for the clean-up of the reagent) pretreated to pH 5–11. The solution passed through the column was collected and diluted to obtain a 1.0% (m/v) ferricyanide solution. The ferricyanide solution was employed as the oxidizing/sensitizing reagent during the hydride generation process.16
Other chemicals used were: HCl (G.R., Tianjin Yaohua Chemicals Co., Tianjin, China), nitric acid (Suprapur, Tianjin Kemiou Chemicals, Tianjin, China) and perchloric acid (G.R., Tianjin Dongfang Chemicals Co., Tianjin, China). The HCl was redistilled before use in order to remove the residual lead to the extent possible.
Sample pretreatment
1.0 ml of 65% nitric acid and 0.4 ml of perchloric acid were added successively into a quartz beaker containing appropriate amount of hair sample. The following operation is exactly the same as described for processing the whole blood.
Urine and water samples: Human urine and surface water samples were filtered and determined directly subject to appropriate dilution.
Operating procedure
As illustrated in Fig. 1 (fill), sample solution was delivered by peristaltic pump P1 to pass through the D401 chelating resin packed microcolumn. Lead in sample solution was retained on the surface of the column while sample matrix components were directed to waste. At the same time, a constant argon flow was directed into the atomizer. The injection valve (IV) was afterward switched to inject position as illustrated in Fig. 1 (inject), P2 was actuated and the dissolution of the retained analyte was facilitated by pumping HCl solution (2.5%, v/v) containing potassium ferricyanide (1.0%, m/v) to flow through the column in an opposite direction. The leading part of the dissolved concentrate, 400 µl, was entrapped in the sample loop (HC). The injection valve was then switched back to the fill position, the hydride generation process was subsequently triggered by carrying the concentrate captured in the sample loop with HCl (2.5%, v/v) dispensed by the syringe pump P3 to meet the tetrahydroborate solution delivered by syringe pump P4. The auxiliary peristaltic pump was used for draining the waste. The gas phase including the hydride was separated from the first stage gas–liquid separator (GLS1) and subsequently directed into the atomizer through the second phase separator (GLS2).Results and discussion
The AFS parameters
The effects of the various AFS parameters, including the lamp current, the atomizer height, the negative high voltage of the photomultiplier, carrier and shield argon flow, were investigated on the basis of those adopted in ref. 16 in the term of sensitivity and reproducibility. The optimized parameters were summarized in Table 1.Variables during the preconcentration stage
The sensitivity of the whole system could be further improved by simply increasing the sample loading time, i.e., the sample volume, provided that break-through of the microcolumn was not reached. Considering that the sensitivity of this procedure was sufficiently high for lead analysis in the biological and environmental samples encountered in this study, a sample volume of 4.8 ml was thus employed, corresponding to a sample loading time of 60 s.
The eluent flow rate within 1.4–8 ml min−1 was found to significantly affect the elution efficiency of the retained lead, as illustrated in Fig. 2. An increase of the eluent flow rate up to 5.2 ml min−1 resulted in a significant improvement of the elution efficiency or sensitivity, while afterward a slight decline was observed. This observation might be explained that during the elution process there exist a competition between sorption and de-sorption of lead from the column surface. When using a lower concentration of HCl as eluent, there is a tendency that a certain amount of stripped lead tend to be retained back onto the column at a lower flow rate, while the uptake of lead was hampered with the increase of eluent flow rate as there is no sufficient time for re-sorption, the elution efficiency was consequently improved. When the flow rate exceeding a certain value, in this case 5.2 ml min−1, although the re-sorption of lead was avoided, the residence time was not sufficient for the de-sorption of lead, causing a decline of the elution efficiency. For further investigations, a comprised elution flow rate of 5.2 ml min−1 was adopted.
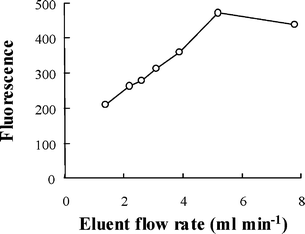 | ||
| Fig. 2 The effect of dissolution flow rate. Preconcentration: pH 5; eluent (HCl), 2.5% (v/v); sample loading flow rate, 4.8 ml min−1; loading time, 60 s; 0.4 µg l−1 (Pb). Hydride generation, NaOH: 0.8% (m/v); NaBH4, 1.0% (m/v); HCl, 2.5% (v/v); ferricyanide, 1.0% (m/v); NaBH4 (NaOH) flow rate, 4.8 ml min−1; HCl (ferricyanide) flow rate, 30 ml min−1. | ||
Variables during hydride generation process
Similarly, the effect of NaBH4 concentration was investigated. The experimental results indicated that a very steep increment of the fluorescence intensity with the increase of NaBH4 concentration was observed up to 1.0% (m/v), while afterward the increase of the signal was not significant and was almost leveled off when 2.0% (m/v) of NaBH4 was employed. Considering that an enhanced concentration of the reducing reagent tends to produce concomitantly more hydrogen in the gas phase, which diluted the concentration of the hydride and thus caused a drop in the sensitivity. In addition, strong foam was generated when adopting a higher concentration of NaBH4, which tended to cause trouble for phase separation in the first stage gas–liquid separator as the foam might be entrapped into the gas phase and finally introduced into the atomizer. Thus, a NaBH4 concentration of 1.0% (m/v) was employed for further investigations.
Interferences
The potential interfering effects of some foreign species on the preconcentration of lead were tested with the present procedure by gradually increasing the amount of foreign ions. The results showed that similar results for the coexisting heavy metal species were obtained as previously reported direct sampling system,16 that is, at a lead concentration level of 1.0 µg l−1 and within a ±5% error range, 10 mg l−1 Fe3+, Co2+, Ni2+, Zn2+, Hg2+, Cr(VI), Sr2+, Zr(IV), Mn2+, 5 mg l−1 Cd2+, Sn2+, As(III), Sb(III), Se(IV) and 0.5 mg l−1 Cu2+, Bi(III), Ag+ did not interference with the determination of 1 µg l−1 Pb. However, the tolerant limits for alkali and alkaline earth metals, the major matrix components frequently encountered in biological and environmental samples, were substantially increased. This made it feasible to determine ultra-trace lead in complex matrices without masking or further treatment process for the sample digests.It has been documented that during the hydride generation process, the nascent transition metals and their borides formed in the reaction medium can severely suppress the formation and release of the hydrides. Considering that the reduction rates of these interfering metals are slower than most of the hydride forming processes,16,18 it was feasible to eliminate the interfering effects via on-line operation, taking advantage of the very short residence time of the hydrides in the reaction medium, and thus minimizing their contact with the nascent transition metals or their borides by immediate separation of the formed hydrides from the reaction medium. A thorough investigation with a variety of real samples indicated that no interfering effects were encountered during the hydride generation process in the present case.
Performance and validation of the procedure
The characteristic performance data obtained for the flow injection on-line ion exchange preconcentration system for lead with hydride generation-atomic fluorescence spectrometric detection was summarized in Table 2. In order to be more illustrative, a recorded peak shape after separation and preconcentration was also provided, as showed in Fig. 3. The well shaped peak facilitated satisfactory reproducibility of the present system, by giving rise to a much improved detection limit of 4 ng l−1, as compared to 14 ng l−1 obtained by employing a previous direct sampling system.16 This procedure offered an enrichment factor of 11.3, which further enhanced the detection capability, especially for saline sample matrix. Considering that the present system maintained a retention efficiency of 97%, it seems that the two systems provide detection capabilities of roughly the same order of magnitude. In such a case, the LOD of the procedure is strongly depending on the instrumental blank level, it is thus predictable that a further improvement of the detection limit by using the present AFS equipment will be difficult.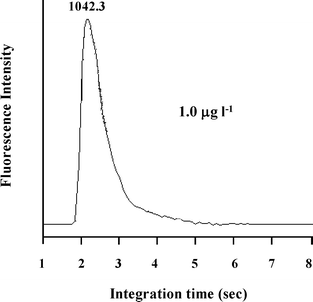 | ||
| Fig. 3 The recorded peak shape after separation and preconcentration. Preconcentration: pH 5; eluent (HCl), 2.5% (v/v); sample loading flow rate, 4.8 ml min−1; loading time, 60 s; elution flow rate: 5.2 ml min−1; 1.0 µg l−1 (Pb). Hydride generation, NaOH: 0.8% (m/v); NaBH4, 1.0% (m/v); HCl, 2.5% (v/v); ferricyanide, 1.0% (m/v); NaBH4 (NaOH) flow rate, 4.8 ml min−1; HCl (ferricyanide) flow rate, 30 ml min−1. | ||
| Sample volume | 4.8 ml |
| Linear calibration range | 0.02–2.0 µg l−1 |
| Regression equation | F = 1254.3CPb − 42.7 |
| Correlation coefficient | 0.9995 |
| Enrichment factor | 11.3 |
| Detection limit (3σ, n = 11) | 4 ng l−1 |
| RSD (0.4 µg l−1, n = 11) | 1.6% |
| Retention efficiency | 97% |
| Sampling frequency | 50 h−1 |
A comparison of the detection limit of the present procedure with some of the reported ones with detection by various spectrometric techniques were summarized in Table 3. It is obvious that the sensitivity of this procedure is much improved with respect to those of HG-AFS,16,17 HG-AAS,19,20 HG-AES,21 HG-ETAAS,22,23 direct sampling ETAAS,24 and direct sampling ICPMS,25 and it is even superior to or at least at the same level as those of the published procedures with HG-ICPMS26,27 as well as various on-line preconcentration protocols with detection by ETAAS28–31 and ICPMS.32–34 In addition, Fig. 3 further demonstrated the suitibility of the present procedure for a wide range of environmentally interesting sample matrices.
| Methods/samples analysed | LOD/µg l−1 | %RSD/µg l−1a | Ref. |
|---|---|---|---|
| a Concentration level at which the RSD value was obtained. b Quartz tube atomizer. | |||
| SI-HG-AFS/urine | 0.014 | 0.7 (2.0)a | 16 |
| HG-AAS/not applied to real samples | 0.06 | <10 (10)a | 17 |
| FI-HG-QT-AASb/urine, apple leaves, soil | 0.2–5.2 | 6.4(3.0)a | 19 |
| FI-HG-AAS/dialysis concentrates | 0.7 | 3.7 (20)a | 20 |
| HG-AES/corals | 0.7 | 1.6 (20)a | 21 |
| HG-ETAAS/sediment, pine needles, aquatic moss | 0.2–0.5 | 3 (2)a | 22 |
| 0.7 | 2 | 23 | |
| ETAAS/human blood | 15 | 6–14 (50)a | 24 |
| ICPMS/urine | 0.09 | 3.7 (3.0)a | 25 |
| HG-ICPMS/natural water, plant tissue, pond sediment, limestone, nervous tissue | 0.002 | <5.7 (1)a | 26 |
| 0.007 | 1.4 (4)a | 27 | |
| FI-HG-ETAAS-in atomizer trapping/calcium supplement materials | 0.03 | 28 | |
| FI-ETAAS-resin column preconcentration/steels and aluminum | 0.02 | 2–10 | 29 |
| FI-ETAAS-preconcentration in a chelating sepharose column/river sediment, natural water | 0.07 | 5.1 (0.5)a | 30 |
| FI-ETAAS-ion exchange preconcentration/urine | 0.0045 | 3.8 | 31 |
| FI-ICPMS-preconcentration in a PTFE KR/water samples | 0.006 | 1.5 (0.5)a | 32 |
| FI-ICPMS-back extraction preconcentration/urine | 0.011 | 4.8 (0.2)a | 33 |
| FI-ICPMS-preconcentration in a PTFE column/urine | 0.006 | 2.2 (0.2)a | 34 |
| This procedure/a broad range of environmental samples | 0.004 | 1.6 (0.4)a | |
The proposed procedure was validated by analysing two certified reference materials, i.e., GBW09139 (frozen cattle blood), GBW 09101 (hair), agreements between the obtained results and the certified values were achieved. The practical applicability of the procedure was further demonstrated by measuring lead contents in a number of biological and environmental samples. The obtained results were summarized in Table 4. It can be seen that reasonable spiking recoveries were achieved for all the samples within an extended concentration range.
| Samples | Certified values/µg g−1 | Found values/µg g−1 | Spiked/µg g−1 | Recov. (%) | RSD (%) |
|---|---|---|---|---|---|
| a Results are expressed as the mean of three replicates ± confidence interval at the 0.05 significance level. | |||||
| GBW09139 | 110 ± 20 | 115 ± 12.4 | |||
| GBW09101 | 7.2 ± 0.7 | 7.3 ± 0.6 | |||
| Human whole blood | 70.0 ± 12.4 | 50 | 99 | 1.5 | |
| Wine | 5.0 ± 0.6 | 3 | 98 | 2.0 | |
| Urine 1 | 2.3 ± 1.0 | 4 | 95 | 3.1 | |
| Urine 2 | 3.9 ± 0.6 | 4 | 103 | 3.7 | |
| Urine 3 | 4.6 ± 0.7 | 4 | 102 | 3.8 | |
| Tap water | 2.1 ± 0.4 | 2 | 101 | 2.8 | |
| Mineral water 1 | 0.07 ± 0.01 | 0.4 | 104 | 1.7 | |
| Mineral water 2 | 0.05 ± 0.01 | 0.2 | 102 | 2.9 | |
| Lake water | 1.4 ± 0.1 | 1.5 | 99 | 4.9 | |
| River water | 2.8 ± 0.6 | 5 | 97 | 3.8 | |
| Rain water | 7.9 ± 1.3 | 10 | 99 | 3.8 | |
Acknowledgements
The authors are indebted to the financial support from the National Natural Science Foundation of China (NSFC-20375007), the China Postdoctoral Science Foundation, and the Natural Science Foundation of Liaoning Province (20042011).References
- S. Tong, Y. E. Von Schirnding and T. Prapamontol, Bull. WHO, 2000, 78, 1068 CAS.
- Centers for Disease Control and Prevention, Preventing lead poisoning in young children (Report), US Department of Health and Human Services, Atlanta, GA, 1991 Search PubMed.
- J. A. Brito, F. E. McNeill, D. R. Chettle, C. E. Webber and C. Vaillancourt, J. Environ. Monit., 2000, 3, 271 RSC.
- D. Bellinger, Epidemiology, 1995, 6, 101 CrossRef CAS.
- Z.-L. Luo, J.-P. Liu, J.-A. Liu and F.-Z. Li, Chin. J. Tradit. West. Med., 2003, 10, 1479 Search PubMed.
- O. Acar, Anal. Chim. Acta, 2005, 542, 280 CrossRef CAS.
- E. Vassileva and C. R. Quetel, Anal. Chim. Acta, 2004, 519, 79 CrossRef CAS.
- A. Taylor, S. Branch, D. Halls, M. Patriarca and M. White, J. Anal. At. Spectrom., 2005, 20, 323 RSC.
- A. Fisher, P. Goodall, M. W. Hinds, S. N. Nelms and D. M. Penny, J. Anal. At. Spectrom., 2005, 20, 1567 Search PubMed.
- J.-H. Wang and E. H. Hansen, Trends Anal. Chem., 2005, 24, 1 CrossRef CAS.
- X.-B. Long, R. Chomchoei, P. Gala and E. H. Hansen, Anal. Chim. Acta, 2004, 523, 279 CrossRef CAS.
- J.-H. Wang and E. H. Hansen, Trends Anal. Chem., 2003, 22, 836 CrossRef CAS.
- J. Moreda-Pineiro, P. Lopez-Mahia, S. Muniategui-Lorenzo, E. Fernandez- Fernandez and D. Prada-Rodriguez, J. Anal. At. Spectrom., 2002, 17, 721 RSC.
- D. Wallschlager and J. London, J. Anal. At. Spectrom., 2004, 19, 1119 RSC.
- H. Mendez, I. Lavilla and C. Bendicho, J. Anal. At. Spectrom., 2004, 19, 1379 RSC.
- J.-H. Wang, Y.-L. Yu, Z. Du and Z.-L. Fang, J. Anal. At. Spectrom., 2004, 19, 1559 RSC.
- A. D'Ulivo and P. Papoff, Talanta, 1985, 32, 383 CrossRef CAS.
- C. Moor, J. W. H. Lam and R. E. Sturgeon, J. Anal. At. Spectrom., 2000, 15, 143 RSC.
- W. Chuachuad and J. F. Tyson, J. Anal. At. Spectrom., 2005, 20, 282 RSC.
- A. Berkkan and N. Ertas, Talanta, 2004, 64, 423 CrossRef CAS.
- I. D. Brindle, R. McLaughlin and N. Tangtreamjitmun, Spectrochim. Acta, Part B, 1998, 53, 1121 CrossRef.
- H. O. Haug, Spectrochim. Acta, Part B, 1996, 51, 1425 CrossRef.
- D. Erber, L. Quick, F. Winter and K. Cammann, Talanta, 1995, 42, 927 CrossRef CAS.
- Y. Zhou, R. A. Zanao, F. Barbosa, Jr, P. J. Parsons and F. J. Krug, Spectrochim. Acta, Part B, 2002, 57, 1291 CrossRef.
- J.-H. Wang, E. H. Hansen and B. Gammelgaard, Talanta, 2001, 55, 117 CrossRef CAS.
- S. Chen, Z. Zhang, H. Yu, W. Liu and M. Sun, Anal. Chim. Acta, 2002, 463, 177 CrossRef CAS.
- J. Li, F. Lu, T. Umemura and K. Tsunoda, Anal. Chim. Acta, 2000, 419, 65 CrossRef CAS.
- J. F. Tyson, R. I. Ellis, G. Carnrick and F. Fernandez, Talanta, 2000, 52, 403 CrossRef CAS.
- M. B. O. Giacomelli, E. M. Ganzarolli and A. J. Curtius, Spectrochim. Acta, Part B, 2000, 55, 525 CrossRef.
- X.-B. Long, M. Miro and E. H. Hansen, Talanta, 2005, 66, 1326 CrossRef CAS.
- Yu-Hsiang Sung and Shang-Da Huang, Anal. Chim. Acta, 2003, 495, 165 CrossRef CAS.
- K. Benkhedda, H. G. Infante and F. C. Adams, Anal. Chim. Acta, 2004, 506, 137 CrossRef CAS.
- J.-H. Wang and E. H. Hansen, J. Anal. At. Spectrom., 2002, 17, 1284 RSC.
- J.-H. Wang and E. H. Hansen, J. Anal. At. Spectrom., 2002, 17, 1278 RSC.
| This journal is © The Royal Society of Chemistry 2006 |