Distinction of gases with a semiconductor sensor depending on the scanning profile of a cyclic temperature
Satoshi
Nakata
*,
Hirokazu
Okunishi
and
Yusuke
Nakashima
Department of Chemistry, Nara University of Education, Takabatake-cho, Nara 630-8528, Japan. E-mail: nakatas@nara-edu.ac.jp; Fax: +81-742-27-9191; Tel: +81-742-27-9191
First published on 2nd December 2005
Abstract
A gas-sensing system based on a dynamic nonlinear response is reported to improve the selectivity in the sensor response toward sample gases. A cyclic temperature composed of fundamental and second harmonics was applied to a SnO2 semiconductor gas sensor and the resulting conductance of the sensor was analyzed by fast Fourier transformation (FFT). The dynamic nonlinear responses to the gas species were further characterized depending on the scanning profile of the temperature. These characteristic sensor responses under the application of second-harmonic perturbation were theoretically considered based on a reaction–diffusion model for the semiconductor surface.
1. Introduction
An important consideration in the development of chemical sensors is that they should not only be able to rapidly detect a target chemical species but also that they should exhibit high chemical selectivity by eliminating interference even for an actual sample composed of mixtures or under variable environments. In general, the information obtained from semiconductor sensors is one-dimensional for each detector: the concentration of a certain gas species can be determined by the “d.c. change” in the resistance (or conductance) of a semiconductor gas sensor, and information on the “temporal axis” is ignored.1–3 However, most semiconductor gas sensors are not selective enough to detect a single chemical species due to the principle of detection. Thus, the sensor responds to the most reducing gases, such as hydrocarbon and alcohol, and therefore it is impossible to oxidize only a specific gas in a gaseous mixture for detection.Therefore, one-dimensional information is inadequate for distinguishing between the responses to the sample and other interfering gases. To overcome this problem, a time-dependent sensor response under temperature modulation has been developed,4–19 in addition to the strategy of using sensor arrays.20
We have been developing a gas-sensing system based on the dynamic nonlinear response under a cyclic temperature21–28 or cyclic diffusion29 to obtain multi-dimensional information in addition to one-dimensional information under a steady state. We have reported that the nonlinear dynamic response of a gas sensor changes characteristically depending on the concentration and chemical structure of gas molecules, and these characteristic responses can be qualitatively reproduced by a numerical simulation based on the kinetics of gas molecules (diffusion, adsorption, and reaction) on the sensor surface.22,25,27,29
In this study, we demonstrated that the nonlinear responses to gaseous samples changed characteristically depending on the scanning profile of the cyclic temperature, which was regulated by the second-harmonic heater voltage, to improve the discrimination of the nonlinear dynamic response. The principle of this system is that the phase of the second-harmonic heater voltage can partially change the dynamic sensor response which depends on the kinetics of gases on the sensor surface. The characteristic nonlinear responses of a semiconductor gas sensor under the application of temperature perturbation including the second harmonic were not only evaluated by the higher harmonics of FFT but also qualitatively reproduced based on a diffusion–reaction model for the solid surface.
2. Experimental
Fig. 1 shows a schematic representation of the experimental apparatus developed from our previous system. The processes (1)–(3) were performed.22,25,28 Here, (3) is the process developed in this paper. (1) A fundamental harmonic (frequency: f0 = 0.04 Hz) voltage, V1, was generated with a waveform generator (NF Electronic Instruments, WF1946, Japan) and supplied to the heater of a semiconductor sensor. Under this condition, the time-variation of temperature was almost sinusoidal, as shown in Fig. 2b.25 (2) The time-developed output signal as the sensor response was characteristically deformed from the sinusoidal input signal of temperature depending on the sample gases, i.e., the sensor response included the higher harmonics which corresponded to the nonlinearity. (3) To increase the discrimination of gases based on the dynamic nonlinear response, the second-harmonic (2f0 = 0.08 Hz) voltage, V2, was applied further, i.e., a modulated signal (Vm), which was composed of the sum of the fundamental and second-harmonic voltages (Vm = V1 + V2), was supplied to the heater of the gas sensor. In this study, we examined three heater voltages, i.e., Vα = 3.60 + 1.35cos2πf0t + 0.66cos(4πf0t + π/6) (V), Vβ = 3.91 + 1.68cos2πf0t (V), and Vγ = 3.52 + 1.43cos2πf0t (V) + 0.70cos(4πf0t + 5π/3) (V). The region of temperature operation was constant at 400–560 K for the heater voltage, and to maintain the same temperature region, the amplitude of V1 was adjusted to be almost twice as large as that of V2 for an individual θ. To characterize the dynamic sensor responses to gases, the time-variation of the sensor conductance, for which the sample number was 1024 and the wavenumber of the fundamental harmonic was two, was Fourier-transformed to the frequency domain.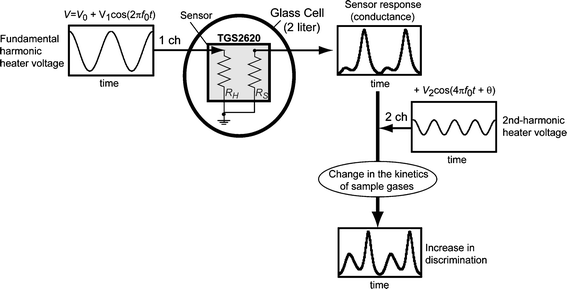 | ||
| Fig. 1 Diagram of the experimental apparatus for measuring the nonlinear dynamic response (conductance ∝ 1/RS) of a semiconductor gas sensor under the different profiles of a cyclic temperature. A modulated voltage composed of the sinusoidal voltage (f = 0.04 Hz) on channel 1 (1 ch) and second-harmonic voltage (f = 0.08 Hz) on channel 2 (2 ch) was applied to the heater of the sensor (RH) to increase the discrimination of sample gases. | ||
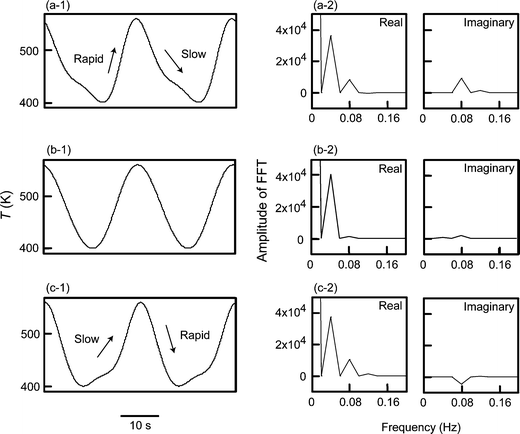 | ||
| Fig. 2 Experimental results for (1) the time-variation of the sensor temperature, and (2) the real and imaginary parts of FFT under the application of heater voltage (a) Vα, (b) Vβ, and (c) Vγ. | ||
Fig. 2 shows (1) the time-variation of temperature and (2) the real and imaginary parts of FFT under application of the heater voltage ((a) Vα, (b) Vβ, and (c) Vγ). The initial value for FFT was the conductance when only R1 was obtained for FFT of the time-variation of temperature, i.e., I1 = 0 (Fig. 2). Here, Rn (n = 0, 1, 2, 3, and 4) and In (n = 1, 2, 3, and 4) are the amplitudes of the real (cosine) and imaginary (sine) parts of the nth harmonic in FFT, respectively (R0: dc value of the conductance, R1 and I1: amplitudes of the fundamental harmonic (0.04 Hz)).
The temperature-profile was characterized by a rapid increase in temperature at dT/dt > 0 and a slow decrease in temperature at dT/dt < 0 for Vα, an equivalent increase and decrease in temperature for Vβ, and a slow increase in temperature at dT/dt > 0 and a rapid decrease in temperature at dT/dt < 0 for Vγ. Thus, the scanning rate of temperature at dT/dt > 0 is Vα > Vβ > Vγ, and that at dT/dt < 0 is Vγ > Vβ > Vα.
A SnO2 gas sensor was used as the semiconductor gas sensor (TGS2620, Figaro Engineering Inc., Osaka, Japan).1,3,30–34 The conductance of the gas sensor was measured with a digital multimeter (Yokogawa, Model 7552, Japan). The ac voltage and the conductance of the gas sensor were successively stored in a personal computer via a GPIB interface. The desired amount of gas was introduced into a glass cell (2 l) via a glass injector. Ambient air was purified through columns composed of silica gel, activated carbon, and CaCl2 to remove excess water vapor and other impurities. Purified air was used as a control. The surface temperature of the gas sensor was measured with an infrared thermometer (Keyence, IT2-01, Japan).
The fundamental frequency of the heater voltage was chosen as follows. The higher fundamental frequency is much better to rapidly detect a sample gas, but the amplitude of the scanning temperature is decreased with the increase in the frequency on the present system. On the other hand, the larger amplitude of the scanning temperature generally enhances the selectivity of sample gases on the sensor response. However, the frequency should be decreased to obtain the larger amplitude. Therefore, we chose the fundamental frequency at 0.04 Hz based on the above reasons.
3. Results and discussion
a. Experimental results for dynamic sensor responses depending on the scanning rate of the temperature
Fig. 3 shows the experimental results for the sensor response of temperature T (K) versus conductance G (mS) for (a) benzene, (b) toluene, (c) 1-propanol, and (d) propane under the application of Vα, Vβ, and Vγ. The nature of the TversusG curve changed characteristically depending on the composition of the gas species and the different responses were further characterized by the addition of the second-harmonic perturbation. The temperature at maximum conductance, Tmax, decreased with an increase in the scanning rate of the temperature at dT/dt > 0. Especially, Tmax for 1-propanol was markedly shifted in comparison with those of other gases, i.e., Tmax changed from 505 K for Vγ to 420 K for Vβ. With an increase in the scanning rate of the temperature, the sensor conductance decreased at dT/dt < 0 except for propane, but increased at dT/dt > 0 and T < Tmax. Therefore, for benzene, toluene, and 1-propanol, the magnitudes of hysteresis (the difference in TversusG curve between an increase and decrease in the temperature scan) at the higher temperature were higher than those at the lower temperature under the application of Vγ, while opposite results were noted under the application of Vα, as seen in Fig. 3a, b, c. On the other hand, the magnitude of the hysteresis for propane was Vα > Vβ > Vγ, as seen in Fig. 3d.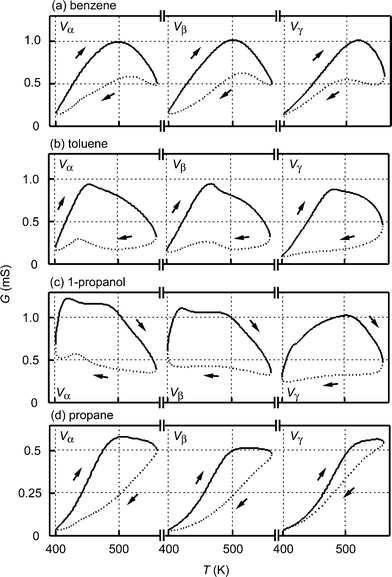 | ||
| Fig. 3 Experimental results on the sensor temperature T (K) versus sensor conductance G (mS) under the application of heater voltage, Vα, Vβ, and Vγ. The sample gases were (a) benzene, (b) toluene, (c) 1-propanol, and (d) propane, and their concentrations were 1000 ppm. All of the TversusG curves rotate clockwise, as indicated by the arrows, drawn with a solid line for temperature scanning at dT/dt > 0, and by a dotted line for that at dT/dt < 0. | ||
b. Evaluation of the dynamic nonlinear response by FFT
To characterize the dynamic sensor responses to gases, the time-variation of G was Fourier-transformed to the frequency domain. The higher harmonics of FFT changed characteristically depending on not only the sample gases but also the profile of the temperature scan, as shown in Fig. 4. The dependence of Tmax on the scanning rate of the temperature at dT/dt > 0 is reflected in R1 and R3. For example, R1 and R3 for 1-propanol under the condition of Vα are similar to those under the condition of Vβ, but are clearly different from those under the condition of Vγ. For propane, the magnitude of hysteresis depending on the temperature scan was reflected in I1, and the characteristic nature of TversusG curve at dT/dt > 0 and Vγ was especially reflected in R2. The common features of the aromatic vapors (benzene and toluene) were reflected in the imaginary part. On the other hand, the difference in the response between benzene and toluene was reflected in the real part. The local changes in the sensor responses to toluene and 1-propanol near 430 K at dT/dt < 0 and Vα in Fig. 3b and c were reflected in R4.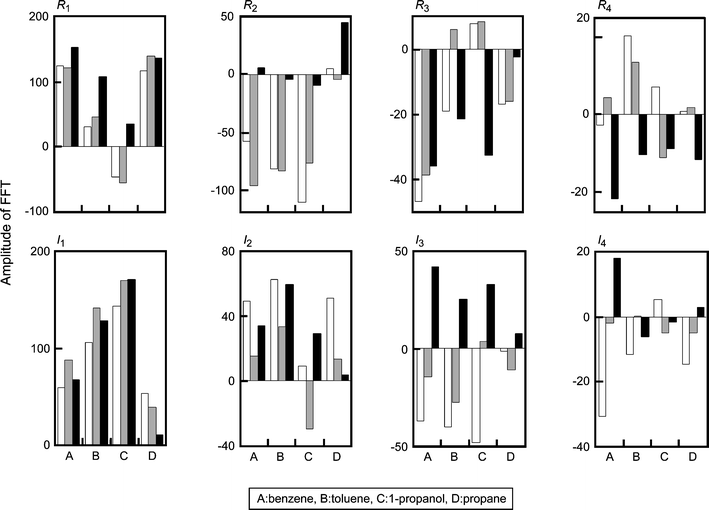 | ||
| Fig. 4 Amplitudes of FFT for the sensor response G for 1000 ppm (A) benzene, (B) toluene, (C) 1-propanol, and (D) propane under the application of heater voltage, Vα (white bar), Vβ (gray bar), and Vγ (black bar). The data correspond to those in Fig. 3. | ||
Fig. 5 shows the concentration dependence of R2 for the sensor conductance for propane under the application of Vα, Vβ, and Vγ. The concentration dependence of the higher harmonic characteristically changed under the application of the second harmonic modulation. These results suggest that the sample gases are quantified based on the characteristic concentration dependence of the higher harmonics. Thus, the dynamic nonlinear response can be further characterized by the different temperature scanning with second-harmonic modulation, Vα, Vβ, and Vγ.
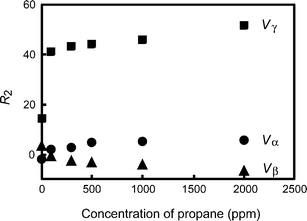 | ||
| Fig. 5 Concentration dependence of R2 for the sensor conductance for propane under the application of Vα (circle), Vβ (triangle), and Vγ (square). | ||
The relationship between the sensor response and FFT has been reported previously.22,25,26 The real part is related to the sensor response at the quasi-steady state, which depends on the reaction kinetics. The imaginary part is related to the imbalance between the diffusion and reaction of sample gases on the sensor surface.
The decrease in Tmax with an increase in the scanning rate of the temperature at dT/dt > 0 suggests that the reaction rate is significantly higher than the rate of the temperature scan; i.e., the system reaches diffusion-limited access. Tmax is related to the oxidation in the subphase, which is the region heated by the radiant heat from the sensor element. Above Tmax, G may decrease since the concentration of the sample gas supplied to the sensor surface is lowered by oxidation at the subphase. The change in Tmax for 1-propanol is largest among these gases since the activation energy of the oxidation for 1-propanol is lowest among these gases.
The decrease in G with an increase in the scanning rate of T at dT/dt < 0 and the increase in G with an increase in the scanning rate at dT/dt > 0 and T < Tmax suggest that a rapid scan of T moves away from G in the steady state, which minimizes the hysteresis in the GversusT curve. In contrast, the poor sensitivity to the temperature scan between Vα and Vβ for benzene suggests that the oxidative reaction rather than diffusion is the rate-limiting step reaction, as seen in Fig. 3a. Thus, the characteristic nature of hysteresis depending on the profile of the temperature scan is caused by the diffusion–reaction kinetics of the sample gas and oxygen on the sensor surface.
To enhance the reproducibility of the sensor response, we performed the following tests. First, we adjusted the actual heater voltage for every sensor to operate the same temperature range. Second, we checked the dynamic sensor responses to propane and ethanol as standard samples, and chose the much better sensor. In this stage, the feature of Gvs.T curve was qualitatively reproduced when a sensor was replaced. The difference in the absolute value of the sensor conductance was minimized by the normalization of the higher harmonics, e.g., (Rn(gas) − R0(air))/R0(air).
c. Theoretical simulation of the sensor response under the application of different profiles of cyclic temperature
To clarify the dynamic sensor responses under the application of different profiles of cyclic temperature, a theoretical simulation of the sensor response was performed based on the following model for a semiconductor gas sensor:1,25,26,30–34| O2(bulk) → 2O(sub) | (1) |
 | (2) |
 | (3) |
 | (4) |
The kinetics of the reaction in eqn (1)–(4) for sample gases may be expressed by eqn (5)–(8):
| d[Oadm−]/dt = k1(S0 − [Oadm−] − [gxOadm−])[O(sub)] − k−1[Oadm−] − k2[Oadm−][gx(sub)] | (5) |
| d[gxOadm−]/dt = k2[Oadm−][gx(sub)] − k3[gxOadm−] | (6) |
| d[gx(sub)]/dt = Dgx(Px − [gx(sub)]) − k4[gx(sub)][O(sub)] − k2[Oadm−][gx(sub)] | (7) |
| d[O(sub)]/dt = DO2(PO21/2 − [O(sub)]) + k−1[Oadm−] − k1(S0 − [Oadm−] − [gxOadm−])[O(sub)] − k4[gx(sub)][O(sub)] | (8) |
The conductance of a semiconductor gas sensor G(T), depends on the surface Schottky barrier height Vs and temperature, since the conductance of a SnO2 semiconductor gas sensor may be considered a model of barrier-limited conductance:1,25,30–34
| G(T) = G0exp(−eVs/kT) | (9) |
| Vs = eNt2/2εsκ0Nd | (10) |
If we assume that Nd is significantly larger than Nt, eqn (11) can be obtained from eqn (9) and (10):
| G(T) = G0exp(−VslNt2/T) | (11) |
The rate constants depend on the temperature according to the Arrhenius equation in eqn (12):
| kn = Fnexp(−En/RT) | (12) |
Fig. 6 shows a closed line for G(T), which is calculated with eqn (5)–(8), (11), and (12), when T is periodically changed as Tα, Tβ, and Tγ. Here, Tα, Tβ, and Tγ were experimentally reproduced by the fundamental and second harmonics to conform to the experimental results regarding the time-variation of temperature for sensor heating, Vα, Vβ, and Vγ, respectively (see Fig. 2), i.e., Tα = 461 + 70cos2πf0t + 24cos(4πf0t + 0.27π) (K), Tβ = 480 + 80cos2πf0t (K), and Tγ = 461 + 75cos2πf0t + 23cos(4πf0t + 1.87π) (K).
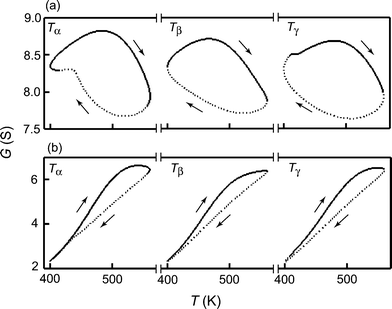 | ||
Fig. 6 Numerical simulation of temperature T (K) versus sensor conductance, G (S), curves based on eqn (5)–(8), (11), and (12) when Tα, Tβ, and Tγ are applied. The TversusG curves rotate clockwise, as indicated by the arrows in each figure. f0 = 0.04 Hz, PO2 = 210![[thin space (1/6-em)]](https://www.rsc.org/images/entities/char_2009.gif) 000 ppm, Px (x = A or B) = 1000 ppm, F1 = 0.2, E1 = 1 kJ mol−1, F−1 = 600, E−1 = 10 kJ mol−1, DO2 = 2, Vsl = 2500, S0 = 1, R = 8.314, and G0 = 10. (a) Gas A: F2 = 0.5, E2 = 1 kJ mol−1, F3 = 1 × 10⁴, E3 = 2 kJ mol−1, F4 = 1000, E4 = 50 kJ mol−1, DgA = 0.55. (b) Gas B: F2 = 0.3, E2 = 0.1 kJ mol−1, F3 = 350, E3 = 5 kJ mol−1, F4 = 3000, E4 = 55 kJ mol−1, DgB = 0.5. 000 ppm, Px (x = A or B) = 1000 ppm, F1 = 0.2, E1 = 1 kJ mol−1, F−1 = 600, E−1 = 10 kJ mol−1, DO2 = 2, Vsl = 2500, S0 = 1, R = 8.314, and G0 = 10. (a) Gas A: F2 = 0.5, E2 = 1 kJ mol−1, F3 = 1 × 10⁴, E3 = 2 kJ mol−1, F4 = 1000, E4 = 50 kJ mol−1, DgA = 0.55. (b) Gas B: F2 = 0.3, E2 = 0.1 kJ mol−1, F3 = 350, E3 = 5 kJ mol−1, F4 = 3000, E4 = 55 kJ mol−1, DgB = 0.5. | ||
In this simulation, the parameters of the reaction kinetics were basically determined by reference to related papers,25,26,33,34 and were finally adjusted by the approximate calculation in comparison with the experimental results. The dynamic sensor responses were characterized further by the second-harmonic temperature perturbation, i.e., the GversusT curve for gas A changed differently from that for gas B among Tα, Tβ, and Tγ. For example, G for gas A is locally increased at 430 K, while that for gas B is not sensitive under dT/dt < 0 for the application of Tα. As shown in Fig. 7, these characteristic enhanced responses with harmonic perturbation are especially reflected in the higher harmonics, e.g., R2 for gas A were negative and almost zero under Tα and Tγ, but were positive and highly positive for gas B, while I2 was positive for gas A under Tγ but zero for gas B. Thus, the characteristic responses for gases A and B are similar to those for toluene and propane.
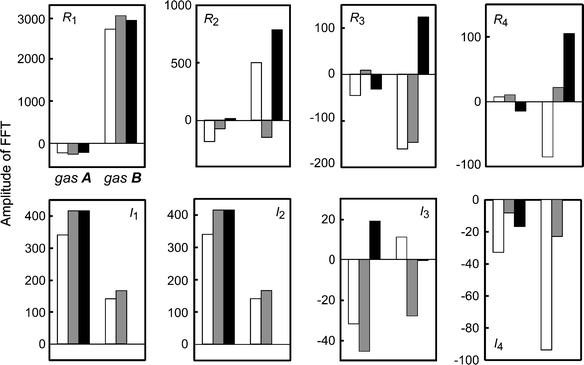 | ||
| Fig. 7 Numerical results of the amplitude of the FFT for the sensor response G for gases A and B under the application of a cyclic temperature, Tα (white bar), Tβ (gray bar), and Tγ (black bar). The data correspond to those in Fig. 5. The vertical values are Rn or In for G. | ||
Conclusion
In this study, we have demonstrated that the dynamic sensor responses to sample gases were changed characteristically by the second-harmonic temperature perturbation, Tα and Tγ. These effects are reflected by the higher harmonics of FFT. The characteristic dynamic sensor responses stimulated by the second-harmonic perturbations were calculated based on a reaction–diffusion model for the semiconductor sensor surface. We also demonstrated that the nonlinear sensor response enhanced by temperature perturbation can provide useful information for the analysis of a sample gas, i.e., it will be possible to distinguish gases under the application of Vα and Vγ even if the sensor response to the sample gas is similar to that to another gas under the application of Vβ.Although we have demonstrated only the second-harmonic perturbation in addition to the fundamental harmonic, the selectivity of the sensor response should be enhanced by choosing other higher harmonic perturbations because the nonlinear response changes depending on the chemical species.2–28 To identify the optimal condition from a theoretical point of view, the effects on the sensor responses under the temperature perturbation should be clarified by further investigation, e.g., the reaction products and their processes on the sensor surface should be simultaneously identified by further analysis, e.g., GC/MS, to confirm the present model.35
In taste and olfaction, living organisms can detect and quantify chemical stimuli even in complex states, such as natural odors in the environment, without chromatographic separation.2,36,37 In living organisms, information regarding the chemical structure and concentration is transformed into nervous impulses. Since excitation and pulse generation in biomembranes are typical “nonlinear phenomena”, we believe that the utilization of a nonlinear response which corresponds to the higher harmonics in FFT is worth considering to develop a novel chemical sensor which mimics taste and olfaction.37 In addition, gas chromatography is unable to evaluate the effect of competition among gaseous mixtures due to the analytical principle involved, even though gas chromatography is widely used due to its supposed high sensitivity and selectivity. Therefore, we believe that the present system, which considers not only the time-dependent nonlinear response to individual gases but also the effects of the coexistence of mixed gases, may more closely mimic taste and olfaction.
Acknowledgements
We thank Mr T. Ogawara (Kyoto University, Japan) and Dr K. Kato (Figaro Engineering Inc., Japan) for their useful technical suggestions. This study was supported in part by a Grant-in-Aid for Scientific Research from the Ministry of Education, Culture, Sports, Science and Technology of Japan (No. 16550124).References
- A. Mandelis and C. Christofide, Chem. Anal. (New York), 1993, 125, 19 Search PubMed.
- Sensors and Sensory Systems for an Electronic Nose, ed. J. W. Gardner and P. N. Barlett, NATO ASI Series, Kluwer, Dordrecht, The Netherlands, 1992, p. 212 Search PubMed.
- K. Ihokura and J. Watson, The Stannic Oxide Gas Sensors, Principle and Applications, CRC Press, Boca Raton, 1994 Search PubMed.
- T. Otagawa and J. R. Stetter, Sens. Actuators, 1987, 11, 251 CrossRef CAS.
- S. Vaihinger, W. Göpel and J. R. Stetter, Sens. Actuators, B, 1991, 4, 337 CrossRef.
- J. W. Gardner, Sens. Actuators, B, 1990, 1, 166 CrossRef.
- W. M. Sears and K. Colbow, Sens. Actuators, 1989, 19, 333 CrossRef CAS.
- S. Wlodek, K. Colbow and F. Consadori, Sens. Actuators, B, 1991, 3, 63 CrossRef.
- M. Roth, R. Hartinger, R. Faul and H.-E. Endres, Sens. Actuators, B, 1996, 35–36, 358 CrossRef.
- B. Yea, T. Osaki, K. Sugahara and R. Konishi, Sens. Actuators, B, 1997, 41, 121 CrossRef.
- A. Heilig, N. Bârsan, U. Weimar, M. Schweizer-Berberich, J. W. Gardner and W. Göpel, Sens. Actuators, B, 1997, 43, 45 CrossRef.
- K. Yoshikawa, Y. Kato and M. Kitora, Sens. Actuators, B, 1997, 40, 33 CrossRef.
- T. A. Kunt, T. J. McAvoy, R. E. Cavicchi and S. Semancik, Sens. Actuators, B, 1998, 53, 24–43 CrossRef.
- A. P. Lee and B. J. Reedy, Sens. Actuators, B, 1999, 60, 35 CrossRef.
- H. Kohler, J. Röber, N. Link and I. Bouzid, Sens. Actuators, B, 1999, 61, 163 CrossRef.
- M. Jaelge, J. Wöllenstein, T. Meisinger, H. Böttner, G. Müller, T. Becker and C. B.-v.Braunmühl, Sens. Actuators, B, 1999, 57, 130 CrossRef.
- K. Kato, Y. Kato, K. Takamatsu, T. Udaka, T. Nakahara, Y. Matsuura and K. Yoshikawa, Sens. Actuators, B, 2000, 71, 192 CrossRef.
- R. Ionescu and E. Llobet, Sens. Actuators, B, 2002, 81, 289 CrossRef.
- X. Huang, F. Meng, Z. Pi, W. Xu and J. Liu, Sens. Actuators, B, 2004, 99, 444 CrossRef.
- K. J. Albert, N. S. Lewis, C. L. Schauer, G. A. Sotzing, S.E. Sitzel, T. P. Vaid and D. R. Walt, Chem. Rev., 2000, 100, 2595 CrossRef CAS.
- G. J. Gouws and D. J. Gouws, Sens. Actuators, B, 2003, 91, 326 CrossRef.
- Chemical Analysis Based on Nonlinearity, ed. S. Nakata, NOVA, New York, 2003, ISBN: 1-59033-737-9 Search PubMed.
- S. Nakata, Y. Kaneda, H. Nakamura and K. Yoshikawa, Chem. Lett., 1991, 1505 CAS.
- S. Nakata, H. Nakamura and K. Yoshikawa, Sens. Actuators, B, 1992, 8, 187 CrossRef.
- S. Nakata, S. Akakabe, M. Nakasuji and K. Yoshikawa, Anal. Chem., 1996, 68, 2067 CrossRef CAS.
- S. Nakata, E. Ozaki and N. Ojima, Anal. Chim. Acta, 1998, 361, 93 CrossRef CAS.
- S. Nakata, T. Hashimoto and H. Okunishi, Analyst, 2002, 127, 1642 RSC.
- S. Nakata, H. Okunishi and S. Inooka, Anal. Chim. Acta, 2004, 517, 153 CrossRef CAS.
- S. Nakata, T. Nakamura, K. Kato, Y. Kato and K. Yoshikawa, Analyst, 2000, 125, 517 RSC.
- N. Yamazoe, Y. Kurokawa and T. Seiyama, Sens. Actuators, 1983, 4, 283 CrossRef CAS.
- S. Yasunaga, S. Sunahara and K. Ihokura, Sens. Actuators, 1986, 9, 133 CrossRef CAS.
- Y. Matsuura, K. Takahata and K. Ihokura, Sens. Actuators, 1988, 14, 223 CrossRef CAS.
- P. K. Clifford and D. T. Tuma, Sens. Actuators, 1982/83, 3, 233 Search PubMed.
- M. J. Madou and S. R. Morrison, Chemical Sensing with Solid State Devices, Academic, New York, 1989 Search PubMed.
- S. Nakata, H. Okunishi, Y. Nakashima and T. Mori, Chem. Lett., 2005, 34, 186 CrossRef CAS.
- M. Stopfer and G. Laurent, Nature, 1999, 402, 664 CrossRef CAS.
- P. Èrdi, I. Aradi, Y. Kato and K. Yoshikawa, BioSystems, 1998, 46, 107 CrossRef CAS.
| This journal is © The Royal Society of Chemistry 2006 |
