Photochemical reaction mechanisms of 2-nitrobenzyl compounds: 2-Nitrobenzyl alcohols form 2-nitroso hydrates by dual proton transfer†‡
Martin
Gaplovsky
,
Yuri V.
Il'ichev§
*,
Yavor
Kamdzhilov
,
Svetlana V.
Kombarova§
,
Marek
Mac¶
,
Markus A.
Schwörer
and
Jakob
Wirz
*
Departement Chemie der Universität Basel, Klingelbergstr. 80, CH-4056 Basel, Switzerland. E-mail: J.Wirz@unibas.ch; Fax: +41 61 267 38 55; Tel: +41 61 267 38 42
First published on 11th August 2004
Abstract
Irradiation of 2-nitrobenzyl alcohol (1, R = H) and 1-(2-nitrophenyl)ethanol (1, R = Me) in various solvents yields 2-nitroso benzaldehyde (4, R = H) and 2-nitroso acetophenone (4, R = Me), respectively, with quantum yields of about 60%. The mechanism of this reaction, known since 1918, was investigated using laser flash photolysis, time-resolved infrared spectroscopy (TRIR), and 18O-labeling experiments. The primary aci-nitro photoproducts 2 react by two competing paths. The balance between the two depends on the reaction medium. Reaction via hydrated nitroso compounds 3 formed by proton transfer prevails in aprotic solvents and in aqueous acid and base. In water, pH 3–8, the classical mechanism of cyclization to benzisoxazolidine intermediates 5, followed by ring opening to carbonyl hydrates 6, predominates. The transient intermediates 3 and 6 were identified by TRIR. Potential energy surfaces for these reactions were mapped by density functional calculations.
Introduction
2-Nitrobenzyl compounds have found numerous applications as photoremovable protecting groups.1 Their photoreactions are initiated by an intramolecular 1,5-H shift yielding aci-nitro protomers as primary photoproducts. Cyclisation to short-lived benzisoxazolidines is generally assumed to be the next step (Scheme 1, path a). In a recent paper2 we reported the first direct observation of such a cyclic intermediate. Here we show that a different reaction path exists for 2-nitrobenzyl alcohols 1 (R = H or Me). The primary aci-nitro intermediates 2 form nitroso hydrates 3 by proton transfer. Dehydration of 3 yields the 2-nitrosobenzoyl products 43 (path b). Partitioning between the classical reaction via path a (cyclization to 5 followed by ring opening to the carbonyl hydrate 6) and path b (proton transfer) depends strongly on the reaction medium.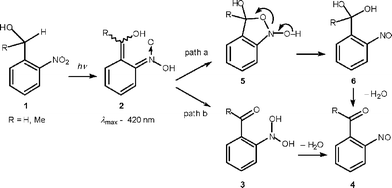 | ||
| Scheme 1 | ||
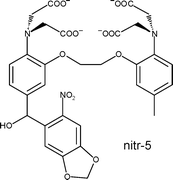
Both reaction paths shown in Scheme 1 do not release the R group. Nevertheless, Tsien et al.4 observed fast photoinduced release of Ca2+ from a 2-nitrobenzyl alcohol derivative of BAPTA (1,2-bis(o-aminophenoxy)ethane-N,N,N′,N′-tetraacetic acid), ‘nitr-5’. The photoreaction lowers the Ca2+ affinity of the BAPTA ligand by replacing the electroneutral benzhydrol 1 with an electronegative phenone 4.
Experimental
Methods
The apparatus used for nanosecond LFP and TRIR as well as the methods of data analysis have been described.2 Neither the amplitudes nor the kinetics of the transient absorptions were influenced by degassing. Therefore, most measurements were done with air-saturated solutions.Quantum yields for the formation of the nitroso compounds 4 were determined by spectrophotometric monitoring of the absorbance changes. A medium-pressure mercury lamp equipped with a 365 nm band-pass filter was used as a light source. Actinometry was done with a solution of azobenzene in methanol.5
Picosecond pump–probe spectroscopy was done with a Ti:Sa laser system Clark MXR CPA-2001 (775 nm, pulse energy 0.8 mJ, full width at half maximum 150 fs, operating frequency 426 Hz). Part of the beam was fed into a Clark-MXR NOPA. The output at 540 nm was frequency-doubled to 270 nm, and after the compression provided pump pulses with an energy of 1 µJ and <100 fs pulse width. A probe beam continuum (300–680 nm) was produced by focusing part of the 775 nm beam 1 mm in front of a CaF2 crystal of 2 mm path length. The detection system has been described.6 Two-photon absorption is observed when the pump and probe pulses coincide at the sample. The FWHM of the two-photon absorption in water was 250 fs, which provides a measure of the time resolution of the detection system. Typically, several hundred spectra were collected and averaged for each delay. The translation stage allowed for a maximum time delay of 1.8 ns for the probe beam.
Materials
2-Nitrobenzyl alcohol (1, R = H, Fluka) was purified by recrystallisation from ethanol. 1-(2-Nitrophenyl)-ethanol (1, R = Me) was prepared by reduction of 2-nitroacetophenone (Aldrich) with NaBH4.7 2-Nitrosobenzaldehyde (4, R = H) was synthesised from anthranil.2 Bidistilled water was used to prepare aqueous solutions. All other solvents were of spectroscopic grade and were used as received. The absorbance of the neat solvents at 248 nm was less than 0.01 at 1 cm path length.Isotopic labelling of the alcohol oxygen atom of 1 (R = H) was done as follows. 2-Nitrobenzaldehyde (0.5 g, Fluka) in 14 ml of acetonitrile was mixed with a solution of 0.15 ml 70% HClO4 in 7.5 ml 2H218O (about 75 % 18O). The solution was kept at room temperature for 2 h, neutralised with NaHCO3, and extracted with methylene chloride. The organic extract was dried over MgSO4, filtered and evaporated to dryness, leaving 0.425 g of a white solid, mp 43 °C. The isotopic purity of the resulting labelled 2-nitrobenzaldehyde was about 70%, as estimated from the ratio of the mass peaks at m/z = 123 and 121. Reduction with NaBH47 gave 1 (R = H). Its isotopic purity was determined as 65 ± 1% 18O from the ratios of the mass peaks at 150/152, 135/137 and 105/107.
Calculations
Density functional theory (DFT) calculations were performed with the GAUSSIAN 988 package of programs. All geometries were fully optimised at the B3LYP level of theory with the 6-31G(d) basis set. Starting geometries were those optimised at the HF/6-31G(d) level. Wavefunction stability was tested for all energy minima, and vibrational frequencies were calculated by using analytical second derivatives. All quoted energies include zero-point vibrational energy corrections that were scaled with a factor of 0.9806.9 For comparison with IR spectra a scaling factor of 0.9613 was used.9 This level of theory gave satisfactory results in previous related studies.10 For all molecules, single-point energies were computed using B3LYP functionals with the 6-311+G(2d,p) basis set at the B3LYP/6-31G(d) geometries. Transition states were located with the Gaussian implementation of the STQN method. Reaction pathways were followed using the ‘intrinsic reaction coordinate’ (IRC) approach to verify the correspondence between the transition states and the minimum-energy structures. Self-consistent reaction field (SCRF) calculations with the polarized continuum model (PCM) of Tomasi et al.11 were utilized to estimate solvent effects. Aqueous acidity constants were calculated using the approach of Pliego and Riveros12 at the level of DFT described above. This method predicts pKa values within about 2 units, e.g., pKa values of 2.5 for formic acid (exp: pKa = 3.75)2 and 4.3 for the aci-form of 2-nitrotoluene (3.6).13 Electronic excitation energies were calculated using the random phase approximation for a time-dependent DFT calculation14 with the B3LYP/6-311+G(2d,p) basis set. A list of the coordinates and energies of all optimised structures is available as supplementary material.‡Results
Continuous irradiations and quantum yields
Irradiation of 2-nitrobenzyl alcohol (1, R = H) in hexane at 365 nm induced the formation of new absorption bands at 234 and 282 nm and a very weak band with a maximum at 760 nm that is characteristic for nitroso compounds. The initial absorbance changes indicated a clean formation of 2-nitrosobenzaldehyde (4, R = H), which was identified by comparison of its IR and mass spectra with an authentic sample.2 The electronic spectrum of (4, R = H) was determined with the authentic sample in hexane solution with 0.3% CHCl3: λmax = 234 nm, ε ≈ 17![[hair space]](https://www.rsc.org/images/entities/char_200a.gif) 000 M−1 cm−1, 282 nm, ε
≈ 7500 M−1 cm−1, shoulder at ca. 310 nm, ε
≈ 3000 M−1 cm−1. Product 4
(R = H) is also sensitive to irradiation, so that complete photoconversion of 1
(R = H) and isolation of 4
(R = H) from the reaction mixture was not attempted.
000 M−1 cm−1, 282 nm, ε
≈ 7500 M−1 cm−1, shoulder at ca. 310 nm, ε
≈ 3000 M−1 cm−1. Product 4
(R = H) is also sensitive to irradiation, so that complete photoconversion of 1
(R = H) and isolation of 4
(R = H) from the reaction mixture was not attempted.
Similar spectral changes were observed upon irradiation of 1-(2-nitrophenyl)ethanol (1, R = Me) in hexane. In this case, the photoproduct 2-nitrosoacetophenone (4, R = Me) was sufficiently stable under the irradiation conditions to allow near-complete photoconversion. The final absorption spectrum obtained in this manner agrees with that of 4 (R = Me).15
The spectral changes observed upon irradiation of acidic aqueous solutions of 1 (R = H, Fig. 1a) and of 1 (R = Me, Fig. 1b) with UV light were similar to those in hexane solutions. The rise of absorption at 780 nm indicated the formation of 4 (R = Me) upon irradiation, Fig. 1c.
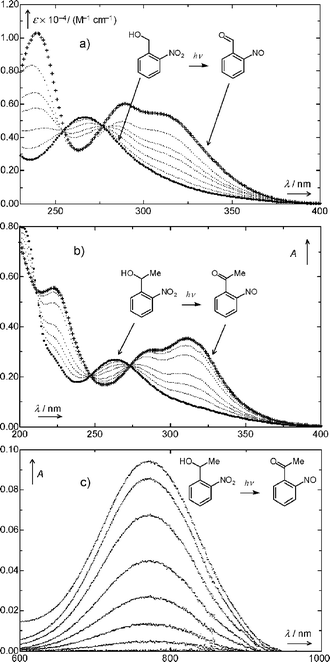 | ||
| Fig. 1 (a) Absorption spectra of 1 (R = H, 7.0 × 10⁻⁵ M) in 1 mM aqueous HCl recorded before (⋯) and after irradiation at 365 nm. Irradiation times between measurements were 1, 3, 6, 9, and 19 min. A spectrum of authentic 2-nitrosobenzaldehyde (4, R = H) is also shown (+++). (b) Absorption spectra of 1 (R = Me, 6.4 × 10⁻⁵ M) in 1 mM aqueous HCl recorded before (⋯) and after irradiation (+++) at 365 nm. Irradiation times: 1.5, 3.5, 6.5, 15.4, 25.0, 50.0, and 65.2 min. (c) Absorption spectra recorded before and after irradiation of 1 (R = Me, 3.4 × 10⁻³ M) in hexane at 365 nm. Irradiation times: 12.5, 38.0, 85.0, 165.1, 305.3, 496.3, and 2067 min. | ||
The progress of the photoreaction 1
→
4 was determined spectrophotometrically assuming a clean reaction at low conversions. The quantum yields for irradiation at 365 nm were estimated by using the linear interpolation method5 or by direct numerical integration of the rate equation. Consistent results were obtained by the two methods. The quantum yields were essentially independent of the solvent and of pH in water: ϕ
= 0.52 ± 0.05 for 1
(R = H) in hexane, acetonitrile, ethanol, 1 mM aqueous HCl, and 50 mM aqueous phosphate buffer (Na2HPO4/NaH2PO4
= 1![[thin space (1/6-em)]](https://www.rsc.org/images/entities/char_2009.gif) ∶
∶![[thin space (1/6-em)]](https://www.rsc.org/images/entities/char_2009.gif) 1), and ϕ
= 0.67 ± 0.10 for 1
(R = Me) in the same solvents. Quantum yields could not be determined in aqueous base due to instability of the nitroso compounds 4 in this medium.
1), and ϕ
= 0.67 ± 0.10 for 1
(R = Me) in the same solvents. Quantum yields could not be determined in aqueous base due to instability of the nitroso compounds 4 in this medium.
Photodehydration of 18O-labeled 1 (R = H)
Solutions of 18O-labelled 1 (R = H, ca. 1 × 10⁻³ M, 65 ± 1% 18O isotopic purity at the alcohol function) in hexane, abs. ethanol, acetonitrile, and abs. methanol were irradiated for 2 h (40–70% conversion) with the 254 nm line of a mercury arc lamp. The isotopic purity of product 4 (R = H) was determined by GC–MS using the 135/137 mass peak ratio. The 18O isotopic purity determined for 4 (R = H) after irradiation in hexane was 62.8 ± 1.3 (4 batches), indicating essentially complete retention (96.6 ± 2.5%). Retention in polar solvents was lower, 60% in acetonitrile and 36% in methanol. However, a control experiment showed that noticeable 18O-depletion occurred within minutes even in ‘dry’ acetonitrile (≤ 0.014% H2O), apparently due to exchange of the carbonyl oxygen of 4via reversible hydration16 by traces of water. Hence, the retention data determined for acetonitrile and methanol solutions must be considered as lower limits.Laser flash photolysis (LFP)
Transient kinetics at 320 nm showed an unresolved step (ΔA = 0.02), followed by a fast partial decay (ΔA = 0.005) due presumably to the blue edge of the aci-nitro transient, and finally a very slow growth to an end absorbance, ΔA∞ ≈ 0.04, with a rate constant of about 1.5 s−1.
The decay of the aci-nitro transient 2, λmax ≈ 390 nm, formed by LFP of 1 (R = Me) in hexane obeyed a first-order rate law. However, the rate constant increased linearly with the concentration of the starting material, and a bimolecular rate constant of k ≈ 6 × 10⁸ M−1 s−1 was determined from the slope of this concentration dependence. At an observation wavelength of 320 nm, a weak step and partial decay, due presumably to the blue edge of the 400 nm transient, was followed by a very slow growth in absorbance with a rate constant of about 1 s−1.
The decay of the aci-nitro transient, λmax = 425 nm, formed by LFP of 1 (R = H) in acetonitrile required fitting with a bi-exponential rate law. A slight shift of the transient absorption maximum from 425 to 415 nm was observed during the decay of the fast component, k ≈ 4.5 × 10⁵ s−1. The slow component had a larger amplitude, Aslow/Afast = 2.8, and a decay rate constant of about 2 × 10⁴ s−1. Although the rate constants could be determined accurately and reproducibly for a given sample, their values varied considerably when different batches of solvent were used. This was found to arise from variations in the water (or acid) content of different solvent batches. The second rate constant increased markedly upon addition of water: 6 × 10⁴ s−1 (5% v/v), 1.4 × 10⁵ s−1 (10%), 5 × 10⁵ s−1 (20%), 1.3 × 10⁷ s−1 (40%). The two transients merged to a single first-order decay, k = 2.2 × 10⁶ s−1, in a solution containing 20% water, but a slower decay, k ≈ 7 × 10⁴ s−1, reappeared at water contents exceeding 80%. At 320 nm, a fast initial step, ΔA/Amax = 0.14, was followed by a bi-exponential growth in absorbance with rate constants of about 2 × 10⁵ s−1 (relative amplitude ΔA/Amax = 0.1) and 20 s−1 (ΔA/Amax = 0.76).
LFP of 1 (R = Me) in dry acetonitrile also gave a double exponential decay, k1 = 1.1 × 10⁶ s−1, k2 = 2.7 × 10⁴ s−1 at 415 nm. These rates were also found to be very sensitive to water, particularly that of the the slower decay. After addition of 1% (v/v) water these rate constants were k1 = 1.2 × 10⁶ s−1, k2 = 2.6 × 10⁵ s−1. They merged to a single first-order decay, k = 2.2 × 10⁶ s−1, in a solution containing 5% water and reached the detection limit, k ≈ 5 × 10⁷ s−1, in the presence of 20% water. In contrast, the resolved growth observed at 320 nm was slowed down by the addition of water. The growth curves were best fitted by a bi-exponential function with rate constants of k1 = 24 s−1, k2 = 480 s−1 (0% water), k1 = 2.3 s−1, k2 = 41 s−1 (5% water), and k1 = 1.7 s−1, k2 = 7.5 s−1 (10% water).
Flash photolysis of 1 (R = H) at 24818 or 308 nm in aqueous solutions was done over a pH range of 1–13 that was adjusted with HCl, NaOH, or buffers. Ionic strength was kept constant at I = 0.1 M by addition of NaCl. Kinetic traces obtained in 10 mM aqueous phosphate buffer, pH = 6.8, are shown in Fig. 2. The decay of the aci-transient, 410 nm, was biexponential. The relative amplitude of the faster component was larger at longer wavelengths of observation (470 nm). In the traces recorded at 320 nm, the amplitude ratio of step and growth increased with pH, from Astep/Agrowth ≈ 0.1 (0.1 M HClO4), ≈ 0.3 (acetic acid buffers), ≈ 1 (carbonate buffers), and ≈ 10 (0.1 M NaOH). In acetic acid buffers the growth curves at 780 nm were consistent with those observed at 330 nm, which proved that the growth kinetics determined in the UV represents the formation of a nitroso compound. Finally, on time scales of s to min, a strong increase in absorbance at 230 nm associated with a partial decay of the absorbance at 320 nm occurred. These spectral changes were very similar to those of the decay of the hemiacetal formed from 2-nitrobenzyl methyl ether (Fig. 6 of ref. 2). They are attributed to dehydration of the carbonyl hydrate 6. The product 4 (R = H) was unstable in basic solutions (τ ≈ 2 min in 0.01 M NaOH).
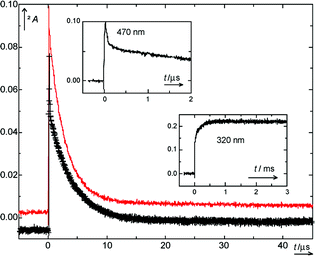 | ||
Fig. 2 Kinetic traces recorded by 248 nm excitation of 1 (R = H) in 10 mM aqueous phosphate buffer (1![[thin space (1/6-em)]](https://www.rsc.org/images/entities/char_2009.gif) ∶ ∶![[thin space (1/6-em)]](https://www.rsc.org/images/entities/char_2009.gif) 1, pH = 6.78, I 1, pH = 6.78, I![[thin space (1/6-em)]](https://www.rsc.org/images/entities/char_2009.gif) = =![[thin space (1/6-em)]](https://www.rsc.org/images/entities/char_2009.gif) 0.1) at 410 nm (— upper trace) and at 470 nm (+−+ lower trace). Upper left inset: 470 nm trace at higher time resolution. Lower right inset: 320 nm trace. 0.1) at 410 nm (— upper trace) and at 470 nm (+−+ lower trace). Upper left inset: 470 nm trace at higher time resolution. Lower right inset: 320 nm trace. | ||
The observed rate constants of both transient decays at 420 nm, and of the growth of product absorption at 320 nm depended linearly on total buffer concentration. Bimolecular rate coefficients for buffer catalysis were determined from the linear dependencies of the observed first-order rate constants on total buffer concentrations. Buffer slopes for the faster decay component at 420 nm could not be determined accurately. Buffer slopes obtained for different buffer ratios were plotted against the mole fraction of the acidic buffer component, xHA, to determine the catalytic coefficients of the acid (HA) and base (A−) components of the buffers from the intercepts at xHA = 1 and 0, respectively. The resulting rate coefficients for the acid and base components of the buffers are given in Table 1. Both general acid and general base catalysis was found for the aci-decay, but only general base catalysis was significant for the growth of the 320 nm absorption (kNO).
| Second aci-component | NO formation | |||
|---|---|---|---|---|
| Buffer | pKa,ca | k B/(M−1 s−1) | k HB/(M−1 s−1) | k B/(M−1 s−1) |
| a Buffer acidity quotients at 25 °C, ionic strength I = 0.1 M.19 | ||||
| HAc/NaAc | 4.57 | ∼ 1 × 10⁸ | (5 ± 1) × 108 | (1.1 ± 0.2) × 104 |
| H2PO4−/HPO42− | 6.78 | (2.2 ± 0.2) × 107 | (2.2 ± 0.1) × 107 | (9 ± 3) × 105 |
| HCO3−/ CO32– | 9.91 | (4 ± 1) × 108 | 4 × 10⁷ | 3 × 10⁸ |
Rate constants for wholly aqueous solutions (Table 2) were obtained by linear extrapolation to zero buffer concentration. The resulting pH–rate profiles are depicted in Fig. 3. The solid lines were obtained by nonlinear least-squares fitting of eqn. (1) to the data points for the second component of the aci-decay (k2aci), and of eqn. (2) to those for reactions 5 → 6 (kNO) and 6 → 4 (kCO). The resulting values for the fit parameters are given in Table 3 and the parameters are identified in the Discussion.
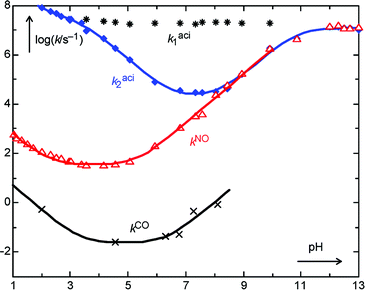 | ||
| Fig. 3 pH–rate profile for the transient kinetics obtained by LFP of 1 (R = H) in wholly aqueous solution. The two upper series of data points (* * * and ♦–♦–) represent the two components of the bi-exponential decay of the aci-transient 2 at 420 nm (k1aci and k2aci). The middle trace (Δ–Δ–Δ) shows the resolved growth in absorbance at 320 nm (kNO) due mostly to formation of 6 from 5. The bottom trace (×–×–×) shows the slow partial decay of absorbance at 320 nm (kCO) attributed to formation of 4 by dehydration of 6. The solid lines show the fitted eqn. (1) and (2). | ||
![[thin space (1/6-em)]](https://www.rsc.org/images/entities/char_2009.gif) =
=![[thin space (1/6-em)]](https://www.rsc.org/images/entities/char_2009.gif) 0.1 M)a
0.1 M)a
| pHb | k 1 aci /s−1 | k 2 aci /s−1 | k NO/s−1 | k CO/s−1h |
|---|---|---|---|---|
| a Solutions were adjusted to an ionic strength I = 0.1 M by addition of NaCl. All measurements were done at ambient temperature, 20 ± 1 °C. b pH ≤ 3.5: nominal HCl concentrations. 10.0 ≤ pH ≤ 13.0: calculated from nominal NaOH concentrations using Kw (I = 0.1 M, 20 °C) = 1.08 × 10⁻¹⁴ M2. c Acetic acid buffer ≤ 0.05 M. d Sodium phosphate buffer ≤ 0.08 M. e Na2B4O7/HCl buffer ≤ 0.022 M. f Na2CO3/NaHCO3 buffer ≤ 0.05 M. g Tris buffer ≤ 0.1 M. h Dilute buffer solution were used to minimize buffer catalysis. Rate constants did not change significantly in the buffer concentration ranges indicated. The original rate data are available as supplementary material.2 | ||||
| 1.00 | 596 | |||
| 1.15 | 399 | |||
| 1.30 | 330 | |||
| 1.52 | 220 | |||
| 1.70 | 156 | |||
| 2.00 | 7.80 × 10⁷ | 108 | 0.54 | |
| 2.30 | 5.85 × 10⁷ | 83.5 | ||
| 2.52 | 4.64 × 10⁷ | 66.7 | ||
| 2.70 | 3.70 × 10⁷ | 57.4 | ||
| 2.95 | 2.62 × 10⁷ | 43.0 | ||
| 3.00 | 2.59 × 10⁷ | 43.3 | ||
| 3.03 | 2.62 × 10⁷ | 43.0 | ||
| 3.38 | 1.92 × 10⁷ | 34.0 | ||
| 3.56c | 2.61 × 10⁷ | 9.01 × 10⁶ | 32.5 | |
| 4.16c | 2.23 × 10⁷ | 4.66 × 10⁶ | 30.7 | |
| 4.56c | 2.16 × 10⁷ | 1.87 × 10⁶ | 33.5 | 2.58 × 10⁻² |
| 5.07c | 1.81 × 10⁷ | 6.25 × 10⁵ | 43.5 | |
| 5.93d | 1.93 × 10⁷ | 7.90 × 10⁴ | 194 | |
| 6.30d | 4.42 × 10⁻² | |||
| 6.78d | 1.92 × 10⁷ | 3.39 × 10⁴ | 1.02 × 10³ | 5.33 × 10⁻² |
| 7.36d | 1.79 × 10⁷ | 2.89 × 10⁴ | 3.21 × 10³ | 0.47 |
| 7.57d | 2.09 × 10⁷ | 2.96 × 10⁴ | 3.75 × 10³ | |
| 8.04e | 2.01 × 10⁷ | 3.23 × 10⁴ | 2.21 × 10⁴ | |
| 8.12g | 0.88 | |||
| 8.43e | 2.06 × 10⁷ | 4.07 × 10⁴ | 5.48 × 10⁴ | |
| 8.95f | 1.82 × 10⁷ | 1.67 × 10⁵ | 1.65 × 10⁵ | |
| 9.91f | 1.84 × 10⁷ | 1.87 × 10⁶ | 1.74 × 10⁶ | |
| 10.86 | 4.56 × 10⁶ | 4.08 × 10⁶ | ||
| 12.00 | 1.35 × 10⁷ | 1.34 × 10⁷ | ||
| 12.30 | 1.27 × 10⁷ | 1.41 × 10⁷ | ||
| 12.48 | 1.21 × 10⁷ | 1.14 × 10⁷ | ||
| 12.70 | 1.21 × 10⁷ | 1.09 × 10⁷ | ||
| 13.00 | 1.03 × 10⁷ | 1.21 × 10⁷ | ||
![[thin space (1/6-em)]](https://www.rsc.org/images/entities/char_2009.gif) →
→![[thin space (1/6-em)]](https://www.rsc.org/images/entities/char_2009.gif) 5 (R = H) and eqn. (2) to those for 5
5 (R = H) and eqn. (2) to those for 5![[thin space (1/6-em)]](https://www.rsc.org/images/entities/char_2009.gif) →
→![[thin space (1/6-em)]](https://www.rsc.org/images/entities/char_2009.gif) 6/3
6/3![[thin space (1/6-em)]](https://www.rsc.org/images/entities/char_2009.gif) →
→![[thin space (1/6-em)]](https://www.rsc.org/images/entities/char_2009.gif) 4 (kNO) and 6
4 (kNO) and 6![[thin space (1/6-em)]](https://www.rsc.org/images/entities/char_2009.gif) →
→![[thin space (1/6-em)]](https://www.rsc.org/images/entities/char_2009.gif) 4 (kCO) in wholly aqueous solution (Table 2 and Fig. 3)a
4 (kCO) in wholly aqueous solution (Table 2 and Fig. 3)a
| a Mechanistic assignments of these coefficients are given in the Discussion (see Scheme 7). | |||
|---|---|---|---|
| coefficient | k 2 aci , eqn. (1) | k NO, eqn. (2) | k CO, eqn. (2) |
| k H/(M−1 s−1) | (5 ± 2) × 109 | (6.3 ± 0.6) × 103 | 52 ± 32 |
| k 0/s−1 | (3.5 ± 0.9) × 107 | 34 ± 3 | (2.3 ± 1.3) × 10−2 |
| k OH/(M−1 s−1) | (1.1 ± 0.1) × 1010 | (6.3 ± 0.3) × 105 | |
| k 0′/s−1 | (1.9 ± 0.3) × 104 | ||
| k 0″/s−1 | (1.2 ± 0.1) × 107 | ||
| K a,1/M | (5 ± 2) × 10−4 | ||
| K a,2/M | (1.3 ± 0.2) × 10−12 | ||
LFP of 2-nitrophenyl ethanol (1, R = Me) in water gave no transient absorption attributable to an aci-nitro intermediate at any pH, in sharp contrast to 1 (R = H). As the reaction quantum yields of both compounds are about the same, we suspected that only the fast, pH-independent component of the aci-transients is formed, and that it escaped detection by nanosecond LFP of 1 (R = Me). Indeed, pump–probe spectroscopy of 1 (R = Me) in water produced a strong transient intermediate, λmax ≈ 420 nm, that was formed with a rate constant of (9 ± 1) × 1011 s−1 and decayed on the subnanosecond time scale, k = (3.8 ± 0.2) × 109 s−1.
| log(k2aci/s−1) = log[{kH[H+]3 + k0[H+]2 + k0′Ka,1[H+] + k0″Ka,1Ka,2}/(M2 s−1)] − log[{[H+]2 + Ka,1[H+] + Ka,1Ka,2}/M2] | (1) |
| log(kNO or CO/s−1) = log[(k0 + kH[H+] + kOHKw/[H+])/s−1] | (2) |
The longer-lived transient intermediates observed by LFP of 1 (R = Me) were similar to those described above for 1 (R = H). Step-and-growth kinetic traces were obtained at 330 nm (cf. the lower inset of Fig. 2). The ratio of the amplitudes, Astep/Agrowth, increased strongly with pH, from 0.1 in 0.01 M HClO4 (kgrowth = 1.0 × 10² s−1) and in acetic acid buffer (buffer ratio 0.05 M CH3CO2H/0.01 M CH3CO2Na, pH = 3.87, kgrowth = 88 s−1), to 0.4 (kgrowth = 2.0 × 10² s−1) in non-buffered water, to 8 (kgrowth = 1.1 × 10⁷ s−1) in 0.1 M aqueous NaOH. These rate constants are close to those determined for 1 (R = H). Finally, formation of the product 4 (R = Me) was observed on a time scale of seconds to minutes (pH 1–8) by an absorbance increase at 230 nm and partial absorbance decay at 320 nm.
Time-resolved infrared (TRIR) measurements
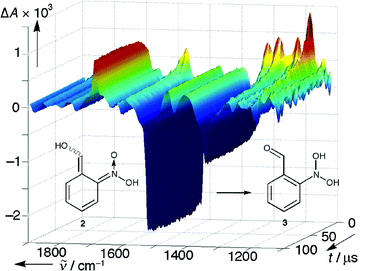
A solution of 36.5 mg 2-nitrobenzyl alcohol (1, R = H) in 22 ml acetonitrile-d3 was photolysed with 6 ns, 266 nm pulses from a Nd:YAG laser. The changes induced in the IR spectra were monitored by the step–scan technique. A 3D plot of the time-dependent spectra is shown in Fig. 4.The initial difference spectrum (1 µs after the laser flash) is dominated by bleaching of the absorption bands of 1 at 1348 and 1527 cm−1, and new absorption bands at 1190, 1223, 1290, 1319, 1573 (asymm. stretch C![[double bond, length as m-dash]](https://www.rsc.org/images/entities/char_e001.gif) C–O), and 1619 cm−1
(asymm. stretch C
C–O), and 1619 cm−1
(asymm. stretch C![[double bond, length as m-dash]](https://www.rsc.org/images/entities/char_e001.gif) N–O) that are due to the formation of an aci-nitro compound 2
(R = H). The assignments are based on the results of DFT calculations, which were done for each of the four geometrical isomers of 2.20 Moreover, a strong absorption band at 1695 cm−1 is present in the first spectrum. It is attributed to the C
N–O) that are due to the formation of an aci-nitro compound 2
(R = H). The assignments are based on the results of DFT calculations, which were done for each of the four geometrical isomers of 2.20 Moreover, a strong absorption band at 1695 cm−1 is present in the first spectrum. It is attributed to the C![[double bond, length as m-dash]](https://www.rsc.org/images/entities/char_e001.gif) O stretch of 3. The spectrum lacks absorption near 1500 cm−1, indicating the absence of a nitroso group. In the subsequent spectra, the C
O stretch of 3. The spectrum lacks absorption near 1500 cm−1, indicating the absence of a nitroso group. In the subsequent spectra, the C![[double bond, length as m-dash]](https://www.rsc.org/images/entities/char_e001.gif) O band increases further, concomitant with the decay of the aci-nitro bands.
O band increases further, concomitant with the decay of the aci-nitro bands.
Component analysis of the difference spectra, Fig. 4, indicated the presence of two significant spectral components, i.e., a uniform conversion 2
→
3. The latter was persistent up to 100 µs. Least-squares fitting of a single exponential function to the reduced data set left residuals within the noise level and gave a rate constant of (6.7 ± 0.4)
× 104 s−1
(ca. 30 °C). Prominent features of the final spectrum are the bands at 1184 (1170, ring stretch), 1416 (1380, OH bend), 1466 (1433, OH bend), 1695 (1692, C![[double bond, length as m-dash]](https://www.rsc.org/images/entities/char_e001.gif) O stretch) cm−1. The wavenumbers and assignments given in brackets were obtained by DFT calculations for 3
(R = H). LFP of 1
(R = H) in acetonitrile solution gave bi-exponential decay traces at λmax
= 420 nm, k1aci
= 6 × 10⁵ s−1
(about 15% of the amplitude), and k2aci
= 2 × 10⁴ s−1, in satisfactory agreement with the kinetics determined by TRIR.
O stretch) cm−1. The wavenumbers and assignments given in brackets were obtained by DFT calculations for 3
(R = H). LFP of 1
(R = H) in acetonitrile solution gave bi-exponential decay traces at λmax
= 420 nm, k1aci
= 6 × 10⁵ s−1
(about 15% of the amplitude), and k2aci
= 2 × 10⁴ s−1, in satisfactory agreement with the kinetics determined by TRIR.
Dehydration of intermediate 3
(R = H) to the end product 2-nitrosobenzaldehyde (4, R = H) did not occur in CD3CN within the upper time limit of the step–scan method (1 ms). To accelerate dehydration, 5 mM of D2SO4 were added. The hydrate 3
(R = H) was now formed within 1 µs and the dehydration to 4
(R = H) was observed with a rate constant of k
=
(3.6 ± 0.4)
× 103 s−1
(30 °C, Fig. 5). The reaction 3
→
4 is characterised by the appearance of the N![[double bond, length as m-dash]](https://www.rsc.org/images/entities/char_e001.gif) O stretch band at 1504 cm−1. At the same time, the C
O stretch band at 1504 cm−1. At the same time, the C![[double bond, length as m-dash]](https://www.rsc.org/images/entities/char_e001.gif) O stretch frequency shifts from 1695 (3) to 1700 cm−1
(4). The final spectrum with prominent absorption bands at 1182, 1268 (1242, ring stretch), 1432, 1504 (1540, N
O stretch frequency shifts from 1695 (3) to 1700 cm−1
(4). The final spectrum with prominent absorption bands at 1182, 1268 (1242, ring stretch), 1432, 1504 (1540, N![[double bond, length as m-dash]](https://www.rsc.org/images/entities/char_e001.gif) O stretch), 1699 (1721, C
O stretch), 1699 (1721, C![[double bond, length as m-dash]](https://www.rsc.org/images/entities/char_e001.gif) O stretch) cm−1 was equal to a difference spectrum generated with authentic samples of 1
(R = H) and 4
(R = H).
O stretch) cm−1 was equal to a difference spectrum generated with authentic samples of 1
(R = H) and 4
(R = H).
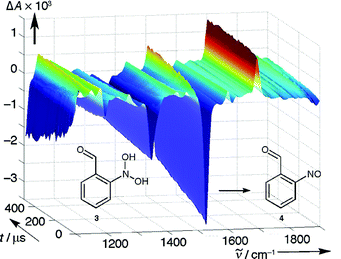 | ||
| Fig. 5 Step–scan IR spectra obtained by irradiation of 1 (R = H) in CD3CN/5 mM D2SO4. | ||
The spectra shown in Fig. 4 and 5 above document the formation and dehydration of intermediate 3
(path b of Scheme 1) in anhydrous acetonitrile solution. The addition of 1% water suffices to direct the reaction predominantly via path a. A fast-scan IR measurement with a CD3CN solution of 1-18O (R = H) containing 1% H2O (Fig. 6) showed that the formation of the nitroso band of 6
(R = H) was largely complete within 1 s. The carbonyl bands at 1670 (C![[double bond, length as m-dash]](https://www.rsc.org/images/entities/char_e001.gif) 18O) and 1699 cm−1
(C
18O) and 1699 cm−1
(C![[double bond, length as m-dash]](https://www.rsc.org/images/entities/char_e001.gif) O, intensity ratio 4:6), rose with a first-order rate constant of k
=
(2.0 ± 0.1)
× 10−3 s−1
(dehydration of 6). Over the same time period, the N
O, intensity ratio 4:6), rose with a first-order rate constant of k
=
(2.0 ± 0.1)
× 10−3 s−1
(dehydration of 6). Over the same time period, the N![[double bond, length as m-dash]](https://www.rsc.org/images/entities/char_e001.gif) O band was shifted from 1498 to 1503 cm−1.
O band was shifted from 1498 to 1503 cm−1.
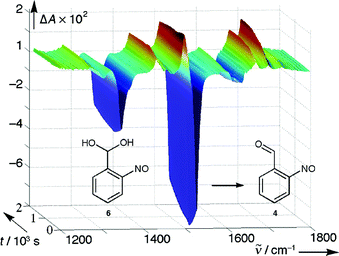 | ||
| Fig. 6 Fast–scan IR spectra taken between 1 and 2000 s after excitation of 18O-labeled 1 (R = H) in CD3CN with 1% H2O. | ||
IR measurements in wholly aqueous solutions (Fig. 7) are more difficult to perform, because strong absorption by the solvent demands the use of very short path lengths. Measurements in D2O were feasible with a path length of 25 µm, necessitating a 10 mM concentration of 1
(R = H) to achieve sufficient absorption of the laser pulse (266 nm). This produced a rather high concentration of the nitroso products (1496 cm−1), which then disappeared, presumably by forming nitroso dimers, with a half-life of about 15 s. However, only about 30% of the C![[double bond, length as m-dash]](https://www.rsc.org/images/entities/char_e001.gif) O band at 1700 cm−1 appears within 1 s after excitation. The major part of the C
O band at 1700 cm−1 appears within 1 s after excitation. The major part of the C![[double bond, length as m-dash]](https://www.rsc.org/images/entities/char_e001.gif) O band grows in with a first-order rate constant of 2.8 × 10⁻² s−1. As the aci-nitro intermediate 2 decays with a rate constant of about 1 × 10⁴ s−1 in neutral aqueous solution, this observation indicates that the major fraction reacts via the long-lived carbonyl hydrate 6
(path a), which then forms NO dimers under the conditions of the IR experiment. Finally, dehydration of the hemiacetal functions is responsible for the slow appearance of the C
O band grows in with a first-order rate constant of 2.8 × 10⁻² s−1. As the aci-nitro intermediate 2 decays with a rate constant of about 1 × 10⁴ s−1 in neutral aqueous solution, this observation indicates that the major fraction reacts via the long-lived carbonyl hydrate 6
(path a), which then forms NO dimers under the conditions of the IR experiment. Finally, dehydration of the hemiacetal functions is responsible for the slow appearance of the C![[double bond, length as m-dash]](https://www.rsc.org/images/entities/char_e001.gif) O band.
O band.
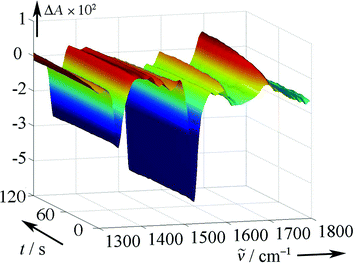 | ||
| Fig. 7 Fast-scan IR spectra obtained by irradiation of 1 (R = H) in D2O. | ||
DFT calculations
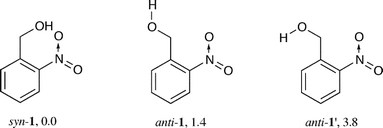 | ||
| Scheme 2 ZPE-corrected energies of 1 (R = H) in kJ mol−1 relative to the syn-conformer as obtained by DFT calculations. | ||
An intramolecular hydrogen bond renders the syn-conformer slightly more stable than anti-1 despite some repulsive interactions in the former: The nitro group in syn-1 is twisted out of the ring plane by 21°, but is coplanar in anti-1. SCRF calculations indicate that the conformational equilibrium shifts towards the anti-isomer in polar solvents. Both conformers have the same energy in acetonitrile, and anti-1 is favoured by 7.6 kJ mol−1 in water (PCM). Both anti- and syn-1 are well disposed for light-induced intramolecular hydrogen transfer from the methylene to the nitro group upon electronic excitation; the closest nonbonded distance between the H–(CH) and O–(NO) atoms is 2.401 Å in anti- and 2.484 Å in syn-1.
The most stable conformer of each of the four geometrical isomers of the quinonoid aci-nitro compound 2 (R = H), EE, ZE, EZ and ZZ, is shown in Scheme 3. The backward reaction from ZE-2 to anti-1 encounters an overall barrier of 65 kJ mol−1 and proceeds via a conformer of ZE-2 with the OH group oriented towards the enol function. Two further isomers of 1 (R = H) were located, namely hydrates of 2-nitrosobenzaldehyde at the nitroso (3, R = H) and at the aldehyde function (6, R = H).
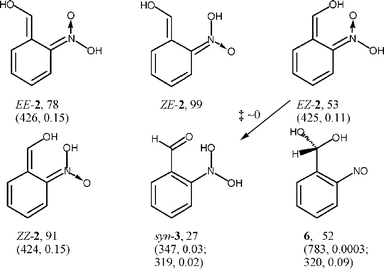 | ||
| Scheme 3 ZPE-corrected energies in kJ mol−1 of 2, 3, and 6 (R = H) relative to syn-1. The calculated positions (λ/nm) and oscillator strengths of the first electronic transition are given in brackets. In aci-compounds 2 the first letter E or Z designates the configuration of OH in the nitronic moiety, the second one that of OH in the enol function. | ||
Formation of the nitroso hydrate syn-3 (R = H) by intramolecular proton transfer from the isomer EZ-2 is calculated to be exothermic by 26 kJ mol−1 with a negligible energy barrier.21 The most stable anti-conformer of 3 has an energy of 20 kJ mol−1 relative to syn-1. For the geometric isomers EE-2 and ZE-2, proton transfer to the nitronic acid function is possible only through the solvent or other proton acceptors. Cyclization of EZ-2 to trans-benzisoxazolidine (trans-5, Scheme 4) is also exothermic by 33 kJ mol−1, but it encounters a large activation barrier of 91 kJ mol−1. The activation barrier for cyclization of EE-2 to cis-benzisoxazolidine (cis-5) is 54 kJ mol−1.
 | ||
| Scheme 4 ZPE-corrected energies in kJ mol−1 relative to that of syn-1 and transition state energies. | ||
| Reaction | ΔG° (gas phase) | pKa (water, PCM) |
|---|---|---|
| a pKa = (ΔrG° + ΔΔsG)/(2.303RT) + 15.74, where ΔrG° is the free energy of the gas-phase reaction AH + OH− = A− + H2O, ΔΔsG is the difference of solvation free energies for the products and reactants, and 15.74 is the pKa of water.12 | ||
| Anti-1 → E-2− | 1429 | 17.5 |
| Syn-1 → Z-2− | 1391 | 13.8 |
| EE-2 → E-2− | 1350 | 4.7 |
| EZ-2 → Z-2− | 1338 | 3.4 |
| EE-2 → anti-3− | 1316 | 4.9 |
| Anti-3 → anti-3− | 1363 | 13.8 |
| Syn-3 → syn-3− | 1356 | 10.3 |
The energies of the most stable conformers of the anions (B3LYP/6-311+G(2d,p)) are given in Scheme 5 relative to that of E-2−; they are corrected using scaled B3LYP/6-31+G(d) zero-point vibrational energies. We also located two conformers of the deprotonated carbonyl hydrate 6, 6−, with energies of −29 and −41 kJ mol−1 relative to E-2−. The enol E-2− is calculated to be 32 kJ mol−1 higher in energy than the aldehyde anti-3−. Thus, the enol function of the aci-compounds 2 is predicted to be a weaker acid than the nitronic acid function in the gas phase, but the calculated acidity constants in aqueous solution are nearly equal.
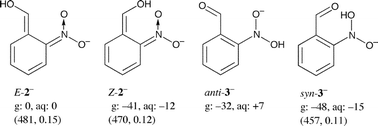 | ||
| Scheme 5 ZP-corrected energies of anions 2− and 3− (R = H, g, 0 K) and free energies (aq, 298 K) in kJ mol−1 relative to E-2−. The calculated positions (λ/nm) and oscillator strengths of the first electronic transition are given in brackets. | ||
Discussion
2-Nitrobenzyl alcohol (1, R = H) and 1-(2-nitrophenyl)ethanol (1, R = Me) are cleanly and efficiently dehydrated to the corresponding 2-nitrosobenzoyl compounds 4 by irradiation in various solvents ranging from hexane to water (Fig. 1). This apparent simplicity is deceptive. The present study shows that two different reaction mechanisms prevail in different reaction media. The primary reaction is very fast intramolecular 1,5-hydrogen transfer, k ≈ 1 × 10¹² s−1,22 leading to aci-nitro intermediates 2. The aci-transients exhibit broad absorption around 420 nm and several strong IR peaks in the range of 1190–1320 cm−1.Four geometrical isomers of the aci-nitro intermediates could, in principle, be formed in the primary photoreaction (Scheme 3), and their kinetic behaviour is expected to be quite different. The yield of the different isomeric aci-intermediates likely depends on the preferred conformation of the benzyl group of 1 in the ground state (ground state conformational control). Calculations indicate that the syn-conformer of 1 is more stable in apolar solvents, and that the anti-conformer is favoured in water. In the following, we attempt to assign the configuration of the observed aci-nitro transients 2, and to identify the secondary transient intermediates observed in various media.
Only the EZ-isomer of 2 is disposed for direct intramolecular proton transfer to form the nitroso hydrate 3 (Scheme 1, path b). Assistance by amphiphilic molecules is required for the other isomers. The primary photochemical reaction is likely to generate the ZE- or ZZ-isomers of 2, in which the proton is transferred to the oxygen atom next to the donating ortho substituent.23 Intramolecular 1,3-proton transfer between the two oxygen atoms of the nitronic acid function (ZE-2 → EE-2 and ZZ-2 → EZ-2, Scheme 3) is expected to be slow in apolar solvents. The activation barrier for 1,3-proton transfer in the aci-form of 2-nitrotoluene was calculated to be 85 kJ mol−1.10a However, this barrier is strongly reduced in protic solvents; a B3LYP/6-31+G(d) calculation including a single water molecule for proton transfer and the polarised continuum model for bulk water reduced that barrier to 42 kJ mol−1.
Photodehydration of 1 (R = H or Me) in hexane
To distinguish between the two general reaction mechanisms proposed in Scheme 1, we determined the retention of the 18O label in the alcohol function of (1-18O, R = H) in the photoproduct 4. Reaction by path b would result in complete retention of the label, while reaction by path a would give about 50% retention. Near-complete retention was found by GC-MS of photoproduct 4 after irradiation of 1-18O (R = H) in hexane, which indicates predominant reaction via path b. Consistently, the DFT calculations predict substantial energy barriers for cyclization of EZ-2 and EE-2 (Scheme 4). Unfortunately, rapid loss of the label in the product 4 prohibited a reliable determination of label retention in more polar solvents.The least-motion path for photoinduced hydrogen transfer from syn-1 (R = H) forms the aci-isomer ZZ-2 as the primary photoproduct (Scheme 6). Indeed, the observation of second-order aci-decay in hexane suggests that ZZ-2 is observed, which in this solvent requires diffusional encounter with a proton transfer catalyst, in this case a second molecule of ZZ-2, to promote proton exchange on the nitronic acid function (ZZ-2 → EZ-2). Once EZ-2 is formed, rapid intramolecular proton transfer gives the nitroso hydrate 3. Such a reaction sequence is consistent with the decreasing DFT energies of the sequential intermediates, and with the negligible energy barrier calculated for the last step, EZ-2 → syn-3.
 | ||
| Scheme 6 Reaction path for 1 (R = H) in hexane and calculated energies in kJ mol−1 relative to syn-1 (R = H). | ||
The decay of 2 (R = Me) in hexane obeyed a first-order rate law, but the observed rate constant increased linearly with the concentration of parent 1 (R = Me). In this case, the rate-determining H-shift ZZ-2 → EZ-2 is apparently accelerated by the protic solute 1 (R = Me). The final dehydration of 3 to 4, as observed by the growth in absorbance at 320 nm, was quite slow in hexane, k ≈ 1 s−1, for both 3 (R = H) and 3 (R = Me).
Taken together, these results indicate that isomer ZZ-2 is the predominant primary photoproduct of 1 (R = H or Me) in hexane solution and that the reaction proceeds by path b of Scheme 1.
![[double bond, length as m-dash]](https://www.rsc.org/images/entities/char_e001.gif) O band at 1695 cm−1) is formed within 1 µs. The rest appears in a time-resolved reaction with a rate constant of about 7 × 10⁴ s−1. The nitroso band (1504 cm−1) is not formed within 100 µs, unless dehydration of 3 is accelerated by the addition of acid (Fig. 5).
O band at 1695 cm−1) is formed within 1 µs. The rest appears in a time-resolved reaction with a rate constant of about 7 × 10⁴ s−1. The nitroso band (1504 cm−1) is not formed within 100 µs, unless dehydration of 3 is accelerated by the addition of acid (Fig. 5).
The slight preference of gas-phase DFT calculations for the syn-conformer of 1 (R = H) tilts towards the anti-conformer in polar media. Photoinduced hydrogen transfer from the latter is expected to yield predominantly ZE-2 as the primary photoproduct. A bi-exponential decay of the aci-transient was observed by LFP in acetonitrile with the short-lived component absorbing at somewhat longer wavelengths. This suggests that both ZZ-2 and ZE-2 are formed in the primary photoreaction. The fast component, k = 2 × 10⁶ s−1, may be due to rate-limiting, solvent-assisted transformation of ZZ-2 to EZ-2, followed by rapid intramolecular proton transfer yielding the nitroso hydrate 3 (R = H). The slower decay, k = 4 × 10⁴ s−1, is attributed to the ZE-isomer of 2. Its isomerisation to the nitroso hydrate 3 requires proton transfer through the solvent.
Small amounts of water in acetonitrile largely suppress reaction via the nitroso hydrate 3 (R = H), as indicated consistently by TRIR (Fig. 6) and LFP. We believe that the anti-conformation of 1 is favoured by external hydrogen bonding and that excitation of anti-1 leads preferentially to ZE-2. Alternatively, disruption of the intramolecular H-bond in EZ-2 by water molecules may suppress the tautomerisation to 3.
In summary, both ZZ- and ZE-2 are formed as primary products in anhydrous acetonitrile and the intermediate 3 (path b) appears in two waves. In moist acetonitrile, however, the reaction proceeds predominantly by path a (ZE-2 → EE-2 → 5 → 6).
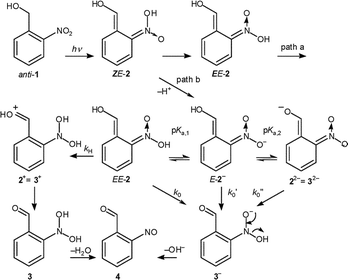 | ||
| Scheme 7 Proton transfer reactions leading from 2 to 4 (path b). | ||
The strong base 3− is expected to be very short-lived and to disappear either by rapid protonation to 3 by water or by elimination of hydroxyl ion yielding 4. Thus, ionization of the enol function, 2 → 3− + H+, would be seen as a decay of aci-absorption. In contrast, ionisation of 2− to 22− should leave the absorption at 420 nm largely unchanged.
The decay of transient 2 (R = H) at 420 nm was bi-exponential in the pH range of 3–10. The rate constant of the fast component, k1aci = 2 × 10⁷ s−1, was independent of pH in this range, but was accelerated by buffers. It may be due to deprotonation at the enol function, 2 → 3− + H+. Alternatively, cyclisation of 2 prior to ionisation (path a) could compete with ionization to 3−. Methyl substitution at the benzylic position was found to accelerate cyclisation in 2-nitrobenzyl ether.2 Indeed, the aci-decay of 2 (R = Me), k = 3.8 × 10⁹ s−1, is much faster than that of 2 (R = H). However, only reaction 2 → 3− + H+ accounts for the partial formation of a nitroso compound within 100 ns (step observed at 330 nm, Fig. 2) and for the increasing yield of this reaction (path b of Scheme 1) at higher pH values.
Nevertheless, the end product 4 is partly formed by the slow dehydration of 6 (path a of Scheme 1). This was established by TRIR spectroscopy with wholly aqueous (D2O) solutions. Reaction 6 → 4 is also readily observed by conventional UV-spectroscopy of an irradiated aqueous solution of 1 (R = H or Me) in the pH-range of 2–8. The spectral changes (absorbance increase at 230 nm, decay at 316 nm) are quite similar to those associated with the decay of the hemiacetal formed from 2-nitrobenzyl methyl ether (Fig. 6 of ref. 2), and the amplitudes indicate that this reaction, path a, contributes at least 75% to the overall conversion at pH ≈ 5. The rate constants for reaction 6 → 4 (R = H), kCO, are shown in Fig. 3. It should be noted that the equilibrium constant for carbonyl hydration Kh = [6]/[4] is expected24 to be on the order of 0.1 for R = H, but four orders of magnitude lower for R = Me.
We conclude that both pathways a and b contribute to the overall reaction in aqueous solution, path b being predominant at pH < 2 and pH > 10, path a in near-neutral solutions.
The pH–rate profile of the longer-lived aci-transient (k2aci in Fig. 3) exhibits five bent regions.25 Upward curvature is observed around pH 3, 6 and 9, indicating changes of the reaction mechanism. Downward curvatures at pH ≈ 4 and 11.0 suggest rapid ionisation pre-equilibria. The decay of the aci-transient is also accelerated by general acids and bases ( Table 1). The longer-lived aci-transient is attributed to the nitronate anion E-2−, which decays by reprotonation to EE-2 at pH values < 6. Hence the incipient saturation of acid catalysis at pH ≈ pKa,1(2) = 3.3. However, a second branch of acid catalysis accelerates the decay of EE-2 further at pH < 3. This is attributed to protonation of the nitronic acid yielding 2+. Deprotonation of 2+ at the carbonyl oxygen gives the nitroso hydrate 3. Protonation of 2 to 2+ becomes faster than cyclisation in strong aqueous acid, so that the amplitude of the slow dehydration of 6 (path a) decreases and is no longer observed at pH < 1.
In contrast to pH–rate profiles observed for the aci-transients formed from nitrobenzyl ethers,2 the decay of the anion 2− exhibits base catalysis at pH > 7, which saturates at pH = pKa,2 ≈ 11. This observation indicates deprotonation of E-2− by OH− at the enol site forming the dianion 22− = 32−. Base catalysis saturates when the equilibrium shifts to 22−. Deprotonation of E-2− is also indicated by a change in the absorption spectrum of the aci-transient, which becomes broader and shifts to λmax ≈ 475 nm at pH > 11. The flat portion in the pH profile of k2aci around pH 7 is attributed to proton transfer from the enol function of E-2− through water forming the anion 3−.
To analyse the pH profile of k2aci on the basis Scheme 7, we assume that the protonation equilibria between 2, 2−, and 22− = 32− are all established prior to the decay of the aci-transients. The pre-equilibrium assumption is unlikely to hold for the formation of cation 2+. Here, for simplicity, we assume that protonation of 2 is the rate-determining step. Based on these assumptions Scheme 7 leads to the pH-dependence of k2aci expressed by eqn. (1). The parameters obtained by nonlinear least-squares fitting of eqn. (1) to the data points are given in Table 3.
No transient absorption above 330 nm is left after the decay of the aci-nitro intermediates 2− (R = H), λmax ≈ 430 nm, that occurs on the microsecond time scale. However, the absorbance at 320 nm rises again on much longer time scales, indicating the presence of an ‘invisible’ intermediate formed from 2, which could be 5 or 3. Both intermediates are formed in aqueous solution. Indeed, the growth curves observed at 320 nm were not accurately mono-exponential at all pH values, but a reliable separation into two first-order processes was not possible. The kinetic traces were thus fitted by a single exponential and the rate constants so obtained were fitted by eqn. (2) (pH-range 1–9), allowing for both acid and base catalysis, as well as a pH-independent contribution. The apparent saturation of base-catalysis at pH > 11 is attributed not to a pre-equilibrium, but to the fact that the decay of 22− becomes rate-determining for the formation of 3− at high pH.
The pH-dependent rate constants of the 320 nm growth, kNO, are similar to those observed for ring-opening of the bicyclic intermediate formed from 2-nitrobenzyl methyl ether,2 which would correspond to the reaction 5 → 6 in the present case. However, dehydration of 3 (R = H) to the nitroso product 4 (R = H) is expected to exhibit similar behaviour. The nitroso hydrates 3 should exhibit little absorption above 300 nm. An absorption maximum of 278 nm, ε = 5.5 × 10³ M−1 cm−1 was reported for the hydrate of 3-nitrosophenol.26 Henglein et al. have determined acid-catalysed rates of dehydration for several arylnitroso hydrates by pulse radiolysis.27 From their data, the acid-catalysed branch for dehydration of 3 (R = H) may be predicted to exhibit a rate constant of about 1 × 10⁴ M−1 s−1. This agrees well with the rate constant of 6.3 × 10³ M−1 s−1 deduced from the pH-rate profile (Fig. 3, Table 3).
The cyclisation of 1 (R = Me) is fast, k ≈ 4 × 10⁹ s−1 (path a). However, part of the reaction still proceeds by path b, presumably by direct deprotonation of one of the aci-isomers at the enol function, 2 → 3− + H+. No aci-transient is observed on the ns time scale, but the kinetics of the slow reactions 3 → 4 and 5 → 6 → 4 are similar to those of 1 (R = H).
A reaction mechanism involving ‘proton shuffling’ and loss of hydroxyde to the solvent was suggested by Tsien et al.4 to explain the remarkably fast release of Ca2+ from the photosensitive ‘nitr-5’ chelator (1, R = aryl). These authors observed two waves of Ca2+ release from ‘nitr-5’, with rate constants of 3000 s−1 and 0.17 s−1 at pH 7.4, which are close to the rate constants observed here for reactions 3 → 4 and 6 → 4, respectively. Related mechanisms have been proposed for the photoreactions of 4-nitrobenzyl alcohol28 and 2-nitrobenzaldehydes.29
Conclusions
Aci-nitro intermediates 2 generated by irradiation of the 2-nitrobenzyl alcohols 1 (R = H or Me) have the option of a novel reaction path involving proton transfer from the enol to the aci-nitro function forming a nitroso hydrate intermediate 3 (Scheme 1, path b). This mechanism predominates in hexane, dry acetonitrile and in strongly acidic or basic aqueous solutions. The conventional mechanism via benzisoxazolidine 5 and carbonyl hydrate 6 (Scheme 1, path a) dominates in wet acetonitrile and in near-neutral aqueous solutions. The dehydration of intermediates 3 and 6 to the nitroso product 4 is orders of magnitude slower than the decay of the aci-form. LFP studies of the readily accessible 2-nitrobenzyl alcohols are a convenient method to study the dehydration kinetics of these intermediates, particularly the nitroso hydrates 6. Nitroso hydrates have, in general, received little attention to date.27,28Acknowledgements
This work is part of project No. 20-68087.02 of the Swiss National Science Foundation. We thank Professor N. Ernsting and his group, HU Berlin, for extensive support in the construction of the pump–probe detection system.References
- C. G. Bochet, Photolabile protecting groups and linkers, J. Chem. Soc., Perkin Trans. 1, 2002, 2002, 125–142 RSC; A. P. Pelliccioli and J. Wirz, Photoremovable protecting groups: reaction mechanisms and applications, Photochem. Photobiol. Sci., 2002, 1, 441–458 RSC.
- Y. V. Il'ichev, M. A. Schwörer and J. Wirz, Photochemical reaction mechanisms of 2-nitrobenzyl compounds: methyl ethers and caged ATP, J. Am. Chem. Soc., 2004, 126, 4581–4595 CrossRef CAS.
- E. Bamberger, Photochemische Bildungsweise des o-Nitrosobenzaldehyds, Ber., 1918, 51, 606–612 Search PubMed.
- S. R. Adams, J. P. Y. Kao, G. Grynkiewicz, A. Minta and R. Y. Tsien, Biologically useful chelators that release Ca2+ upon illumination, J. Am. Chem. Soc., 1988, 110, 3212–3220 CrossRef CAS.
- G. Gauglitz and S. Hubig, Photokinetische Grundlagen moderner chemischer Aktinometer, Z. Phys. Chem. (Munich), 1984, 139, 237–246 CAS; G. Gauglitz and S. Hubig, Chemical actinometry in the UV by azobenzene in concentrated solution: A convenient method, J. Photochem., 1985, 30, 121–125 CrossRef CAS; G. Persy and J. Wirz, Spectrophotometric actinometry with azobenzene, EPA Newslett., 1987, 29, 45–46 Search PubMed.
- S. A. Kovalenko, A. L. Dobryakov, J. Ruthmann and N. P. Ernsting, Femtosecond spectroscopy of condensed phases with chirped supercontinuum probing, Phys. Rev. A, 1999, 59, 2369–2384 CrossRef CAS.
- J. H. Kaplan, B. Forbush and J. F. Hoffman, Rapid photolytic release of adenosine 5′-triphosphate from a protected analogue: utilization by the Na:K pump of human red blood cell ghosts, Biochemistry, 1978, 17, 1929–1935 CrossRef CAS.
- M. J. Frisch, G. W. Trucks, H. B. Schlegel, G. E. Scuseria, M. A. Robb, J. R. Cheeseman, V. G. Zakrzewski, J. A. Montgomery, Jr., R. E. Stratmann, J. C. Burant, S. Dapprich, J. M. Millam, A. D. Daniels, K. N. Kudin, M. C. Strain, O. Farkas, J. Tomasi, V. Barone, M. Cossi, R. Cammi, B. Mennucci, C. Pomelli, C. Adamo, S. Clifford, J. Ochterski, G. A. Petersson, P. Y. Ayala, Q. Cui, K. Morokuma, P. Salvador, J. J. Dannenberg, D. K. Malick, A. D. Rabuck, K. Raghavachari, J. B. Foresman, J. Cioslowski, J. V. Ortiz, A. G. Baboul, B. B. Stefanov, G. Liu, A. Liashenko, P. Piskorz, I. Komaromi, R. Gomperts, R. L. Martin, D. J. Fox, T. Keith, M. A. Al-Laham, C. Y. Peng, A. Nanayakkara, M. Challacombe, P. M. W. Gill, B. G. Johnson, W. Chen, M. W. Wong, J. L. Andres, C. Gonzalez, M. Head-Gordon, E. S. Replogle and J. A. Pople, GAUSSIAN 98 (Revision A.11), Gaussian, Inc., Pittsburgh, PA, 2001 Search PubMed.
- A. P. Scott and L. Radom, Harmonic vibrational frequencies: an evaluation of Hartree–Fock, Møller–Plesset, quadratic configuration interaction, density functional theory, and semiempirical scale factors, Phys. Chem., 1996, 100, 16502–16513 Search PubMed.
- (a) Y. V. Il'ichev and J. Wirz, Rearrangements of nitrobenzyl compounds. 1. Potential energy surface of 2-nitrotoluene and its isomers explored with ab initio and density functional theory methods, J. Phys. Chem. A, 2000, 104, 7856–7870 CrossRef CAS; (b) Y. V. Il'ichev, Rearrangements of nitrobenzyl compounds. 2. Substituent effects on the reactions of the quinonoid intermediates, J. Phys. Chem. A, 2003, 107, 10159–10170 CrossRef CAS.
- M. Cossi, V. Barone, R. Cammi and J. Tomasi, Ab initio study of solvated molecules: a new implementation of the polarizable continuum model, Chem. Phys. Lett., 1996, 255, 327–335 CrossRef CAS.
- J. R. Pliego, Jr. and J. M. Riveros, Theoretical calculation of pKa using the cluster–continuum model, J. Phys. Chem., 2002, 106, 7434–7439 Search PubMed.
- M. Schwörer and J. Wirz, 2-Nitrotoluene: thermodynamic and kinetic parameters of the aci-tautomer, Helv. Chim. Acta, 2001, 84, 1441–1458 CrossRef CAS.
- M. E. Casida, C. Jamorski, K. C. Casida and D. R. Salahub, Molecular excitation energies to high-lying bound states from time-dependent density-functional response theory: Characterization and correction of the time-dependent local density approximation ionization threshold, J. Chem. Phys., 1998, 108, 4439–4449 CrossRef CAS.
- A. Barth, J. E. T. Corrie, M. J. Gradwell, Y. Maeda, W. Mäntele, T. Meier and D. R. Trentham, Time-resolved infrared spectroscopy of intermediates and products from photolysis of 1-(2-nitrophenyl)ethyl phosphates: reaction of the 2-nitrosoacetophenone byproduct with thiols, J. Am. Chem. Soc., 1997, 119, 4149–4159 CrossRef CAS.
- R. A. McClelland and M. Coe, Structure-reactivity effects in the hydration of benzaldehydes, J. Am. Chem. Soc., 1983, 105, 2718–2725 CrossRef CAS.
- The extinction coefficient of o-benzoquinone is ε390 = 2200 M−1 cm−1 ( S. Goldschmidt and F. Graef, Optische Untersuchungen an Chinonen und freien Radikalen, Ber., 1928, 61, 1858–1869 Search PubMed ); that of 2,2-dimethylisoindene is ε400 = 3060 M−1 cm−1 ( M. Allan, K. R. Asmis, S. El houar, E. Haselbach, M. Capponi, B. Urwyler and J. Wirz, Triplet energy of 2,2-dimethylisoindene from electron-energy-loss spectroscopy and photoinduced triplet energy transfer, Helv. Chim. Acta, 1994, 77, 1541–1548 Search PubMed ).
- Excitation of compounds 1 at 248 nm in aqueous base formed an additional, unidentified intermediate with absorption overlapping the aci-nitro transients 2. This complication was avoided by excitation with 308 nm pulses from the excimer laser operating on XeCl.
- R. G. Bates, Determination of pH. Theory and Practice, Wiley, New York, 1973 Search PubMed.
- Calculated frequencies are available as supplementary material.‡ The predicted band positions and intensities for the four isomers were too similar to warrant an identification of the observed geometrical isomer(s) of 2.
- A potential energy minimum was found for EZ-2, but the energy of the transition state was lower than that of EZ-2 after correcting for the zero-point energies.
- The rate of formation of the aci-transients may depend on the wavelength of excitation: A. Blanc and C. Bochet, Isotope effects in photochemistry. 1. o-Nitrobenzyl alcohol derivatives, J. Am. Chem. Soc., 2004, 126, 7174–7175 Search PubMed . Compound 1 (R = Me) was excited at 270 nm in this pump–probe experiment.
- If the excited-state proton transfer occurs adiabatically from triplet 1 yielding the triplet state of the aci-intermediate, then isomerization around the C
![[double bond, length as m-dash]](https://www.rsc.org/images/entities/char_e001.gif) N bond might occur: R. Haag, J. Wirz and P. J. Wagner, The photoenolization of 2-methylacetophenone and related compounds, Helv. Chim. Acta, 1977, 60, 2595–2607 Search PubMed . However, formation of the aci-transient within 1 ps suggests that the reaction proceeds from the excited singlet state of 1 to yield the ground state aci-intermediate 2 through a conical intersection.
N bond might occur: R. Haag, J. Wirz and P. J. Wagner, The photoenolization of 2-methylacetophenone and related compounds, Helv. Chim. Acta, 1977, 60, 2595–2607 Search PubMed . However, formation of the aci-transient within 1 ps suggests that the reaction proceeds from the excited singlet state of 1 to yield the ground state aci-intermediate 2 through a conical intersection. - P. Zuman, Additions of water, hydroxyde ion, alcohols and alkoxide ions to carbonyl and azomethine bonds, ARKIVOC, 2002, 85–140, Search PubMed http://www.arkat-usa.org/ark/journal/2002/General/2-540R/540R.asp.
- G. M. Loudon, Mechanistic interpretation of pH–rate profiles, J. Chem. Educ., 1991, 68, 973–984 CAS.
- W. Grünbein and A. Henglein, Pulsradiolytische Untersuchung zweibasischer Radikale der Reduktion von Nitrophenolen in wässriger Lösung, Ber. Bunsen-Ges., 1969, 73, 376–382.
- W. Grünbein, A. Fojtik and A. Henglein, Pulsradiolytische Untersuchung kurzlebiger Hydrate von aromatischen Nitrosoverbindungen, Monatsh. Chem., 1970, 101, 1243–1252.
- P. Wan and K. Yates, Photoredox chemistry of nitrobenzyl alcohols in aqueous solution. Acid and base catalysis reaction, Can. J. Chem., 1986, 64, 2076–2086 CAS.
- M. V. George and J. C. Scaiano, Photochemistry of o-nitrobenzaldehyde and related studies, J. Phys. Chem., 1980, 84, 492–495 CrossRef CAS.
Footnotes |
| † Dedicated to Professor Hiroshi Masuhara on the occasion of his 60th birthday. |
| ‡ Electronic supplementary information (ESI) available: Coordinates and energies of all optimised structures, original rate data and calculated frequencies. See http://www.rsc.org/suppdata/pp/b4/b409927c/ |
| § Present address: Wichita State University, Department of Chemistry, 317 McKinley Hall, 1845 Fairmount, Wichita, KS 67260-0051, USA. E-mail: Yuri.Ilitchev@wichita.edu. |
| ¶ Present address: Jagiellonian University, Krakow, Poland. |
| This journal is © The Royal Society of Chemistry and Owner Societies 2005 |

