Photophysical properties of a carbazolyl mesogen of 8PCzC as revealed by absorption, fluorescence, and transient absorption measurements†
Kentaro
Irie
a,
Shinjiro
Machida
a,
Tohru
Ikegami
a,
Nobuo
Tanaka
a,
Hiroshi
Miyasaka
b,
Yo
Shimizu
c and
Akira
Itaya
*a
aDepartment of Polymer Science and Engineering, Kyoto Institute of Technology, Matsugasaki, Sakyo-ku, Kyoto, 606-8585, Japan. E-mail: itaya@kit.ac.jp
bDepartment of Chemistry, Graduate School of Engineering Science, Osaka University, Toyonaka, Osaka, 560-8531, Japan
cMesophase Technology Research Group, Special Division of Human Life Technology, National Institute of Advanced Industrial Science and Technology, Midorigaoka 1-8-31, Ikeda, Osaka, 536-8577, Japan
First published on 18th October 2004
Abstract
Fluorescence spectra in three phases [crystalline, smectic A liquid crystal (SmA), and isotropic] of a mesogen including one carbazolyl (Cz) chromophore, 4′-n-octylphenyl carbazole-2-carboxylate (8PCzC), were measured at various temperatures and compared with fluorescence spectra in solvents with various dielectric constants. Further, for the first time, picosecond transient absorption spectroscopy was applied to elucidating photoinduced electron-transfer dynamics (charge separation, charge recombination, and hole transfer reactions) in the three phases of 8PCzC doped with a small amount of an electron acceptor. The fluorescence spectra showed clearly the presence of two crystalline phases, which was supported by DSC measurement. On the basis of a comparison of the fluorescence spectra and those in solution, the 8PCzC molecule in the first crystal structure was suggested to be in polar environment compared to that in the second one. The fluorescence yields of 8PCzC in both SmA and isotropic phases were remarkably small compared to that in crystalline one. This was ascribed to the formation of hydrogen bonds between 8PCzC molecules in both SmA and isotropic phases. As a first approximation, the picosecond transient absorption spectra in the three phases of 8PCzC doped with 2,4,7-trinitrofluorenone were analyzed by the simple model of one-dimensional hole migration. The rate constants obtained for the hole transfer from the cation state of Cz chromophore to neighboring Czs decreased in the order of SmA (≈109 s−1) > isotropic (≈108 s−1) > crystalline (≈107 s−1) phases, although these measurement temperatures were different.
Introduction
Liquid crystals (LCs) are important organic materials that have been extensively investigated due mainly to their electro-optical characteristics and their application to display devices. Recently, the photoconductive properties (electronic charge photo-generation and transport properties) of LCs have also received attention.1,2 That is, recent studies of columnar discotic LCs and smectic mesophase of calamitic LCs showed fast electronic transport. Such fast electronic transport is ascribed to the high degree of molecular organization in the case of columnar discotic LCs or to highly organized layers in the case of smectic structures.Fluorescence properties of mesogens have also been received considerable interest in connection with relationships between the photophysical properties, the phase transition, and molecular ordering in various mesophases. In particular, fluorescence properties of alkyl- and alkoxy-cyanobiphenyls (abbreviated as nCB and nOCB, respectively), which are widely known as representative mesogens, were examined well in solution as well as in bulk neat forms.3–5 In solution, their fluorescence properties in solvents with different polarity have been examined from the viewpoints of intramolecular charge transfer (CT) fluorescence.4 In bulk neat forms, fluorescence depending on the crystalline polymorphism of these mesogens has attracted attention in addition to a relationship between fluorescence properties and the phase transition.4,5
Poly(N-vinylcarbazole) (PVCz) is widely known as one of amorphous polymeric materials with highly photoconductive properties, and amorphous neat films of its dimeric model compounds show high photoconductivity as well.6,7 In addition to their photoconductive properties, the photophysical properties of these polymeric and dimeric compounds have been also investigated in their amorphous solid state, covering luminescence8 and transient absorption measurements.9–11 For example, a clear relation between photophysical properties of PVCz and its tacticity was found not only for solution but also for amorphous solid films.12 Furthermore, photoinduced electron transfer dynamics (charge separation, charge recombination, and hole transfer reactions) in PVCz and its related compounds has been elucidated by means of picosecond transient absorption spectroscopic measurement.11,13 On the basis of these results, it was demonstrated that rapid hole migration with a time constant of 0.2 ns to a few nanoseconds takes place in solution as well as in amorphous solid films. In this way, PVCz and its related polymeric and monomeric compounds are interesting materials for physicists, chemists, and material scientists.
Combining the recent studies of LCs covering charge photo-generation and transport processes and fluorescence properties with unique characteristics of carbazolyl compounds relating to photophysical and hole transport properties, mesogens including Cz chromophores are an interesting material class for material chemists.
In the present work, we synthesized a mesogen including one Cz chromophore, 4′-n-octylphenyl carbazole-2-carboxylate (8PCzC), which showed two crystalline (K1 and K2), smectic A (SmA), and isotropic (I) phases, and measured absorption and fluorescence spectra, FT-IR spectra, and picosecond transient absorption spectra of this mesogen. In the following, we will discuss photophysical properties including photo-induced electron transfer dynamics of this mesogen on the basis of these results.
Experimental
The present mesogen synthesized was identified by means of IR and NMR spectra. The bulk sample was sandwiched between two quartz plates with a polyimide spacer (25 or 7.5 µm thick) for optical measurements. The solution samples were contained in a 2 or 10 mm quartz cell and were deaerated with N2 bubbling before measurements. For FT-IR measurements of neat samples, two KBr disks were used without a spacer for obtaining appropriate absorbance.A polarized optical microscope (Olympus, BX50) equipped with an Intec STC200D hot stage was used to observe phase transitions and textures. A Seiko Instruments DSC220C differential scanning calorimeter was used to determine phase transition temperatures. Heating and cooling rates were 10 °C min−1. Visible and ultraviolet absorption spectra were measured with a Shimadzu MPS-2000 multipurpose spectrometer. Infrared absorption spectra were measured with a Perkin Elmer FT-IR system spectrum GX spectrometer. Steady-state fluorescence spectra were measured under a front-face excitation condition with a Hitachi F-4500 fluorescence spectrometer.
A microcomputer-controlled picosecond laser photolysis system with a custom-built repetitive mode-locked Nd3+:YAG laser was used for the transient absorption spectra measurements. The optical alignments were almost the same as those reported previously. 11 A second harmonic pulse at 532 nm with 15 ps fwhm and ca. 0.5 mJ output power was used to excite the samples. Monitoring white light was generated by focusing the fundamental light into a 10 cm D2O–H2O (3 ∶ 1) cell. Two sets of the multichannel photodetector combined with a polychromator were used for the detection of the monitoring light in the transient absorption spectroscopy. These details were described elsewhere.11
Results and discussion
Fig. 1 shows the chemical structure of the present mesogen (8PCzC), the DSC curves of 8PCzC, and the phase transition temperatures obtained from them. During the first heating process, three endothermic peaks are detected at 131, 162, and 215 °C. Since the transition at 131 °C was not confirmed under a polarizing microscope, the presence of two crystalline states (abbreviated as K1 and K2) is suggested. On the basis of the optical texture of the phase that appeared between 162 and 215 °C, the phase was judged to be smectic A (SmA) phase. The peak at 215°C is due to the transition from SmA to isotropic (I) phases. During the cooling process, two exothermic peaks are detected at 213 and 157 °C. The phase transition at 213 °C corresponds to the transition at 215 °C on the first heating run. Since the DSC trace observed during the second heating process was similar to that on the first heating run, the crystalline state observed at temperatures below 157 °C on the cooling run is attributed to the K1 state. That is, the crystalline state K2 in the high temperature region is not found during the cooling process. It was found, from the polarized microscopic observation, that the phase transition temperatures of the 8PCzC sample doped with 2,4,7-trinitrofluorenone (TNF, 3 mol%) are almost the same as those of the undoped sample.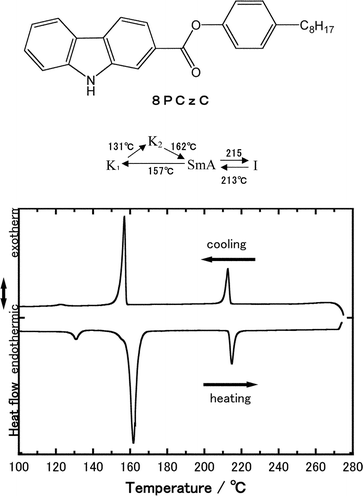 | ||
| Fig. 1 Chemical structure of 4′-n-octylphenyl carbazole-2-carboxylate (8PCzC), DCS curves of 8PCzC, and phase transition temperatures (°C) obtained by the curves. | ||
Absorption and fluorescence spectra in solution
Fig. 2 shows absorption and normalized fluorescence spectra of 8PCzC in n-heptane, benzene, tetrahydrofuran (THF), and acetonitrile solvents. Only a weak dependence of the absorption bands on solvent is found, whereas the fluorescence spectra depend markedly on solvent. As shown in Fig. 2(b), the vibrational structure of the monomer fluorescence of 8PCzC in non-polar n-heptane solvent disappears in polar solvents, and the fluorescence shifts to longer wavelengths with increasing solvent polarity. This suggests that the fluorescence is ascribed to an intramolecular CT excited state which is stabilized in polar solvents leading to a large Stokes shift. Similar phenomena are also reported for nOCB mesogens, which were investigated in detail.4,5 nOCB mesogens show clearly broad excimer fluorescence in a concentrated solution of non-polar solvent. Since solubility of 8PCzC in non-polar n-heptane was poor, the fluorescence spectrum of the saturated THF solution of 8PCzC (concentration: ca. 0.1 M) solutions was measured. However, the spectral shape of the THF solution was the same as that of 5 × 10⁻⁶ M one, suggesting that no excimer formation of 8PCzC is found in the concentrated THF solution.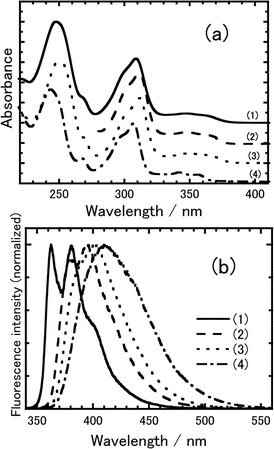 | ||
| Fig. 2 (a) Absorption and (b) normalized fluorescence spectra of 8PCzC (concentration: ca. 1 × 10⁻⁵ M) in (1) n-heptane (dielectric constant: 1.92), (2) benzene (2.28), (3) THF (4.58), and acetonitrile (37.5). Excitation wavelength: 330 nm. | ||
Fluorescence spectra of 8PCzC in its neat form as a function of temperature
Fig. 3 shows dependence of the fluorescence spectra of 8PCzC in its neat form on temperature. The insert in this figure shows the spectra in SmA and I phases. Before measuring the spectra of the neat sample, it was heated up to a temperature of the I phase and was cooled slowly to room temperature. The fluorescence spectra were measured through slow heating and cooling processes.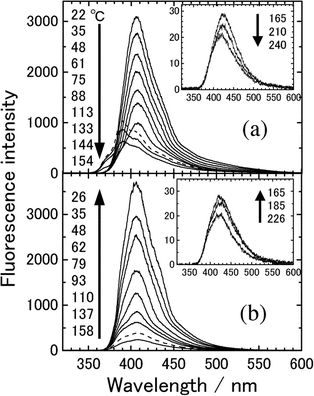 | ||
| Fig. 3 Temperature dependence of the fluorescence spectra of 8PCzC in its neat form. The insert shows the spectra in the SmA and isotropic (I) phases. Excitation wavelength: 330 nm. The ordinary scale of the insert is remarkably small. | ||
The fluorescence of the 8PCzC neat sample changes during the heating process [Fig. 3(a)]: firstly the fluorescence intensity decreases monotonically without a change of the spectral shape. At ca. 133 °C, an abrupt spectral change is observed: fluorescence with vibrational structure appears in the shorter wavelength region. After that, the fluorescence intensity decreases with an increase in temperature. Further, both a very large decrease in the fluorescence intensity (see the ordinate scale) and an abrupt spectral change to a structureless shape are observed at ca. 165 °C, and the intensity of the structureless fluorescence decreases with a slight blue shift with an increase in temperature [the insert in Fig. 3(a)]. Combining phase transition temperatures revealed from DSC measurements with these fluorescence spectral changes, we notice that the above two abrupt spectral changes correspond to the transition from K1 to K2 crystalline states and to the K2 → SmA phase transition, respectively, and that the SmA → I phase transition does not result in an abrupt change of the fluorescence.
Generally, the abrupt change in the fluorescence spectra of fluorescent mesogens in their neat form is attributed to their phase transitions.3,5 The present 8PCzC mesogen exhibits also the general behavior except for the SmA → I phase transition. In addition, the K1 → K2 transition in the crystalline phase induces also the abrupt fluorescence spectral change. That is, the one-to-one correspondence of the fluorescence spectra to the crystalline states is observed. Such a phenomenon was also reported for polymorphism of widely known fluorescent mesogen molecules such as 8OCB, 9OCB, 12OCB, and 4-n-pentyl-4′-cyano-p-terphenyl (5CT).5,14
A hysteresis behavior is observed for the slow cooling process (Fig. 3(b)): the fluorescence due to the K2 phase is not found during the cooling process. This also corresponds to the result of DSC measurements. For the second heating and cooling processes, the same fluorescence spectral behaviors as those for the above first ones were observed.
Fluorescence spectra are generally sensitive to environments surrounding the fluorescent molecules. Although both the crystal structures of 8PCzC and their molecular conformations are unknown and no difference between the K1 and K2 states was found for their IR spectra (vide infra), the fluorescence of the two crystalline phases of 8PCzC is certainly ascribed to monomer-like state. Here we notice that the fluorescence spectral shape observed for the K1 state is similar to that for THF solution, and that for the K2 state to that for n-heptane solution. This fact suggests that 8PCzC molecules in the K2-crystalline phase exist in the non-polar environment compared to that in the K1-crystalline one. Such a sensitive monomer-like fluorescence behavior to the environments was observed also for 8OCB, 12OCB, and 5CT.5,14 Such fluorescence properties seem to be a characteristic of the neat bulk form of these types of compounds capable of forming intramolecular CT excited states.
Since the crystal → LC phase transition of mesogens such as nCB and nOCB does not result in a very large decrement of the fluorescence intensity,3,5,14 we should discuss the reason why the fluorescence observed for SmA and I phases is remarkably weak compared to that for crystalline phase. It is known that fluorescence is often quenched when fluorescent molecules form hydrogen bonds with other molecules. We measured FT-IR spectra of 8PCzC in crystalline (K1 and K2), SmA, and I phases, together with a spectrum of 8PCzC molecules in benzene solution as references (Fig. 4). The bands around 3000–3100 cm−1 observed for the benzene solution are ascribed to benzene itself (Fig. 4(a)). The band ascribable to the N–H stretching vibration mode of the Cz chromophore of 8PCzC is observed at 3428 and 3416 cm−1 for the benzene solution and for the two crystalline phases (K1 and K2), respectively. For SmA and I phases, however, the band is broad and shows clearly a shoulder at 3370 cm−1 in addition to a peak at 3416 cm−1. The band around 1730 cm−1 is ascribed to the C![[double bond, length as m-dash]](https://www.rsc.org/images/entities/char_e001.gif) O stretching vibration mode of the ester group of 8PCzC (Fig. 4(b)). This band observed for the SmA (1721 cm−1) and I (1727 cm−1) phases is sharp and shifts to the low wavenumber compared to those for the benzene solution (1734 cm−1) and two crystalline phases (1730 cm−1). In general, the formation of hydrogen bonds results in the shift of these stretching vibration modes to the low wavenumber. In addition, the positions of these peaks are the same between the K1 and K2 phases, although the temperatures measured are markedly different (22 and 135 °C for K1 and K2 crystalline phases, respectively). Furthermore, the band positions of the stretching vibration mode are almost independent of whether 8PCzC molecules are in solid crystalline state or in solution. Hence, the above FT-IR spectra of 8PCzC strongly suggest the formation of the hydrogen bond between a C
O stretching vibration mode of the ester group of 8PCzC (Fig. 4(b)). This band observed for the SmA (1721 cm−1) and I (1727 cm−1) phases is sharp and shifts to the low wavenumber compared to those for the benzene solution (1734 cm−1) and two crystalline phases (1730 cm−1). In general, the formation of hydrogen bonds results in the shift of these stretching vibration modes to the low wavenumber. In addition, the positions of these peaks are the same between the K1 and K2 phases, although the temperatures measured are markedly different (22 and 135 °C for K1 and K2 crystalline phases, respectively). Furthermore, the band positions of the stretching vibration mode are almost independent of whether 8PCzC molecules are in solid crystalline state or in solution. Hence, the above FT-IR spectra of 8PCzC strongly suggest the formation of the hydrogen bond between a C![[double bond, length as m-dash]](https://www.rsc.org/images/entities/char_e001.gif) O group of one 8PCzC molecule and a N–H group of the Cz chromophore of its neighboring 8PCzC molecule in the SmA and I phases. Therefore, it is most likely that the very small fluorescence yield of 8PCzC observed for SmA and I phases is mainly caused by hydrogen bonds formed between neighboring 8PCzC molecules.
O group of one 8PCzC molecule and a N–H group of the Cz chromophore of its neighboring 8PCzC molecule in the SmA and I phases. Therefore, it is most likely that the very small fluorescence yield of 8PCzC observed for SmA and I phases is mainly caused by hydrogen bonds formed between neighboring 8PCzC molecules.
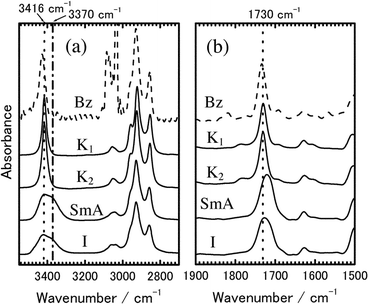 | ||
Fig. 4 Transmission IR spectra of 8PCzC. (a) N–H and (b) C![[double bond, length as m-dash]](https://www.rsc.org/images/entities/char_e001.gif) O stretching vibrations. K1, K2, SmA, and I phases were measured at 22, 135, 194, and 240 °C, respectively. The dotted line shows the spectrum of 8PCzC in benzene solution (1 × 10⁻³ M) for comparison. O stretching vibrations. K1, K2, SmA, and I phases were measured at 22, 135, 194, and 240 °C, respectively. The dotted line shows the spectrum of 8PCzC in benzene solution (1 × 10⁻³ M) for comparison. | ||
As aforementioned, exceptionally, no abrupt fluorescence spectral change was found for the SmA → I phase transition. This phenomenon is likely to be related with the fact that neighboring 8PCzC molecules in the SmA and I phases form similar hydrogen bonds.
The very weak fluorescence observed for the SmA and I phases is broad, and its peak position (ca. 420 nm) is close to that of the sandwich excimer fluorescence of PVCz.12 Hence, one of explanations for the fluorescence is that the fluorescence is attributed to sandwich excimer formed between neighboring 8PCzC molecules.
Photoinduced electron transfer processes of 8PCzC in K1, SmA, and I phases
As briefly described in the introduction section, photoinduced electron transfer processes of PVCz and its related compounds have been investigated by means of picosecond transient absorption measurements.11,13 As the results, charge separation, charge recombination, and hole (cation) transfer dynamics of aromatic vinylpolymers and their monomeric model compounds have been revealed in the solution phase as well as in the amorphous neat solid phase. For example, electron transfer dynamics in aromatic vinyl polymers in solutions were described by the simple scheme that the cationic state (hole) of pendant aromatic group continuously migrates along pendant chromophores in the polymer chain with charge recombination at the initial position of the charge separation (vide infra). In addition, it was demonstrated that rapid hole migration with a hole transfer rate constant of 5.6 × 10⁹ [for poly(5-vinylbenzo[b]carbazole)15]–1.3 × 10⁸ [for poly(2-vinylnaphthalene)16] s−1 takes place in solution and that the rate constant increases with an increase in the overlap between the neighboring two aromatic chromophores. Hence, it is of importance and of interest to investigate these processes in mesophase in comparison with those of the polymer system. Although a diffuse reflection transient absorption spectroscopic method has been used for microcrystalline powder samples that are not transparent,17 it is difficult to measure transient absorption spectra of opaque samples. We tried to measure transient absorption spectra in crystalline and LC phases using very thin sample films and an excitation of the wavelength with weak ground-state absorptions.As shown in Fig. 5, a doping of 2,4,7-trinitrofluorenone (TNF) to 8PCzC samples results in a new absorption band in the long wavelength. This band is due to ground-state charge transfer (CT) absorption of 8PCzC-TNF. These spectra in THF solution as well as in crystalline state consist of two bands, which are attributable to transitions HOMO1 → LUMO and HOMO2 → LUMO of a 1 ∶ 1 CT complex, where HOMO1 and HOMO2 are the first and second highest occupied molecular orbitals of the donor (8PCzC), respectively, and LUMO is the lowest unoccupied molecular orbital of the acceptor (TNF). This is safely assigned on the basis of both the results of the solution system reported for ground-state CT complexes of PVCz and its related compounds with various acceptor molecules18 and the results of the compositional analysis of PVCz films doped with TNF.19
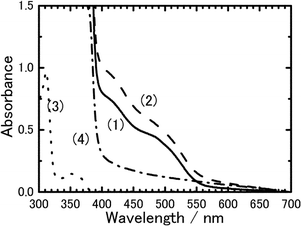 | ||
| Fig. 5 Charge-transfer absorption spectra of 8PCzC-TNF. (1) THF solution (8PCz concentration: ca. 1 × 10⁻² M and TNF concentration: ca. 1 × 10⁻² M) and (2) crystalline film (THF concentration: 3 mol%) at 23 °C. For references: (3) 8PCzC in THF solution and (4) 8PCzC neat crystalline film. | ||
Before discussing neat systems, we present photoinduced electron transfer processes of the 8PCzC-solution system as a reference. The time-resolved transient absorption spectra of 8PCzC-TNF in THF solution excited at 532 nm are shown in Fig. 6(a). The band around 540 nm can be safely assigned to the TNF anion and the band around 820 nm consists of bands of the THF anion and the Cz cation of 8PCzC on the basis of the transient absorption spectra reported for PVCz films doped with TNF.10 The time evolution of the spectra in Fig. 6(a) indicates that the excitation of the ground-state CT absorption bands causes the ion pair formation (charge separation, CS) in the excited state as is observed for other CT complexes in the condensed phase. The absorbance due to the ion pair decreases with an increase in the delay time (Fig. 6(a)). Since no absorption was observed at 400 ps following the excitation, almost all the deactivation of the ion pair was ascribed to the charge recombination (CR) processes. As shown in Fig. 6(b), the decay profile of the absorbance of the ion pair monitored at 560 nm is well described as a first-order kinetic decay with a rate constant of 2.3 × 10¹⁰ s−1. These CS and CR processes have been generally observed for the excitation of the ground-state CT complex and the ion pairs consequently produced, which phenomena have been interpreted well by the usual electron transfer theory.13
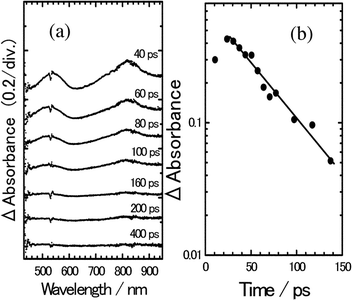 | ||
| Fig. 6 (a) Transient absorption spectra of 8PCzC-TNF in THF solution, excited with a picosecond 532 nm laser pulse. (b) Time profile of transient absorbance monitored at 560 nm. The solid line is a single exponential decay profile with a rate constant of 2.3 × 10¹⁰ s−1. | ||
Although the sandwich type cell with a thickness of ca. 7.5 µm was used for measuring transient absorption spectra of 8PCzC doped with TNF (3 mol%), a part of the excitation laser and monitoring lights were scattered. Consequently, we were not able to obtain transient absorption spectra with a good S/N ratio. Fig. 7(a) shows the transient absorption spectra of 8PCzC-TNF in the K1-crystalline state at 22 °C, excited with a picosecond 532 nm laser pulse. The absorption band with peaks around 560 and 850 nm can be assigned to the charge-separated state between Cz chromophore and TNF as aforementioned. The time profile of the charge-separated state monitored at 560 nm in Fig. 7(b) implies that the absorption signal appearing immediately after the excitation is followed by a fast decrease in the several hundreds of picoseconds time region and a much slower one in the nanoseconds region. Since the ion pair state in the THF solution system completely decayed in the sub-nanosecond time region (Fig. 6), the latter slow process is a behavior characteristic of bulk samples. For the generation of such a long-lived CS state, an increase in the interionic distance is indispensable. One notices that similar time profiles were observed for the picosecond laser excitation of weak CT complexes of aromatic vinyl polymers, such as a complex of PVCz with an electron acceptor, both in rather polar solutions and in the amorphous solid state,11,13 although the amount of the long-lived CS state in the latter solid state is rather large compared to that in the former solution. In both the solution and amorphous solid systems, the hole-migration process through pendant aromatic groups leading to the increase in the interionic distance resulted in the formation of the long-lived CS state. In addition, as aforementioned, the decay time profile of the CS state in the solution system was interpreted by the simple model as shown in Scheme 1: the cation radical (hole) continuously migrates along pendant aromatic groups in polymer chain with the charge recombination at the initial position of the charge separation. In almost all aromatic vinyl polymer systems, all of the hole transfer rate constants (kHTi) were set to be the same (kHT), and the rate constant of the charge recombination (kCR) taking place at the initial position of the charge separation was set to be equal to kCR of the monomer model system in the same solvent. In the present system, an amount of the long-lived CS state is rather small and its time profile [Fig. 7(b)] is close to those in the polymer-solution systems. As a first approximation, hence, we used the Scheme 1 for analyzing the present time profile. However, we do not have the value of kCR of the monomer system under similar experimental conditions. Thus, we varied both kHT and kCR. As shown in Fig. 7(b), the calculated curve with kHT = 3.0 × 10⁷ s−1 and kCR = 2.0 × 10⁹ s−1 reproduces the experimental results fairly well.
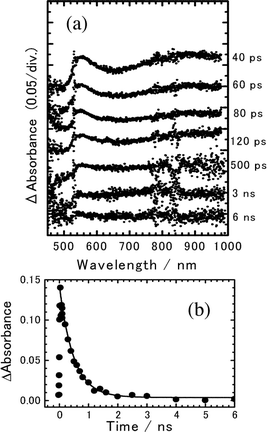 | ||
Fig. 7 (a) Transient absorption spectra of 8PCzC-TNF (3 mol%) in crystalline (K1) phase at 22 °C, excited with a picosecond 532 nm laser pulse. (b) Time profile of transient absorbance monitored at 560 nm. The solid line is the calculated curve on the basis of Scheme 1 with kHT![[thin space (1/6-em)]](https://www.rsc.org/images/entities/char_2009.gif) = =![[thin space (1/6-em)]](https://www.rsc.org/images/entities/char_2009.gif) 3.0 × 10⁷ s−1 and kCR 3.0 × 10⁷ s−1 and kCR![[thin space (1/6-em)]](https://www.rsc.org/images/entities/char_2009.gif) = =![[thin space (1/6-em)]](https://www.rsc.org/images/entities/char_2009.gif) 2.0 × 10⁹ s−1. 2.0 × 10⁹ s−1. | ||
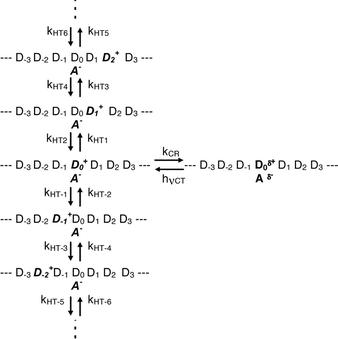 | ||
| Scheme 1 | ||
Fig. 8(a) exhibits the transient absorption spectra of 8PCzC-TNF (3 mol%) in SmA phase at 180 °C, excited with a picosecond 532 nm laser pulse, although the spectra are in rather poor S/N ratio. The absorption around 540 nm and the absorption in the longer wavelength region are assigned to the CS state between TNF and Cz of 8PCzC, as in Fig. 6(a) and 7(a). As performed for the above results of the crystalline phase, we analyzed the experimental results in such a manner that the time profiles all over measuring time region could be reproduced by the calculation on the basis of Scheme 1, varying both kHT and kCR. The solid line in Fig. 8(b) is the curve calculated with kHT = 1.1 × 10⁹ s−1 and kCR = 2.0 × 10¹⁰ s−1, which also reproduces the experimental results fairly well.
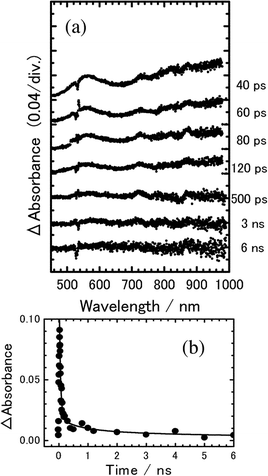 | ||
Fig. 8 (a) Transient absorption spectra of 8PCzC-TNF (3 mol%) in SmA phase at 180 °C, excited with a picosecond 532 nm laser pulse. (b) Time profile of transient absorbance monitored at 560 nm. The solid line is the calculated curve on the basis of Scheme 1 with kHT![[thin space (1/6-em)]](https://www.rsc.org/images/entities/char_2009.gif) = =![[thin space (1/6-em)]](https://www.rsc.org/images/entities/char_2009.gif) 1.1 × 10⁹ s−1 and kCR 1.1 × 10⁹ s−1 and kCR![[thin space (1/6-em)]](https://www.rsc.org/images/entities/char_2009.gif) = =![[thin space (1/6-em)]](https://www.rsc.org/images/entities/char_2009.gif) 2.0 × 10¹⁰ s−1. 2.0 × 10¹⁰ s−1. | ||
We measured the transient absorption spectra of 8PCzC-TNF (3 mol%) in isotropic phase at 225 °C and analyzed the spectral data using the same method as the above one. The spectra are shown in Fig. 9(a), where the S/N ratio is better than that in the SmA phase because of small scattering excitation laser and monitoring lights. As shown in Fig. 9(b), the results calculated with kHT = 1.5 × 10⁸ s−1 and kCR = 1.5 × 10¹⁰ s−1 reproduces also the experimental results fairly well. These rate constants are listed in Table 1.
| Phase (temperature/°C) | k CR/s−1 | k HT/s−1 |
|---|---|---|
| Crystal (K1) (22) | 2.0 × 10⁹ | 3.0 × 10⁷ |
| SmA (180) | 2.0 × 10¹⁰ | 1.1 × 10⁹ |
| Isotropic (225) | 1.5 × 10¹⁰ | 1.5 × 10⁸ |
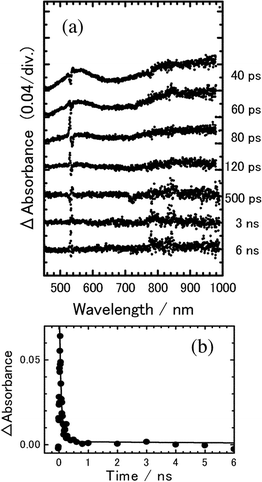 | ||
Fig. 9 (a) Transient absorption spectra of 8PCzC-TNF (3 mol%) in isotropic phase at 225 °C, excited with a picosecond 532 nm laser pulse. (b) Time profile of transient absorbance monitored at 560 nm. The solid line is the calculated curve on the basis of Scheme 1 with kHT![[thin space (1/6-em)]](https://www.rsc.org/images/entities/char_2009.gif) = =![[thin space (1/6-em)]](https://www.rsc.org/images/entities/char_2009.gif) 1.5 × 10⁸ s−1 and kCR 1.5 × 10⁸ s−1 and kCR![[thin space (1/6-em)]](https://www.rsc.org/images/entities/char_2009.gif) = =![[thin space (1/6-em)]](https://www.rsc.org/images/entities/char_2009.gif) 1.5 × 10¹⁰ s−1. 1.5 × 10¹⁰ s−1. | ||
Considering the low absorbance and the poor S/N ratio in the spectral data, which are resulted from the thin sample-film thickness, the scattering of the excitation laser and monitoring white lights, and the low absorbance of the present sample at the excitation wavelength, we will discuss only the order of the values of the hole transfer rate constants (kHT) and the charge recombination rate constants (kCR). The values of kCR in the SmA and I phases are larger than that in K1 phase. It was reported that kCR in PVCz films doped with p-chloranil (CA) decreases with decreasing temperature and kHT shows independence of temperature,20 although the temperature range is different from that in the present work. Hence, the large value of kCR in the SmA and I phases compared to that in K phase is most probably attributed to the difference in temperature.
The value of kHT in the present system increases in the following order: K1 (3.0 × 10⁷ s−1) < I (1.5 × 10⁸ s−1) < SmA (1.1 × 10⁹ s−1) phases. Since kHT in the PVCz–CA system is independent of temperature,20 molecular ordering rather than temperature should be considered to interpret the large difference in kHT. Molecular alignment disappears by the phase transition from SmA to I, although hydrogen bonds between 8PCzC molecules are formed in both of the phases. On the other hand, it is pointed out that an increase in the overlap between the neighboring two aromatic chromophores results in a large value of kHT.15 The special feature of the SmA phase is its multi-layered structure, and in each layer mesogens are arranged side by side, the thickness of a layer being approximately the length of the mesogen. This local molecular alignment in each layer results in a short distance between the Cz chromophores of neighboring 8PCzC molecules, even if the distance between Cz chromophores through a layer is long. Hence, molecular alignment in the organized layer of the SmA structure would be responsible for an increase in the overlap between the Cz chromophores of neighboring 8PCzC molecules. Consequently, the value of kHT in the SmA phase is larger than that in the I one. At the present stage, we have no information on the crystalline structure of 8PCzC, where the formation of hydrogen bonds is not suggested. The small value of kHT in the K1 phase compared to those in the other two phases is likely to be responsible for the large difference in measurement temperatures and/or the small overlap between the Cz chromophores of neighboring 8PCzC molecules in the K1 phase compared to that in the I phase.
It is difficult to compare directly the values of kHT obtained for the present system and those for the aromatic vinyl polymer ones in solution as well as in solid films, because the dielectric constants of these systems as well as measurement temperatures are different. In addition, one-dimensional hole transfer was assumed for the present system. However, anyway, we should note that the orders of kHT values in both of the systems are similar.
Conclusion
Absorption, fluorescence, and picosecond transient absorption spectra of the mesogen, 8PCzC, containing one Cz chromophore were investigated. The fluorescence spectra of 8PCzC in solution depended on the solvent polarity, which is ascribed to the intramolecular charge-transfer properties of the fluorescence. The crystalline phase of 8PCzC showed two types of the fluorescence spectra; one fluorescence was due to polar environment compared to another one. The presence of polymorphism of 8PCzC was confirmed by the DSC measurement. The fluorescence yields in both SmA and isotropic phases were remarkably small compared to that in the crystalline one. On the basis of the IR spectra depending on the phases, the small yield was suggested to be attributable to hydrogen bonds formed between 8PCzC molecules in both of the phases.As a first approximation, the time evolutions of the picosecond transient absorption spectra in the three phases of 8PCzC doped with TNF were analyzed by the simple scheme proposed for the interpretation of the electron-transfer dynamics in PVCz–electron acceptor systems. The rate constant obtained for the hole transfer from the cation state of Cz chromophore to neighboring Czs decreased in the order of SmA > isotropic > crystalline phases, although these measurement temperatures were different. The large value for the SmA phase is likely to be responsible for molecular alignment in the organized layer of SmA structure, resulting in an increase in the overlap between the Cz chromophores of neighboring 8PCzC molecules.
References
- (a) D. Adam, F. Closs, T. Frey, D. Funhoff, D. Haarer, P. Schuhmacher and K. Siemensmeyer, Transient photoconductivity in a discotic liquid crystal, Phys. Rev. Lett., 1993, 70, 457–460 CrossRef CAS; (b) D. Adam, P. Schuhmacher, J. Simmerer, L. Haussling, K. Siemensmeyer, K. H. Etzbach, H. Ringsdorf and D. Haarer, Fast photoconduction in the highly ordered columnar phase of a discotic liquid crystal, Nature (London), 1994, 371, 141–143 CrossRef CAS; (c) H. Monobe, S. Miwa, T. Suginond and Y. Shimizu, Mesomorphic and photoconductive properties of a mesogenic long-chain tetraphenylporphyrin nickel(II) complex, J. Mater. Chem., 2001, 11, 1383–1392 RSC and cited therein.
- (a) M. Funahashi and J. Hanna, Photoconductive behavior in smectic A phase of 2-(4′-heptyloxyphenyl)-6-dodecylthiobenzothiazole, Jpn. J. Appl. Phys., 1996, 35, L703–L705 CrossRef CAS; (b) M. Funahashi and J.-I Hanna, Fast hole transport in a new calamitic liquid crystal of 2-(4′-heptyloxyphenyl)-6-dodecylthiobenzothazole, Phys. Rev. Lett., 1997, 78, 2184–2187 CrossRef CAS; (c) I. Shiyanovskaya, K. D. Singer, R. J. Twieg, L. Sukhomlinova and V. Gettwert, Electronic transport in smectic liquid crystal, Phys. Rev. E, 2002, 65, 41715–41715 CrossRef CAS and cited therein.
- (a) R. Subramanian, L. K. Patterson and H. Levanon, Luminescence behavior as a probe for phase transitions and excimer formation in liquid crystals: dodecylcyanobiphenyl, Chem. Phys. Lett., 1982, 93, 578 CrossRef CAS; (b) N. Tamai, I. Yamazaki, H. Masuhara and N. Mataga, Picosecond time-resolved fluorescence spectra of a liquid crystal: fluorescence behavior related to phase transitions in cyanooctyloxybiphenyl, Chem. Phys. Lett., 1984, 104, 485–488 CrossRef CAS; (c) T. Ikeda, S. Kurihara and S. Tazuke, Excimer formation kinetics in liquid-crystalline alkylcyanobiphenyls, J. Phys. Chem., 1990, 94, 6550–6555 CrossRef CAS; (d) S. Kato, B. Lee and C. Pac, Fluorescence behavior of cyanobiphenyl liquid crystal molecules in liquid crystal/polymer composite films, Liq. Cryst., 1997, 22, 595–603 CrossRef.
- (a) C. David and D. Baryens-Volant, Absorption and fluorescence spectra of 4-cyanobiphenyl and 4′-alkyl- or 4′-alkoxy-substituted liquid crystalline derivatives, Mol. Cryst. Liq. Cryst., 1980, 59, 181–196 CAS; (b) M. Van Damme, J. Hofkens, F. C. De Schryver, T. G. Ryan, W. Rettig and A. Klock, Solvent dynamics and intramolecular charge transfer in 4-cyano-4′-butyloxybiphenyl (4OCB), Tetrahedron, 1989, 45, 4693–4706 CrossRef; (c) A. M. Klock, W. Rettig, J, Hofkens, M. van Damme and F. C. DeSchryver, J. Photochem. Photobiol. A: Chem., 1995, 85, 11 CrossRef CAS.
- A. Itaya, T. Imamura, M. Hamaguchi, Y. Tsuboi, H. Miyasaka, T. Asahi and H. Masuhara, Vacuum-deposited films of liquid crystal molecule of 4-dodecyloxy-4′-cyanobiphenyl: Their electronic spectra and molecular aggregate structures, Thin Solid Films, 1997, 311, 277–285 CrossRef CAS.
- E.g., J. M. Peason and M. StolkaPoly(N-vinylcarbazole), Gordon and Breach Science Publishers, New York, p. 1981 Search PubMed.
- A. Itaya, K. Okamoto and S. Kusabayashi, Hole transport in amorphous films of poly(N-vinylcarbazole), copolymers of N-vinylcarbazole with styrene, polystyrene molecularly-doped with N-isopropylcarbazole, and 1,3-di(N-carbazolyl)propane, Polymer J., 1985, 17, 557–565 Search PubMed.
- (a) W. Klopffer, Transfer of electronic excitation energy in polyvinyl carbazole, J. Chem. Phys., 1969, 50, 2337–2343 CrossRef; (b) A. Itaya, H. Sakai and H. Masuhara, Excimer dynamics of poly(N-vinylcarbazole) films revealed by time-correlated single photon counting measurements, Chem. Phys. Lett., 1987, 138, 231–236 CrossRef CAS; (c) A. Itaya, A. Egawa, Y. Umehara, H. Sakai and H. Masuhara, Fluorescence dynamics of charge-transfer complex films of poly(N-vinylcarbazole) and 1,2,4,5-tetracyanobenzene and its molecular aspects of disordered structure, Polymer, 1994, 35, 3149–3155 CrossRef CAS and cited therein.
- A. Itaya, T. Yamada and H. Masuhara, Laser photolysis study on photoinduced charge separation in poly(N-vinylcarbazole) thin films, Chem. Phys. Let., 1990, 174, 145–150 CrossRef CAS.
- T. Ueda, R. Fujisawa, H. Fukumura, A. Itaya and H. Masuhara, Electronic structure and dynamics of ionic species in thin poly(N-vinylcarbazole) films doped with some electron acceptors as revealed by transient absorption spectroscopy, J. Phys. Chem., 1995, 99, 3629–3635 CrossRef CAS and cited therein.
- (a) H. Miyasaka, T. Moriyama, S. Kotani, R. Muneyasu and A. Itaya, Picosecond dynamics of photoinduced electron transfer processes in poly(N-vinylcarbazole) solid film doped with electron acceptors as revealed by transient absorption spectroscopy and dichroism measurements, Chem. Phys. Lett., 1994, 225, 315–321 CrossRef CAS; (b) A. Itaya, T. Kitagawa, T. Moriyama, T. Matsushita and H. Miyasaka, Picosecond-microsecond dynamics of photoinduced electron-transfer processes in amorphous solid films of dimeric carbazolyl compounds doped with 1,2,4,5-tetracyanobenzene, J. Phys. Chem. B, 1997, 101, 524–530 CrossRef CAS.
- (a) A. Itaya, K. Okamoto and S. Kusabayashi, Emission spectra of the vinyl polymers with pendant carbazolyl groups, Bull. Chem. Soc. Jpn., 1976, 49, 2082–2088 CAS; (b) A. Itaya, K. Okamoto and S. Kusabayashi, Singlet excitation energy transfer in the vinyl polymers with pendant carbazolyl groups, Bull. Chem. Soc. Jpn., 1977, 50, 22–26 CAS.
- H. Miyasaka, S. R. Khan and A. Itaya, Solvent effect of the hole migration along poly(N-vinylcarbazole) chain as revealed by picosecond transient absorption and dichroism measurements, J. Phys. Chem. A, 2002, 106, 2192–2199 CrossRef CAS and cited therein.
- (a) A. Itaya, K. Watanabe, T. Imamura and H. Miyasaka, Vacuum-deposited films of liquid crystal molecules of cyanooctyloxybiphenyl: Electronic spectra of the films and structural transformation of the deposited films as revealed by in situ fluorescence measurements, Thin Solid Films, 1997, 292, 204–212 CrossRef CAS; (b) T. Imamura, K. Watanabe, Y. Tsuboi, H. Miyasaka and A. Itaya, Vacuum-deposited films of liquid crystal molecules of 4-n-alkoxy-4′-cyanobiphenyls: Their electronic spectra and molecular aggregate structures, Thin Solid Films, 1999, 338, 243–251 CrossRef CAS; (c) T. Sumiyoshi, I. Takahashi, Y. Tsuboi, H. Miyasaka, A. Itaya, T. Asahi and H. Masuhara, Vacuum-deposited films of mesogen of 4-n-pentyl-4″-cyano-p-terphenyl: their electronic spectra and molecular aggregate structures, Thin Solid Films, 2000, 370, 285–293 CrossRef CAS.
- H. Miyasaka, T. Moriyama and A. Itaya, Direct detection of the hole migration along the polymer chain by means of picosecond transient absorption and dichroism measurements: Poly(N-vinylbenzocarbazole systems in 1,2-dichloroethane solution, J. Phys. Chem. B, 1997, 101, 10726–10732 CrossRef CAS.
- T. Moriyama, K. Monobe, H. Miyasaka and A. Itaya, Direct detection of hole transfer processes along the polymer chain by means of picosecond transient absorption and dichroism measurements: poly(vinylnaphthalene) systems in 1,3-dichloroethane solution, Chem. Phys. Lett., 1997, 275, 291–297 CrossRef CAS.
- (a) E.g., R. W. Kessler and F. Wilkinson, Diffuse reflectance triplet–triplet absorption spectroscopy of aromatic hydrocarbons chemisorbed on γ-alumina, J. Chem. Soc., Faraday Trans. 1, 1981, 77, 309–320 Search PubMed; (b) S. Hashimoto, T. Mutoh, H. Fukumura and H. Masuhara, Diffuse reflectance laser photolytic studies of naphthalene, biphenyl and some aromatic hydrocarbons adsorbed in the cavities of faujastic zeolites, J. Chem. Soc., Faraday Trans., 1996, 92, 3653–3660 RSC and cited therein.
- K. Okamoto, M. Ozeki, A. Itaya, S. Kusabayashi and H. Mikawa, Charge-transfer complexes of vinyl polymers with large pendant π-electron systems. I. Poly(N-vinylcarbazole) and related compounds, Bull. Chem. Soc. Jpn., 1975, 48, 1362–1367 CAS.
- Q. Weiser, Densities of complexed and uncomplexed molecules in amorphous films of trinitrofluorenone and poly-N-vinylcarbazole, J. Appl. Phys., 1972, 43, 5028–5033 CrossRef.
- H. Miyasaka, T. Moriyama, T. Ide and A. Itaya, Picosecond dichroism measurements of photoconductive poly(N-vinylcarbazole) solid films: Temperature effect on the hole migration reaction, Chem. Phys. Lett., 1998, 292, 339–344 CrossRef CAS.
Footnote |
| † Dedicated to Professor Hiroshi Masuhara on the occasion of his 60th birthday. |
| This journal is © The Royal Society of Chemistry and Owner Societies 2005 |
