Detection of single base mismatches and abasic sites using phenanthridinium as an artificial DNA base and charge donor†
Linda
Valis
,
Nicole
Amann
and
Hans-Achim
Wagenknecht
*
Technical University Munich, Chemistry Department, Lichtenbergstr. 4, D-85747, Garching, Germany. E-mail: Wagenknecht@ch.tum.de; Fax: 49 89 289-13210; Tel: 49 89 289-13303
First published on 18th November 2004
Abstract
Combining the fluorescence properties of phenanthridinium as an artificial DNA base together with DNA-mediated charge transfer processes allows the homogeneous detection of DNA base mismatches and abasic sites.
Fluorescent probes that are sensitive to the local environment within DNA duplexes represent important tools for the detection of physiologically important DNA base mismatches or lesions.1 One important way to create such DNA assays is to replace DNA bases by suitable chromophores.2 The resulting artificial DNA bases are very sensitive to structural perturbations and allow the detection of single base mismatches by their fluorescence properties.3 Ethidium (E) has been widely used as a non-covalently bound chromophore in fluorescence assays with nucleic acids.4 Furthermore, E represents an important donor for photoinduced charge transfer processes (CT) in DNA.5–8 Based on the relative redox potentials, E in the photoexcited state is not able to oxidize DNA in order to initiate a CT process.9 Hence, 7-deazaguanine (Z) has to be provided as a suitable charge acceptor.9 It is known that Z quenches the E* emission in DNA10 as a result of a DNA-mediated CT.5–8
Recently, we described the synthesis and fluorescence properties of oligonucleotides bearing the phenanthridinium heterocycle of E as an artificial DNA base11,12 Herein, we want to describe our results using E and Z as a distinct donor–acceptor couple in order to detect DNA base mismatches and the abasic site as a major DNA lesion. By using CT processes in addition to the emission properties of E*, the detection of base mismatches does not rely solely on the small differences of the hybridization energies between matched and mismatched duplexes.
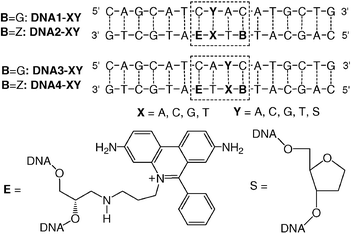
Using our recently published DNA building block for E-modified oligonucleotides,11,13 we prepared four arrays of modified DNA duplexes DNA1-XY-DNA4-XYvia automated phosphoramidite chemistry (Scheme 1). In DNA2-XY and DNA4-XY, the charge acceptor (Z) is placed three base pairs away from the photoexcitable charge donor (E). A cytosine (C) is placed opposite to E in the complementary strand. Our recent experiments using optical spectroscopy showed that the counterbase has only a very little influence on the intercalation properties of E.11DNA1-XY and DNA3-XY lack Z as the charge acceptor and hence provide the control for the assignment of CT effects. All melting temperatures were between 70 and 79 °C. The UV/Vis spectra of all synthesized DNA duplexes exhibit a typical absorption band with a maximum at ∼530 nm, which shows clearly that the phenanthridinium moiety is intercalated in the DNA base stack.12,14 In comparison, the absorption spectrum of “free” ethidium in aqueous solution has its maximum at ∼480 nm.15 Hence, the successful DNA duplex formation can be followed by changes in the absorption of the E chromophore.
 | ||
| Scheme 1 DNA duplex arrays DNA1-XY-DNA4-XY. | ||
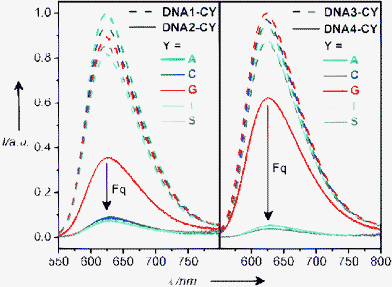
Our assay is based on the measurement of the fluorescence intensities of E-modified DNA bearing a base mismatch or abasic site (S) either one base pair away (DNA1-XY and DNA2-XY) or two base pairs away (DNA3-XY and DNA4-XY) from the E chromophore. First, we measured the steady-state fluorescence of the DNA control arrays DNA1-XY and DNA-3XY lacking Z as the charge acceptor, as representatively shown for DNA1-CY and DNA3-CY (Fig. 1, dashed lines). When excited at 530 nm, the corresponding emission spectra exhibit maxima at ∼628 nm, which is typical for intercalated ethidium.14 The emission of “free” ethidium in water has a maximum at ∼635 nm and is significantly quenched by protonation of the excited state.15 Accordingly, E-modified single-stranded oligonucleotides show a similar behaviour and nearly quantitative fluorescence quenching.12 Within experimental error, the five duplexes of the DNA sets DNA1-CY and DNA3-CY show a similar high fluorescence intensity. Obviously, the E chromophore exhibits no fluorescence sensitivity towards adjacent base mismatches, which would be expected especially in the case of DNA1-XY.
 | ||
| Fig. 1 Fluorescence spectra of DNA1-CY/DNA2-CY (left) and DNA3-AY/DNA4-CY (right) (12.5 µM), Na–Pi-buffer (10 mM), pH = 7, 25 °C, excitation at 530 nm. | ||
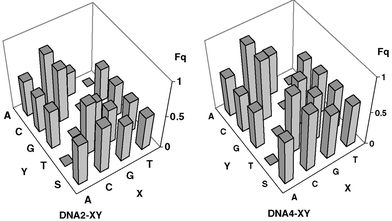
The emission of E* is significantly lower when Z is present in the duplex. The observed emission quenching in the matched duplexes of DNA2-XY and DNA4-XY (with XY = AT, CG, GC, or TA) can be attributed to the different CT efficiencies between E* and Z. Most remarkably, the emission spectra of the DNA duplexes bearing a base mismatch or abasic site (S) show an enhanced fluorescence quenching compared to the matched duplexes, as representatively shown for DNA2-CY and DNA4-CY (Fig. 1, solid lines). It is important to point out that the emission of E* is quenched most significantly only (i) when the charge acceptor Z is present and (ii) when a base mismatch or abasic site is located between the charge donor and acceptor. These characteristic emission properties can be observed within each set of the duplex arrays DNA2-XY and DNA4-XY. The value Fq quantifies the relative amount of fluorescence quenching of the mismatched duplexes compared to the corresponding matched duplexes (Table 1 and Fig. 2).
| Y = A | Y = C | Y = G | Y = T | Y = S | |
|---|---|---|---|---|---|
| a F q = 1 − I(mismatch)/I(match), where I = integrated fluorescence intensity. | |||||
| DNA2-AY | 0.53 | 0.54 | 0.58 | — | 0.64 |
| DNA2-CY | 0.78 | 0.78 | — | 0.77 | 0.71 |
| DNA2-GY | 0.35 | — | 0.38 | 0.53 | 0.56 |
| DNA2-TY | — | 0.50 | 0.49 | 0.48 | 0.51 |
| DNA4-AY | 0.58 | 0.56 | 0.57 | — | 0.67 |
| DNA4-CY | 0.89 | 0.89 | — | 0.88 | 0.88 |
| DNA4-GY | 0.60 | — | 0.68 | 0.69 | 0.68 |
| DNA4-TY | — | 0.59 | 0.61 | 0.62 | 0.64 |
 | ||
| Fig. 2 Graphical representation of the amount Fq within the DNA arrays DNA2-XY and DNA4-XY. | ||
With respect to the similar fluorescence intensities of the reference duplexes DNA1-XY and DNA3-XY, it is evident that the observed emission differences in the array DNA2-XY and DNA4-XY have to be attributed to different CT efficiencies. Hence, the differences can not be solely a result of structural pertubations such as partial vs. complete intercalation of the E chromophore. Interestingly, the assay works better if the base mismatches are located two base pairs away from the E chromophore (DNA4-XY) and not adjacent to E (DNA2-XY).
It is remarkable to note that in this DNA system, base mismatches do enhance the CT efficiency. In contrast, it is known from various studies that DNA mismatches or lesions usually interrupt the CT efficiency.16 Time-resolved studies showed that the covalently tethered and intercalated E needs time to reorientate to a conformation which is perfectly stacked for the CT process. It could be that in our DNA system, such reorientation is inhibited as a result of the incorporation of E as an artificial DNA base. In the presence of base mismatches the conformational flexibility could be regained. Surprisingly, the observed CT differences are bigger if the base mismatch is located two bases away rather than being directly adjacent. Hence, in addition to such structural considerations, the CT mechanism has to be taken into consideration. Since E* can not oxidize DNA, the CT follows the superexchange mechanism which depends on the DNA bridge between charge donor and acceptor and which is different in matched and mismatched duplexes.
In conclusion, it is evident that combining the fluorescence properties of E as an artificial DNA base together with DNA-mediated CT processes represents a new method for the homogeneous detection of DNA base mismatches and abasic sites. The method has the advantage that the changes of fluorescence are not limited to the directly adjacent bases and allow scanning a sequence of two base pairs. Experiments are on the way to scan whole codons (3 base pairs). Existing DNA arrays which are based on CT processes require the attachment of DNA duplexes as self-assembled monolayers on gold electrodes combined with electrochemical measurements as the readout.17 Our results could lead to new DNA microarrays which are based on CT processes and can be analyzed by commonly used fluorescence readout techniques.
Acknowledgements
We gratefully acknowledge financial support by the Deutsche Forschungsgemeinschaft, the Volkswagen-Stiftung, and the Fonds der Chemischen Industrie. Special thanks to Professor Horst Kessler, Technical University of Munich, for his generous support.References
- For reviews, see: (a) S. Tyagi, S. A. E. Marras and F. R. Kramer, Nat. Biotechnol., 2000, 18, 1191–1196 CrossRef CAS; (b) M. E. Hawkins, Cell Biochem. Biophys., 2001, 34, 257–281 Search PubMed; (c) M. K. Johansson and R. M. Cook, Chem. Eur. J., 2003, 9, 3466–3471 CrossRef CAS.
- C. Wojczewski, K. Stolze and J. W. Engels, Synlett, 1999, 1667–1678 CrossRef CAS.
- Recent examples: (a) Y. Saito, Y. Miyauchi, A. Okamoto and I. Saito, Chem. Commun., 2004, 1704–1705 RSC; (b) M. E. Hawkins and F. M. Balis, Nucleic Acids Res., 2004, 32, e63 CrossRef; (c) O. Köhler and O. Seitz, Chem. Commun., 2003, 2938–2939 RSC; (d) U. B. Christensen and E. B. Pedersen, Helv. Chim. Acta, 2003, 86, 2090–2097 CrossRef CAS; (e) H. Asanuma, H. Kahsida, X. Liang and M. Komiyama, Chem. Commun., 2003, 1536–1537 RSC; (f) K. Yoshimoto, C.-Y. Xu, S. Nishizawa, T. Haga, H. Satake and N. Teramae, Chem. Commun., 2003, 2960–2961 RSC; (g) M. M. Somoza, D. Andreatta, C. J. Murphy, R. S. Coleman and M. A. Berg, Nucleic Acids Res., 2004, 32, 2494–2507 CrossRef CAS.
- (a) A. R. Morgan, J. S. Lee, D. E. Pulleyblank, N. L. Murray and D. H. Evans, Nucleic Acids Res., 1979, 7, 547–569 CrossRef CAS; (b) A. R. Morgan, D. H. Evans, J. S. Lee and D. E. Pulleyblank, Nucleic Acids Res., 1979, 7, 571–594 CAS; (c) P. B. Dervan, Biorg. Med. Chem. Lett., 2001, 9, 2215–2235 CAS; (d) W. C. Tse and D. L. Boger, Acc. Chem. Res., 2004, 37, 61–69 CrossRef CAS.
- (a) A. M. Brun and A. J. Harriman, J. Am. Chem. Soc., 1992, 114, 3656–3660 CrossRef CAS; (b) S. J. Atherton and P. C. Beaumont, J. Phys. Chem., 1995, 99, 12025–12029 CrossRef CAS; (c) S. O. Kelley, R. E. Holmlin, E. D. A. Stemp and J. K. Barton, J. Am. Chem. Soc., 1997, 119, 9861–9870 CrossRef CAS; (d) D. B. Hall, S. O. Kelley and J. K. Barton, Biochemistry, 1998, 37, 15933–15940 CrossRef CAS; (e) A. I. Kononov, E. B. Moroshkina, N. V. Tkachenko and H. Lemmetyinen, J. Phys. Chem. B, 2001, 105, 535–541 CrossRef CAS; (f) P. T. Henderson, E. Boone and G. B. Schuster, Helv. Chim. Acta, 2002, 85, 135–151 CrossRef CAS.
- C. Wan, T. Fiebig, S. O. Kelley, C. R. Treadway, J. K. Barton and A. H. Zewail, Proc. Natl. Acad. Sci. USA, 1999, 96, 6014–6019 CrossRef CAS.
- (a) P. Fromherz and B. Rieger, J. Am. Chem. Soc., 1986, 108, 5361–5362 CrossRef; (b) S. J. Atherton and P. C. Beaumont, J. Phys. Chem., 1987, 91, 3993–3997 CrossRef CAS; (c) D. A. Dunn, V. H. Lin and I. E. Kochevar, Biochemistry, 1992, 31, 11620–11625 CrossRef CAS.
- S. O. Kelley and J. K. Barton, Chem. Biol., 1998, 5, 413–425 CrossRef.
- Hole transfer: E(Et*+/Et˙0) ∼ 1.2 V (see ref. 8); G has the lowest oxidation potential in DNA: E(dG˙+/dG) ∼ 1.3 V, see: S. Steenken and S. V. Jovanovic, J. Am. Chem. Soc., 1997, 119, 617–618 Search PubMed ; E(dZ˙+/dZ) ∼ 1.0 V (see ref. 8).
- J. J. P. Latimer and J. S. Lee, J. Biol. Chem., 1991, 266, 13849–13851 CAS.
- R. Huber, N. Amann, H.-A. Wagenknecht, J. Org. Chem., 69, 744–751 Search PubMed.
- N. Amann, R. Huber and H.-A. Wagenknecht, Angew. Chem., Int. Ed., 2004, 43, 1845–1847 CrossRef CAS.
- In contrast to ref. 11 and 12, the pure (S)-enantiomer of the phenanthridinium-DNA linker was used for the preparation of all oligonucleotides presented herein.
- (a) M. J. Waring, J. Mol. Biol., 1965, 13, 269–282 CrossRef CAS; (b) J.-B. LePecq and C. Paleotti, J. Mol. Biol., 1967, 27, 87–106 CrossRef CAS; (c) J. Olmsted and D. Kearns, Biochemistry, 1977, 16, 3647–3654 CrossRef.
- G. Cosa, K.-S. Foscaneanu, J. R. N. McLean, J. P. McNamee and J. C. Scaiano, Photochem. Photobiol., 2001, 73, 585–599 CAS.
- For examples, see: (a) B. Giese and S. Wessely, Angew. Chem., Int. Ed., 2000, 39, 3490–3491 CrossRef CAS; (b) S. R. Rajski, B. A. Jackson and J. K. Barton, Mutat. Res., 2000, 447, 49–72 CrossRef CAS; (c) B. Giese and S. Wessely, Chem. Commun., 2001, 2108–2109 RSC; (d) P. K. Bhattacharya and J. K. Barton, J. Am. Chem. Soc., 2001, 123, 8649–8656 CrossRef CAS.
- For a review, see: T. G. Drummond, M. G. Hill and J. K. Barton, Nat. Biotechnol., 2003, 21, 1192–1199 Search PubMed.
Footnote |
| † Electronic supplementary information (ESI) available: experimental information, MS data, melting temperatures and fluorescence spectra. See http://www.rsc.org/suppdata/ob/b4/b414672g/ |
| This journal is © The Royal Society of Chemistry 2005 |
