Synthesis, solid-state molecular structure and solution dynamics of new alkoxy stannylene-transition metal complexes†
Michael
Veith
*,
Markus
Ehses
and
Volker
Huch
Institute of Inorganic Chemistry, Saarland University, PO Box 15 11 50, 66041, Saarbrücken, Germany. E-mail: veith@mx.uni-saarland.de
First published on 14th December 2004
Abstract
Reactions of the dimeric alkoxy stannylene [Sn(OtBu)2]2 (1) with the THF-stabilised group 6 pentacarbonyl fragments [M(CO)5(THF)] (M = Cr, W) yield the trinuclear complexes [{(OC)5M}{η1-Sn2(OtBu)2(μ-OtBu)2}] [M = Cr (2a), W (2b)] and tetranuclear complexes [{(OC)5M}{(OC)5M′}{μ,η1:1-Sn2(OtBu)2(μ-OtBu)2}] [M = Cr, M′ = W (3a); M = M′ = Cr (3b), W (3c)]. The solid-state structures of 2a, 2b, 3a and 3b have been determined by X-ray crystallography: the tri- and tetranuclear complexes are isotypic and crystallise in the monoclinic space group P21/n and P21/m, respectively. The dimeric structure of the starting molecule is retained in the complexes. Steric and electronic effects in the metal complexes can be separately assigned by correlating systematic changes in the solid-state structures with solution NMR spectra of the complexes. In the 1H, 13C{1H} and 119Sn{1H} temperature-variable NMR spectra, strong drifts of the chemical shifts are observed. The 1H and 13C NMR spectra for the trinuclear complexes reveal two consecutive exchange mechanisms, which involve the bridging and terminal OtBu substituents. The free activation enthalpies could be determined by lineshape analysis for 2a (low-temperature process) and 2b (low- and high-temperature processes). The low-temperature exchange most probably occurs via an associative mechanism.
Introduction
The electronic and coordinative unsaturation (σ2λ2) of tin in stannylenes, the heavier congeners of carbenes, is compensated either through σ- or π-donation, steric encumbrance and/or extension of the coordination number by binding to a transition metal moiety.6 Stannylenes show an amphiphilic behaviour towards acids,7 bases,8–12 and oxidants13–18 that is attributed to the hybridisation of the electron-deficient tin centre, which is regarded as being intermediate between (sp2)4(pz)0 and s2(px,y)2(pz)0.19 Both descriptions take into account the presence of a lone pair of electrons and an empty p-orbital perpendicular to the plane formed by tin and the α-atoms of the two substituents.Concurrently to the syntheses of the first stable stannylenes in the late 1970’s, a number of remarkable papers appeared on the synthesis and characterisation of transition metal complexes with stannylenes as ligands by the groups of Marks,20 Jutzi,21 duMont22 and Lappert.23–25 Major reviews on structures and spectroscopic features of transition metal complexes with stannylene ligands have appeared in the late 80’s to early 90’s.26–28 Renewed interest in these types of complexes has grown as they can provide heterobimetallic complexes or clusters,29 stabilise stannylene complexes with low coordination number,29 be used in the synthesis of heteroleptic stannylenes30–32 and as single-source precursors.33,34
Several synthetic approaches to stannylene transition metal complexes have been applied,26,35 of which the most convenient is the replacement of a (labile) ligand by the stannylene.
The main structural types of stannylene complexes are sketched in Fig. 1: ψ-trigonal planar coordination geometry around tin (A) stabilised by electron-releasing or sterically demanding substituents on tin,24,30,31,36,37 ψ-tetrahedron (B) or ψ-pentagonal bipyramid (C).38–40 The mesomeric effect of lone pairs of electrons on the substituents (e.g., amides or alkoxides), dimerisation of the stannylene ligand {e.g., {[LnM]m[Sn(OtBu)(μ-OtBu)]2} [MLn = Ni(CO)3 (m = 1)41 Fe(CO)4 (4, m = 2)42} or intramolecular base addition43–45 may stabilise the Sn(II) environment.
 | ||
| Fig. 1 Commonly observed structural types of stannylene transition metal complexes. | ||
119Sn NMR solution spectra are sensitive probes for the chemical environment of tin nuclei in stannylenes. The absorption bands differ strongly in linewidth and chemical shift. For example, the dimeric di(tert-butoxy)stannylene 1, in solution at room temperature, shows a sharp resonance at −93 ppm41 whereas the monomeric cyclic planar stannylene {Sn[(N(tBu)]2Si(CH3)2]} exhibits a very broad resonance at +639 ppm.46 Heteronuclear temperature-variable NMR spectroscopy has only been scarcely used to investigate dynamic structural changes in alkoxy compounds,47–50 like for the neopentoxy stannylene [Sn(μ-ONep)2]∞.51 Transition metal organometallic complexes of stannylenes, to the best of our knowledge, have not been investigated for their dynamic behaviour so far.
In this paper, we provide a series of new tri- and tetranuclear group 6 carbonyl complexes with 1 as a ligand. We report their syntheses, solid-state molecular structures and spectroscopic characterisation in solution. Temperature-dependent heteronuclear NMR experiments are discussed in detail to propose a mechanism for the observed fluxionality in solution. Over the long run, we want to develop a synthetic protocol for the preparation of mixed group-6–tin compounds with adjustable stoichiometric ratios between their metal components as suitable single-source precursors for the preparation of new materials.
Experimental
General
The reactions were performed under inert nitrogen atmosphere in a Schlenk apparatus. The solvents (THF, hexane, benzene, toluene) were distilled from sodium and kept under nitrogen. [Sn(μ-OtBu)(OtBu)]2 (1) was prepared according to the literature procedure (yield 90%).2,3 [M(CO)6] (M = W, Cr) were purchased from Aldrich and used as received.The photolysis was performed for ca. 45 min (IR monitoring) in a Heraeus photoreactor with a 150 W mercury water-cooled lamp and quartz mantle. The solution IR spectra were recorded in KBr cuvettes on a BioRad FTS165. The NMR spectra were recorded on Bruker 200 NMR ACF and ACP spectrometers. High-resolution MS data were measured on a MAT-95 from Finnigan to confirm the elemental composition in the molecular peak. Analytical data were measured on a CHN-900 from LECO. Most samples (2a, 2b, 3b and 3c) repeatedly showed a considerably lower content of carbon and hydrogen than calculated. This may be due in part to carbide formation during the combustion and high sensitivity of the compounds. Lineshape analyses of the temperature-variable 1H NMR spectra were performed using the programmes MacNUTS (Acorn NMR Inc., spectra development) and DNMR.1
Syntheses
Crystallographic details‡
X-Ray crystallography was performed with a STOE IPDS diffractometer with Kα radiation (λ = 0.710 73 Å). Structures were solved by direct methods and refined by full-matrix least-square methods on F2 with SHELX-97.4 Hydrogen atoms were refined as rigid groups with the attached carbon atoms. Drawings were made with CrystalMaker.5Results and discussion
Syntheses of the compounds
The stannylene complexes 2a, 2b and 3a, 3b and 3c are synthesised (Fig. 2) according to the indirect photolysis approach introduced by Strohmeier.52 The trinuclear stannylene complexes 2a and 2b form instantly (IR monitoring) from the THF-stabilised group 6 pentacarbonyl fragment and 1. The tetranuclear stannylene complexes 3a, 3b and 3c are synthesised stepwise starting from the trinuclear complexes 2a or 2b, respectively. The homobis(transition metal) complexes 3b and 3c surprisingly are not accessible directly by adding 2 equiv. of the respective pentacarbonyl moiety. Instead, a variety of compounds are formed as is evidenced by IR and multinuclear NMR spectroscopy of the reaction mixtures. It is possible that by disproportionation of the pentacarbonyl moieties [W(CO)n] (n = 3, 4) species are formed that disrupt the integrity of 1, from which multinuclear complexes with different metal-to-metal ratios might result. Neither was it yet possible to deduce the chemical composition of these compounds nor could any product be isolated. | ||
| Fig. 2 Synthesis of the alkoxy stannylene complexes 2a, 2b and 3a, 3b, 3c. | ||
The trinuclear complexes 2a and 2b are isolated by crystallisation from hexane, whereas the tetranuclear complexes 3a, 3b and 3c are crystallised from the reaction solution by reducing the volume after adding toluene. The yields of the off-white powders or slightly yellow crystals are moderate. The solids are very well soluble in THF and well soluble in toluene and hexane (2a and 2b). The compounds are not volatile at reduced pressure (ca. 10−2 bar) up to 140 °C, which makes their use in CVD processes unsuitable.
Solid-state structure determinations
Crystals suitable for X-ray diffraction could be grown for all complexes. Due to a high anisotropic X-ray absorption, the structure of the tetranuclear complex 3c could not be solved satisfactorily. However, the heavy atom backbone agrees with that found for the tetranuclear stannylene derivatives 3a and 3b. The trinuclear and tetranuclear complexes, respectively, are isotypic and crystallise with 4 and 2 discrete molecules in the unit cell. Ball-and-stick representations of the molecular structures are given in Fig. 3; selected bond lengths and angles are given in Table 1.![Plot of the molecular structures of {[(OC)5M][η1-Sn(OtBu)(μ-OtBu)]2} [M = Cr (2a), W (2b)] and {[(OC)5M][(OC)5M′][μ,η1:1-Sn(OtBu)(μ-OtBu)]2} [M = Cr, M′
= W (3a); M = M′
= Cr (3b)].](/image/article/2005/NJ/b414662j/b414662j-f3.gif) | ||
| Fig. 3 Plot of the molecular structures of {[(OC)5M][η1-Sn(OtBu)(μ-OtBu)]2} [M = Cr (2a), W (2b)] and {[(OC)5M][(OC)5M′][μ,η1:1-Sn(OtBu)(μ-OtBu)]2} [M = Cr, M′ = W (3a); M = M′ = Cr (3b)]. | ||
| Parameter | 2a | 2b | 3a | 3b |
|---|---|---|---|---|
| a SnM designates the coordinated tin atom; SnnoM the uncoordinated Sn; *: trans and cis with respect to Sn; st: staggered, ec: eclipsed, see text). | ||||
| SnM–M | 2.575(2) st | 2.721(1) st | Cr: 2.61(2) st | 2.60(4) st |
| W: 2.740(1) ec | 2.62(3) ec | |||
| SnnoM–term-OtBu | 1.962(7) | 1.98(1) | — | — |
| SnM–term-OtBu | 1.953(7) | 1.96(1) | Cr: 1.924(8) | 1.964(4) |
| W: 1.983(8) | /1.963(4) | |||
| SnnoM–μ-OtBu | 2.162(6) | 2.13(1) | — | — |
| 2.165(6) | 2.15(1) | |||
| SnM–μ-OtBu | 2.079(6) | 2.08(1) | Cr: 2.115(5) | 2.106(5) |
| 2.071(6) | 2.09(1) | W: 2.105(5) | 2.11(1) | |
| trans-M–CO* | 1.83(1) | 1.90(2) | Cr: 1.87(1) | 1.86(3) |
| W: 2.01(2) | 1.89(1) | |||
| cis-M–CO* | 1.87(1)–1.89(1) | 1.97(2)–2.02(2) | Cr: 1.92(1)–1.94(1) | 1.89(2)–1.91(2) |
| W: 2.03(2)–2.06(2) | ||||
| Sn–(μ-OtBu)–Sn | 104.8(2) | 104.9(4) | 105.3(2) | 105.3(1) |
| 105.0(3) | 105.8(3) | |||
| (μ-OtBu)–SnM–(μ-OtBu) | 75.8(3) | 74.8(4) | Cr: 73.6 | 73.79(9) |
| W: 74.0(3) | ||||
| (μ-OtBu)–SnnoM-(μ-OtBu) | 72.2(2) | 72.6(4) | — | — |
| (term-OtBu)–(SnMO2) | 102.4(3) | 102.8(5) | 84.7(1) | 88.0(3) |
| 86.0(1) | 87.7(3) | |||
| (term-OtBu)–(SnnoMO2) | 91.1(3) | 88.3(5) | — | — |
| (term-OtBu)–(SnM)–M | 135.6(3) | 134.5(4) | Cr: 142.1(3) | 137.6(1) |
| W: 137.2(3) | 142.5(1) | |||
| (Sn1-μ-O2)–(Sn2-μ-O2) | 12.9(2) | 12.0(4) | 14.6(2) | 12.9(1) |
The solid-state structures of the complexes can be deduced from the stannylene 1, whose molecular structure has been determined both in the solid state3 and in the gas phase.53 Two stannylene moieties [Sn(OtBu)2] form a dimer via mutual tert-butoxy base addition. The terminal alkoxy groups are found in anti positions with respect to the perfectly planar central Sn2O2 ring (inversion centre). Differences in molecular parameters in the two physical states are found in the (μ-O)–Sn–(μ-O) angle and in the bond lengths from tin to the bridging and terminal alkoxide O atoms [gas phase/solid state: 76(2)°/73.2(2)°; 2.16(1)/2.128(4) Å; 1.97(2)/2.009(4) Å)]. The bridging oxygen atoms are in a trigonal planar environment with the sum of the bond angles being equal to 358.0°.
Only one solid-state structure of a transition metal complex with 1 as ligand has been reported so far: the diiron complex {[(OC)4Fe]2[Sn(μ-OtBu)(OtBu)]2} (4)42 with two tetracarbonyl transition metal fragments. The trinuclear Mo complex {[(OC)5Mo][Sn(μ-OtBu)(OSiPh3)]2} (5)54 with a heteroleptic stannylene ligand is closely related to the pentacarbonyl complexes 2a and 2b.
As found from our crystal structure analyses of 2a, 2b, 3a and 3b, the coordination of transition metal fragments to 1 does not change the main structural features, namely the dimeric structure with a central Sn2O2 ring and the anti arrangement of the terminal OtBu groups. This anti configuration is also found in other stannylenes3,55 and fixed in the calixarene “matrix” [(para-tBu-calix[4]arene)Sn2].56 However, in analogous germanium compounds3 the terminal substituents are arranged syn to each other with trigonal pyramidal bridging chalcogen atoms, resulting in a strong bending of the M2(μ-E)2 ring. For the complexes discussed herein, the spectral (2a, 2b; 3a, 3b, 3c) and crystallographic (2a, 2b; 3a, 3b) data do not give any hint for a second isomer in the syn conformation. The oxygen atoms of the bridging OtBu groups are found in a nearly ideal trigonal planar environment formed by one carbon and two tin atoms. The sums of the bond angles around oxygen vary from 357.4° to 360.0° (both found in 2b).
Due to the asymmetric coordination in the trinuclear complexes 2a and 2b, the tin atoms are found in two different coordination geometries: a Ψ-tetrahedron around Sn1 and a distorted trigonal pyramid around the transition-metal-free Sn2. Both trinuclear compounds 2a and 2b have no higher crystallographic point symmetry but are not far from Cs(m). The tetranuclear complexes 3a and 3b possess a crystallographic mirror plane, in which tin, transition metal atoms and some atoms of the terminal butoxy groups are placed. The molecular point group in the solid state is therefore Cs.
The distances Sn–Cr in 2a [2.575(2) Å] and Sn–W in 2b [2.721(3) Å] are found in the lower half of the range of respective metal–tin(II) bond lengths.28 A 2004 literature search in the CCDC database shows that the range in bond lengths in group 6 pentacarbonylstannylene complexes varies between 2.527–2.657 Å for neutral chromium--tin (17 complexes with at least one dative Sn→Cr bond) and 2.683–2.821 Å for tungsten–tin [13 complexes; for a discussion of the radius of Sn(II) see ref. 19]. The lowest values are found in polynuclear stannoxane cage molecules,57,58 whereas the longest bonds are found in monomeric bis-base adducts of stannylene complexes.59,60 Due to the same covalent radius of Mo and W, the value of the tungsten–tin bond length can be compared to the molybdenum–tin bond length in 5 [2.7449(6) Å]. It seems conceivable that the influence of the terminal group at the attached tin atom (OCR3/OSiR3) on the tin–transition-metal bond is small.
The addition of a second transition metal moiety slightly elongates the tin–transition-metal bonds. The mean Sn–Cr bond length in 3b [2.61(3) Å] equals that found in 3a [2.61(2) Å] and is 0.03 Å longer than found in 2a. The Sn–W bond in 3a is 0.02 Å longer than the respective bond in 2b.
Two opposite carbonyl ligands of the pentacarbonyl fragments in the trinuclear complexes adopt a “staggered” configuration with respect to the terminal tert-butoxy substituents at both tin atoms (see also the ESI). In the tetranuclear complexes, one of the two pentacarbonyl groups is found in the “staggered”, the second [M(CO)5] moiety in the “eclipsed” conformation. It cannot be excluded that crystal packing may have an impact on the sterically unfavourable conformation. It is evident that the steric repulsion in the “eclipsed” conformation causes a slight elongation of the bond length between Cr2 and Sn2 as well as between W1 and Sn1 compared to the “staggered” conformer (see Table 1).
The number of coordinated transition metal fragments and kind of [M(CO)5] rotamers also influences the bond angles around tin. Whereas the angle M–SnM–(terminal O) is invariant of the kind of transition metal it increases with addition of a second pentacarbonyl fragment (Table 1). This angle is smaller in the diiron compound 4 (135.0°), which can be attributed to the lower steric demands of the tetracarbonyl fragments. The angle between the Sn–transition-metal bond and the Sn2O2 plane is considerably widened at the “eclipsed” fragment (see Table 2). The determining factor for the size of this bond angle in the tetranuclear complexes seems therefore to be the transannular repulsion [CO–(term-OtBu)].
| Parameter/° | 2a | 2b | 3a | 3b |
|---|---|---|---|---|
| M–SnM–(term-OtBu) | Crst: 135.6(3) | Wst: 134.5(4) | Crst: 142.3(3) | Crst: 142.5(1) |
| Wec: 137.2(3) | Crec: 137.6(1) | |||
| M–SnM–(Sn2O2) | Crst: 121.7(2) | Wst: 122.2(3) | Crst: 121.8(2) | Crst: 122.0(1) |
| Wec: 142.7(1) | Crec: 142.5(1) |
The angle between the Sn–(term-OtBu) bond and the adjacent SnO2 plane clearly depends on the substitution pattern. In 1 (96.8°), the Sn–O bonds are bent away from the centre of the molecule. In the trinuclear complexes at the uncoordinated tin atom, it decreases to 91.1(3)°/88.3(4)° (2a/2b), whereas at the coordinated tin atoms, the OtBu groups are bent further away [102.4(3)°/102.8(4)°]. In the tetranuclear complexes, steric crowding forces the terminal substituents closer together, the respective angles decrease to 89.7(1)°/88.0(1)° (3a) and 88.0(3)°/87.7(3)° (3b).
Both (μ-O)–C(CH3) bonds are tilted against the Sn2O2 plane to the same side. In 1 and the tetranuclear complexes 3, due to the mirror plane, the two angles are equivalent. It is reduced from 20.1° in 1 to 5.9° (3b) and 6.3° (3c) in the tetranuclear complexes, which most probably comes from steric crowding on both sides of the central Sn2O2 plane. In the trinuclear complexes, the residues point away from the side occupied by the pentacarbonyl group. The angles are very different from each other (2a: 20.6/39.4°; 2b: 25.9/4.7°), reflecting a high flexibility of the tBu substituents in the search for the least amount of repulsion within the molecule.
The transition-metal–carbonyl C bonds, as expected, show strong a trans influence by the stannylene ligand: the trans metal–O bond is shorter than the cis ones (see Table 1). The overall mean transition-metal–carbonyl C bond length is reduced when one carbonyl is replaced by the stannylene ligand in the group 6 hexacarbonyls {[W(CO)6]: 2.048,61 2.026 Å;62 [Cr(CO)6]: 1.909,63 1.915–1.916 Å64–66}. This finding parallels that of the respective pentacarbonyl phosphine complexes67 and is in accord with a balanced σ–π interaction between the transition metal and the carbonyl ligand.68 However, the umbrella effect, which has been reported for several transition metal complexes with subvalent tin ligands,59 is not seen with the dimeric stannylene ligands discussed herein. The average values for the angles Sn–M–(cis-CO) are close to orthogonality [89.7(6)°–91.5(4)°].
Within the Sn2O2 ring, the mean oxygen–tin bond length is slightly reduced on coordination of transition metal fragments [1: 2.128 Å, 2a/2b: 2.119(7)/2.11(1) Å, 3b/3a: 2.108(5)/2.110(8) Å]. Addition of one transition metal fragment causes a significant deviation from the regular rhombic geometry found in 1. The bonds from the coordinated tin SnM to the bridging oxygen atoms are shortened while the bonds to the transition-metal-free tin atom are elongated (Table 1), which increases the bond angle (μ-O)–SnM–(μ-O) (1: 73.2°) and decreases the opposite angle at SnnoM. The endohedral bond angle (μ-O)–SnM–(μ-O) correlates with the SnM–(μ-O) bond length at the coordinated tin atom: the angle decreases with increasing distance. In a plot bond angle vs. bond length, two categories may be defined: trinuclear complexes with short bond/obtuse angle and tetranuclear complexes with long bond length/acute angle (see ESI). Due to the steric demand of the pentacarbonyl group, it becomes obvious that the shortening of the adjacent tin–oxygen bond must be due to electronic rather than steric effects. In a simple picture, the electron demand of the coordinating metal must have an influence on the adjacent bonds at tin. The same trend is observed on coordination of planar ring systems like cyclo-P3 ligands.69
The tin–oxygen bond lengths to the terminal butoxy groups are significantly reduced upon addition of pentacarbonyl groups, without correlation with the number or kind of transition metal [1: 2.009(4) Å]; in the trinuclear complexes those at the coordinated tin atom (SnM) are more reduced than the those at the transition-metal-free one (Table 1).
On coordination, the central Sn2O2 ring deviates from planarity. The dihedral angle between the SnO2 planes along the μ-O⋯μ-O vector is independent of the substitution pattern (2a: 12.9°; 2b: 12.0°; 3a: 14.6°; 3b: 12.9°) but stronger than the respective angles in 5 (7.2°) and 4 (0.0°, crystallographic inversion centre). One consequence of the bending of the Sn2O2 ring is the reduced distance between the tin atoms. While in the stannylene 1, 3.44 Å is found,3,53 all transition metal complexes have Sn⋯Sn distances of 3.35 Å.
An interesting structural analogue to the tetranuclear complexes is found in the bis-inidene complexes {[(OC)5M]2[Sn(μ-OEt)]}22− (M = Cr, W) characterised by Huttner et al.70 Two 7-electron terminal OR− residues in 3 are formally substituted by the isolobal 17-electron [M(CO)5]−. With respect to 3b, the bond angles in the planar four-membered ring at tin become more acute with a higher number of pentacarbonyl fragments [70.8(4)–72.8(1)°] and the Sn–Cr bond lengths are elongated [2.635(3)–2.654(2) Å], which might be due to steric repulsion and the higher electron density at Sn. The Cr–Sn–Cr angles are more acute [124.4(8)–125.22(8)°], in accord with the transannular repulsion argument (vide supra).
The observed changes in bond lengths and angles clearly show that, when transition metal fragments are added to [Sn(OtBu)2]2 (1), the hybridisation of the orbitals around tin is affected. In a simple picture, the lone pair s-orbital on complexation becomes involved in bonding and therefore the p3-bonding state of tin becomes more sp3. At the same time, electron withdrawal by the metal fragments induces shorter Sn–O bonds.
Spectroscopic features
 | ||
| Fig. 4 119Sn NMR spectrum of 2b at room temperature. Satellites are due to 117/119Sn (smaller constant) and 183W (low-field signal). | ||
Base coordination on stannylenes causes an upfield drift of the 119Sn resonances,72,73 whereas a deshielding for Lewis acids adducts like BF3 is observed.12 With transition-metal-complex fragments,26,72,73 the coordination deshielding (Δδcoord
=
δfree molecule
−
δligand) on the respective tin atom decreases going down the periodic table: in the series of the tri-/tetranuclear complexes it falls with the same magnitude from chromium (Δδcoord: 2a 220 ppm; 3b 201 ppm) to tungsten (Δδcoord: 2b 21 ppm; 3c 1 ppm). For the trinuclear complexes {[(OC)5Mo][Sn(μ-OtBu)(OSiPh3)]2}
(5)54 and {[(OC)3Ni][Sn(OtBu)2]2}
(6)41
Δδcoord
= 202 ppm and 244–255 ppm are calculated. The complexation of one tin atom in the trinuclear complexes as 2a and 2b also influences the second tin nucleus in the bis-stannylene, an effect that is known also from other coupling (element)2 units.74 However, the resonance for the free tin atom is less influenced [δ(119Sn)free tin : −108 (2a), −117 (2b) ppm]. The overall influence of the coordination on the magnetic resonance of the “Sn2 pair” is seen in the total coordination chemical shift difference Δ , which compares the average 119Sn chemical shift of the coordinated ligand with that of the free molecule [Sn2(OtBu)4]
(1). Δ increases with increasing difference in (number of coordinated chromium fragments) minus (number of coordinated tungsten fragments) in the order 2b
≈
3c < 3a < 2a < 3b [Δ (ppm) =
−1; 1; 83; 101; 202]. The heteroleptic molybdenum complex 5 shows an intermediate value of 82.5 ppm,54 the mononickel complex 6 around 250 ppm,41 the bis-adducts {[(OC)3Ni]2[Sn(OSiMe3)(μ-OSiMe3)]2} at 294.2 ppm41 and the bis-iron complex {[(OC)4Fe]2[Sn(OtBu)(μ-OtBu)]2} 128.4 ppm,42 which is surprisingly low in this context.
, which compares the average 119Sn chemical shift of the coordinated ligand with that of the free molecule [Sn2(OtBu)4]
(1). Δ increases with increasing difference in (number of coordinated chromium fragments) minus (number of coordinated tungsten fragments) in the order 2b
≈
3c < 3a < 2a < 3b [Δ (ppm) =
−1; 1; 83; 101; 202]. The heteroleptic molybdenum complex 5 shows an intermediate value of 82.5 ppm,54 the mononickel complex 6 around 250 ppm,41 the bis-adducts {[(OC)3Ni]2[Sn(OSiMe3)(μ-OSiMe3)]2} at 294.2 ppm41 and the bis-iron complex {[(OC)4Fe]2[Sn(OtBu)(μ-OtBu)]2} 128.4 ppm,42 which is surprisingly low in this context.
The tin-tungsten coupling constant increases with the number of added transition metal fragments. The observed coupling constants are in the range of previously reported direct 183W-119Sn coupling constants.26,73,75,76 Considerably smaller values are found for five-coordinate tin, chelating substituents (894–976 Hz)60,77 and half-sandwich complexes (610 Hz).78
The integrity of the Sn2O2 central cycle is clearly evidenced by the presence of 119Sn-119/117Sn coupling. For 3b, the ratio of the individual coupling constants 2J(119Sn-117/119Sn) of 1.050 agrees well with the theoretically expected value for the ratio of the gyromagnetic constants (1.046). 2J increases in the order 3c, 3a, 3b, 2b, 2a (137, 158, 170, 182, 208 Hz), which are above the values for stannylenes {[RR′Sn2(μ-OtBu)2], R = OSiMe3, R′ = N(SiMe3)2, OSiMe3 and R = R′ = OtBu (1): 72, 60 and 88 Hz79} and 5 (92 Hz).54 There is a clear linear correlation of J with the chemical shift ∂ of the coordinated tin atom according to the nature of the transition metal (see Fig. 5) with similar slope for both series [2.02 Hz ppm−1 (Cr), 1.93 Hz ppm−1 (W)]. The difference in coordination deshielding power of Cr and W can be calculated from the difference at Δδ (J = 0) = 186 ppm, which is similar to the 200 ppm calculated from individual shifts (vide supra). The trinuclear complexes are found to the left (see Fig. 5), the deshielding is more efficient than in the bis(transition metal) complexes. This dependence indicates that the coordination of the transition metal has an impact on the electronic communication between the tin atoms, which parallels our findings from the structural analysis (vide supra).
![Correlation of the vicinal 2JSn-Sn coupling constant with the 119Sn chemical shift of the coordinated tin atom in the complexes {[(OC)5M]n[(OC)5M′]m[Sn(OtBu)2]2] [n
= 1, m
= 0, M = Cr (2a), W (2b); n
=
m
= 1, M = M′
= Cr (3b), W (3c), M = Cr, M′
= W (3a)] according to the coordinating transition metal (chromium left, tungsten right).](/image/article/2005/NJ/b414662j/b414662j-f5.gif) | ||
| Fig. 5 Correlation of the vicinal 2JSn-Sn coupling constant with the 119Sn chemical shift of the coordinated tin atom in the complexes {[(OC)5M]n[(OC)5M′]m[Sn(OtBu)2]2] [n = 1, m = 0, M = Cr (2a), W (2b); n = m = 1, M = M′ = Cr (3b), W (3c), M = Cr, M′ = W (3a)] according to the coordinating transition metal (chromium left, tungsten right). | ||
Examination of the structural and spectroscopic data reveals that 2JSn-Sn (measure of the s character of the MOs) increases with increasing bond angle (measure for hybridisation around tin; see ESI). Relationships between the electronegativity of the substituents, coordination deshielding, chemical shift and coupling constant with structural parameters have been discussed only occasionally.72,80
The assignment of terminal and bridging OtBu substituents in the 13C spectra is not unambiguous since the chemical shift differences are small and integral ratios can only be taken with caution. However, based on significantly higher integral areas in the trinuclear and the heterobis(transition metal) complexes, the most deshielded signal in the quaternary carbon region and the most shielded signal in the methyl region are attributed to the bridging alkoxy groups. For the heteroleptic ligand in 5,54 the bridging OtBu groups give rise to singlets at 78.7 and 33.3 ppm (CDCl3), which is slightly above/below the respective values for the free stannylene 1 (75.5/33.6 ppm, toluene).81 For the homobis(transition metal) complexes 3b and 3c, the signals are therefore assigned in analogy. The singlets for the tert-butyl groups show satellites. Since these are present irrespective of the transition metal, they are ascribed to coupling tin nuclei.
Dynamic processes in stannylene molecules are well-known for dimeric alkoxy stannylenes {e.g., [Sn(OR)2]2 with R = Me, Et,82tBu,2 Nep51}. However, investigations on dynamic processes with stannylenes83,84 or germylenes85–87 as ligands in transition metal complexes are limited to rotations around the transition-metal–main-group-element bond. Therefore, a detailed heteronuclear (1H, 13C, 119Sn) temperature-variable NMR study has been performed on the complexes 2a, 2b and 3b. The exchange mechanism in 1, which up to now was not been examined in detail,2 will be discussed elsewhere.81
Heteronuclear temperature-variable solution NMR spectra have been obtained for {[(OC)5W][Sn(OtBu)2]2} [2b; 203–408 K (1H, 13C), 295–403 K (119Sn)] and {[(OC)5Cr]n[Sn(OtBu)2]2} [n = 1 (2a), 2 (3b); 203–408 K (1H, 13C)] in toluene (203 to 353 K) and xylene (r.t. to 403 K).
There are three well-separated regimes in the temperature-variable 1H NMR spectra (in the following the spectra for 2b are discussed in detail, see Fig. 6 and Table 3; those of 2a differ only in the absolute values). In the low-temperature range up to 263 K, no dynamic exchange is observed (invariable linewidth); the signal pattern corresponds to the X-ray molecular structure. The signals, which at 303 K (310 K for 2a) coalesce (integral ratio 1∶2, thus one terminal and the bridging OtBu), move towards each other, the third signal (terminal OtBu) moves in the same direction as the signal for the first terminal OtBu group. Between 263 and 353 K, the two signals at low- and high-field (integral ratio 1∶2) coalesce to form one singlet (relative integral 3). Above 373 K, this signal gets significantly broader, as does the signal with intensity 1 (second terminal OtBu group) above 333 K. This could lead to a second coalescence phenomenon at higher temperature. The 13C NMR spectra are analogous to the 1H NMR spectra. This behaviour can be explained by an exchange mechanism of all four OtBu groups at high temperature, while at intermediate temperature, only three substituents are exchanging on the NMR time scale.
 | ||
| Fig. 6 Temperature variable 1H NMR spectra of 2b in the range of (a) 213–343 K (d8-toluene); (b) 293–408 K (d10-xylene). | ||
| T/K | Coordinated Sn | Transition-metal-free Sn | |||||
|---|---|---|---|---|---|---|---|
| δ | 1 J W-Sn/Hz | 2 J Sn-Sn/Hz | Linewidth/Hz | δ | 2 J SnSn/Hz | Linewidth/Hz | |
| 295 | −64.7 | 1460 | 177 | 20 | −111.0 | 182 | 20 |
| 353 | −74.8 | 1503 | 184 | 28 | −116.7 | Broad | 89 |
| 403 | −84.7 | 1483 | 196 | 25 | −122.0 | 196 | 21 |
The tetranuclear complex 3b, on the other hand, over the whole temperature range shows two singlets (integral ratio 1∶1 in 1H NMR) for the two types of alkoxy groups found in the solid-state molecular structure. The stannylene complex is static in solution.
While in the 13C NMR of 2a, 2b and 3b for the tBu resonances there is a negligible drift of the chemical shifts, in the 1H NMR spectra all the signals show a pronounced drift of the chemical shift with temperature. Interestingly, this drift behaviour is very different for the different signals: while the two low-field resonances (integral ratio 1∶1, hence terminal OtBu) in the spectra of 2a and 2b move to high field with increasing temperature with a parabolic curvature, the high field signal (rel. integral 2, μ-OtBu) moves strictly linearly to low field (see ESI). While the chemical shift of the signals for the bridging OtBu substituents in both complexes are very similar (according to absolute values and slope), the low-field signal is more deshielded in the tungsten than in the chromium derivative, while with the intermediate signal, the situation is reversed. The former signal is ascribed to the OtBu substituent at the transition-metal-coordinated tin atom, which would be in agreement with the expected deshielding on coordination.
For the tetranuclear 3b, the high-field signal is basically unchanged over the temperature range studied (213 K: 1.42 ppm; 353 K: 1.44 ppm), while the low-field signal shows a linear increase of the chemical shift value with temperature (see ESI). The slope is similar to that of the singlet with integral ratio 2 in the trinuclear complexes [7.0 × 10⁻⁴ ppm K−1 (3b) vs. 6.9 × 10⁻⁴ (2a) and 7.5 × 10⁻⁴ ppm K−1 (2b)]. This makes the attribution to the bridging OtBu substituents very probable, although the relative δ values of the bridging and terminal OtBu groups would then be reversed with respect to the trinuclear and heterobis(transition metal) complexes (vide supra).
The most marked drift in the 13C{1H} NMR spectra of 2b is observed for the trans-CO resonance (trans with respect to tin): it is shielded linearly with increasing temperature [213 K: 200.1 ppm (toluene), 403 K: 197.8 ppm (xylene); see ESI]. A stronger shielding of the carbon nucleus may be induced by either higher electron density in bonding molecular orbitals (σ-donation from Sn) or depopulation of anti-bonding states (π-accepting Sn).
In the 119Sn{1H} NMR spectra of 2b several effects are evident with increasing temperature (Fig. 7): Both signals move to higher field, the linewidth of the free (uncoordinated) tin atom goes through a maximum, the tin-tin coupling constant increases and the tin-tungsten coupling constant slightly varies with temperature (± 3%), being highest with the largest linewidth of the signal for the free tin atom.
 | ||
| Fig. 7 119Sn{1H} NMR spectra of 2b at various temperatures in d10-xylene (x indicates impurities). | ||
The fit of the δ values gives a linear slope of 0.19 ppm K−1 for the coordinated and 0.10 ppm K−1 for the transition-metal-free tin atom to higher field, which is similar to 1 (slope 0.17 ppm K−1).81 A stronger but inverse temperature drift between 0.2 and 2.0 ppm K−1 was observed for base-stabilised and dimeric inidene-type stannylene complexes.59,70 The drift in the latter was interpreted in terms of an equilibrium between fourfold (predominant at low temperature) and threefold (high temperature) coordination around the tin atom.
A remarkable difference in the two 119Sn NMR signals is the dependency of the linewidth on temperature of only the signal for the transition-metal-free (three-coordinate) tin atom. Since the signal for the corresponding metal-coordinated tin atom is basically unchanged, this phenomenon is not due solely to dynamic exchange. The effect is not yet understood and will be studied elsewhere.81
The Sn-Sn coupling constant shows a steady increase with temperature. This might be accounted for by the higher electron density in s-AO-containing MOs, and thus stronger bonding between the two tin atoms at higher temperature. The dissociation of the stannylene ligand into monomeric species is highly improbable on that basis. Support is given by the observations that 2b in toluene or THF does not dismutate and that free 1 and 3c do not commutate in toluene at 90 °C after 2 days [eqn. (1)]:
 | (1) |
 | (2) |
The 1H NMR spectra of 2b (213–293 K in toluene, 293–408 K in xylene) and 2a (203–353 K in toluene) have been submitted to lineshape analysis1 to obtain information on the chemical shifts around the coalescence point(s) and especially to calculate the exchange rates for the OtBu groups. The latter are used to determine the thermodynamic parameters of the exchange mechanisms at low and high temperature, respectively.
Because two coalescence phenomena are clearly separated, two separate exchange mechanisms are simulated and the resulting absorption bands are fitted to the experimental signals by varying δ and exchange rate k. The low-temperature process has been simulated by a 4-nuclear spin, in which one spin is not exchanging with the other 3 mutually exchanging spins. According to the relative ppm values at low temperature, the spins are named a, b, c and d, with c = d (equivalent bridging OtBu), a being the exchanging terminal OtBu and b the OtBu that is not involved in the exchange at low temperature. The exchange rates kba (spins b and a), kbc and kbd therefore are equal to zero. The exchange rates kac, kad and kcd at a given temperature are equivalent but are non-zero. The inherent linewidth of each signal is constant and deduced from the linewidth at low temperature. At high temperature, the exchange rates with participation of spin b (kba, kbc, kbd) are equivalent but non-zero. Due to limitations in the programme, a satisfactory fit could only be obtained with the signal having relative intensity 1.
The function log(k/T) of the respective exchange rates kLT
(low-temperature process) and kHT
(high-temperature process) are plotted against the reciprocal temperature (Eyring plot) to obtain the activation enthalpy ΔH≠, activation entropy ΔS≠ and eventually the activation free energy of the process at room temperature ΔG≠298
=
ΔH≠![[thin space (1/6-em)]](https://www.rsc.org/images/entities/char_2009.gif) −TΔS≠
(Fig. 8). Thus, for the low-temperature exchange mechanism occurring for 2b, values of ΔH≠LT
= 95(3) kJ mol−1 and ΔS≠LT
=
+95(10) J mol−1 K−1 are calculated. For 2a, the respective values are similar: ΔH≠LT
= 91(3) kJ mol−1 and ΔS≠LT
=
+70(10) J mol−1 K−1. For the high-temperature process in 2b, values of ΔH≠HT
= 82(5) kJ mol−1 and ΔS≠HT
=
−30(8) J mol−1 K−1 are calculated. From the Gibbs–Helmholtz equation, ΔG≠298LT
= 70(6)
(2a), 67(6)
(2b) kJ mol−1 and ΔG≠298HT
= 91(7) kJ mol−1
(2b) are obtained.
−TΔS≠
(Fig. 8). Thus, for the low-temperature exchange mechanism occurring for 2b, values of ΔH≠LT
= 95(3) kJ mol−1 and ΔS≠LT
=
+95(10) J mol−1 K−1 are calculated. For 2a, the respective values are similar: ΔH≠LT
= 91(3) kJ mol−1 and ΔS≠LT
=
+70(10) J mol−1 K−1. For the high-temperature process in 2b, values of ΔH≠HT
= 82(5) kJ mol−1 and ΔS≠HT
=
−30(8) J mol−1 K−1 are calculated. From the Gibbs–Helmholtz equation, ΔG≠298LT
= 70(6)
(2a), 67(6)
(2b) kJ mol−1 and ΔG≠298HT
= 91(7) kJ mol−1
(2b) are obtained.
 | ||
| Fig. 8 Eyring plot for the 1H NMR values for the low-temperature exchange mechanism in 2b. | ||
Proposal for the alkoxide exchange in trinuclear complexes with [Sn(OtBu)2]2 (1) as ligand
The spectroscopic and structural data presented above contribute to an understanding of the exchange mechanism in the trinuclear complexes. The transition metal fragment does not take an active role in that process, which is seen from the very similar thermodynamic data for compounds 2a and 2b and similar spectra. The preservation of the transition-metal–tin bond over the whole temperature range is unambiguously proven by the presence of tungsten satellites at the 119Sn resonance for the coordinated tin atom and 117/119Sn in the CO region of the 13C NMR. The complexes do not dissociate in solution, at least not to a detectable amount. This is seen from the presence of Sn-Sn coupling over the whole temperature range and is also supported by the cross experiments [eqn. (1) and eqn. (2)]. The bonding situation in the transition state at the transition-metal-free tin atom very likely resembles that of the transition state in the free stannylene ligand (1), because of similar drift of the chemical shift and line broadening.81 However, under these assumptions, there do remain at least four possible pathways for the exchange mechanism at low temperature (Fig. 9).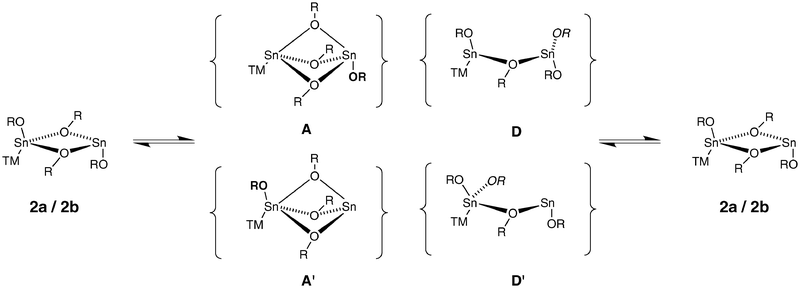 | ||
| Fig. 9 Possible associative (A, A′) and dissociative (D, D′) intermediates of the low-temperature OtBu exchange mechanism in 2a and 2b (TM = transition metal fragment; bold in A, A′ designates the static terminal OR, italic in D, D′ designates the moving μ-OR). | ||
In the associative pathway viaA, the terminal alkoxy substituent at the coordinated tin atom moves towards the uncoordinated tin atom, thus forming a fourfold coordination at both tin atoms. The inverse way, that is attack of the terminal OtBu residue on the uncoordinated tin atom onto the coordinated tin atom (A′) leads to a transition state in which the tin atoms have coordination numbers 3 and 5. However, because of steric crowding and coordinative saturation, the latter is less probable. The character of the exchanging OtBu groups in A and A′ would resemble the bridging substituents in the ground state. In the dissociative pathways, one bridging alkoxy substituent moves in a terminal position at the transition-metal-free (D) or the coordinated (D′) tin atom. In the transition state, three-coordinate (D) or four and two coordinate (D′) tin atoms would result. The character of the exchanging OtBu groups would be more like the terminal substituents in the ground state. Again, the pathway viaD′ is less likely.
The dissociative pathways are supported by the positive activation entropy and the observation that on heating, the bridging alkoxy substituents become more deshielded than the terminal ones; the proportion of terminal substituents in the equilibrium is increased.
However, there are also quite a number of observations supporting the associative pathways. The coupling constant 2JSnSn between the two tin atoms increases with temperature, as does the shielding of the CO resonances, which is conceivable with a stronger interaction. The 119Sn resonances of the metal-free tin atom especially is moving towards low field, which indicates a certain amount of a higher coordination number in the transition state. According to the assignment made above in the 1H NMR spectra, it is very likely that it is the terminal OtBu substituent at the coordinated tin atom that exchanges with the bridging positions. There is a potentially free coordination site at the transition-metal-free tin atom. The Lewis acidity of three-coordinate tin in dimeric structures has been observed, for example in 5,54 where a phenyl ring of a neighbouring OSiPh3 substituent is bond face-on the free stannylene coordination site. Three bridging alkoxy ligands are found in heteromultinuclear alkoxy compounds with tin(II).88,89
Based on these arguments, the associative pathway going through A seems the most probable one for the low-temperature exchange mechanism. However, we hope to gain more insight by combined spectroscopic and computational investigations of the parent free ligand 1.81
For the high temperature mechanism, less information is available. Dissociation of the dimeric stannylene is improbable (NMR, cross experiments), but the presence of four bridging OtBu groups seems very unfavourable. However, it is likely that the exchange of the last alkoxy group is occurring out of the transition state of the low-temperature process: one of the three bridging OtBu’s is exchanging with a terminal substituent at the metal-free Sn.
References
- H. J. Reich, Dynamic Nuclear Magnetic Resonance Spectroscopy with DNMR-Pro, University of Wisconsin, Madison, WI Search PubMed (http://www.chem.wisc.edu/areas/reich/plt/windnmr.htm).
- M. Veith and F. Töllner, J. Organomet. Chem., 1983, 246, 219 CrossRef CAS.
- M. Veith, P. Hobein and R. Roesler, Z. Naturforsch., B: Chem. Sci., 1989, 44, 1067 CAS.
- G. M. Sheldrick, SHELX-97, Program for refinement of crystal structures, University of Göttingen, Germany, 1997 Search PubMed.
- CrystalMaker, CrystalMaker Software, Ltd., Yarnton, UK (http://www.crystalmaker.com/) Search PubMed.
- A. Marquez and J. F. Sanz, J. Am. Chem. Soc., 1992, 114, 2903 CrossRef CAS.
- M. Veith, Comm. Inorg. Chem., 1985, 4, 179 Search PubMed.
- M. Veith, J. Organomet. Chem. Libr., 1981, 12, 319 Search PubMed.
- M. Veith, Nachr. Chem., Tech. Lab., 1982, 30, 940 CAS.
- M. Veith, Adv. Organomet. Chem., 1990, 31, 269 CAS.
- (a) M. Veith, Angew. Chem., 1987, 99, 1 CAS; (b) M. Veith, Angew. Chem., Int. Ed. Engl., 1987, 26, 1 CrossRef.
- C. C. Hsu and R. A. Geanangel, Inorg. Chem., 1980, 19, 110 CrossRef CAS.
- M. Veith, V. Huch, J. P. Majoral, G. Bertrand and G. Manuel, Tetrahedron Lett., 1983, 24, 4219 CrossRef CAS.
- M. Veith and A. Müller, J. Organomet. Chem., 1988, 342, 295 CrossRef CAS.
- M. Veith, M. Olbrich, S. Wang and V. Huch, J. Chem. Soc., Dalton Trans., 1996, 161 RSC.
- (a) A. Krebs, A. Jacobsen-Bauer, E. Haupt, M. Veith and V. Huch, Angew. Chem., 1989, 101, 640 CAS; (b) A. Krebs, A. Jacobsen-Bauer, E. Haupt, M. Veith and V. Huch, Angew. Chem., Int. Ed. Engl., 1989, 28, 603 CrossRef.
- M. Veith and O. Recktenwald, Z. Anorg. Allg. Chem., 1979, 459, 208 CrossRef CAS.
- M. Veith, M. Nötzel, L. Stahl and V. Huch, Z. Anorg. Allg. Chem., 1994, 620, 1264 CAS.
- J. A. Zubieta and J. J. Zuckerman, Prog. Inorg. Chem., 1978, 24, 251 CAS.
- T. J. Marks, J. Am. Chem. Soc., 1971, 93, 7090 CrossRef CAS.
- P. Jutzi and W. Steiner, Chem. Ber., 1976, 109, 3473 CAS.
- W. W. duMont and B. Neudert, Chem. Ber., 1978, 111, 2267 CAS.
- J. D. Cotton, P. J. Davison, D. E. Goldberg, M. F. Lappert and K. M. Thomas, J. Chem. Soc., Chem. Commun., 1974, 21, 893 RSC.
- J. D. Cotton, P. J. Davidson and M. F. Lappert, J. Chem. Soc., Dalton Trans., 1976, 2275 RSC.
- J. D. Cotton, P. J. Davidson, J. D. Donadlson, M. F. Lappert and J. Silver, J. Chem. Soc., Dalton Trans., 1976, 2286 RSC.
- W. Petz, Chem. Rev., 1986, 86, 1019 CrossRef CAS.
- M. F. Lappert and R. S. Rowe, Coord. Chem. Rev., 1990, 100, 267 CrossRef CAS.
- M. S. Holt, W. L. Wilson and J. H. Nelsen, Chem. Rev., 1989, 89, 11 CrossRef CAS.
- J. J. Schneider, J. Hagen, D. Spickermann, D. Bläser, R. Boese, F. F. d. Biani, F. Laschi and P. Zanello, Chem.-Eur. J., 2000, 6, 237 CrossRef CAS.
- M. Weidenbruch, A. Stilter, K. Peters and H. G. v. Schnering, Z. Anorg. Allg. Chem., 1996, 622, 534 CrossRef CAS.
- M. Weidenbruch, A. Stilter, K. Peters and H. G. v. Schnering, Chem. Ber., 1996, 129, 1565 CAS.
- A. Akkari, J. Byrne, J. I. Saur, G. Rima, H. Gornitzka and J. Barrau, J. Organomet. Chem., 2001, 622, 190 CrossRef CAS.
- M. Veith, in Metal Clusters in Chemistry, Molecular Metal Clusters, eds. P. Braunstein, L. A. Oro and P. R. Raithby, Wiley–VCH Weinheim, New York, 1999, vol. 1, pp. 73–90 Search PubMed.
- M. Veith, C. Mathur and V. Huch, Phosphorus, Sulfur Silicon Relat. Elem., 1997, 124–125, 489.
- M. Veith and O. Recktenwald, Top. Curr. Chem., 1982, 104, 1 CAS.
- M. Veith, H. Lange, K. Bräuer and R. Bachmann, J. Organomet. Chem., 1981, 216, 377 CrossRef CAS.
- M. Weidenbruch, A. Stilter, J. Schlaefke, K. Peters and H. G. v. Schnering, J. Organomet. Chem., 1995, 501, 67 CrossRef CAS.
- M. D. Brice and F. A. Cotton, J. Am. Chem. Soc., 1973, 95, 4529 CrossRef CAS.
- W. Petz, J. Organomet. Chem., 1979, 165, 199 CrossRef CAS.
- A. L. Balch and D. E. Oram, Organometallics, 1988, 7, 155 CrossRef CAS.
- M. Grenz and W. W. duMont, J. Organomet. Chem., 1983, 241, C5 CrossRef CAS.
- P. Braunstein, M. Veith, J. Blin and V. Huch, Organometallics, 2001, 20, 627 CrossRef CAS.
- A. Tzschach, K. Jurkschat, M. Scheer, J. Meunier-Piret and M. v. Meersche, J. Organomet. Chem., 1983, 259, 165 CrossRef CAS.
- K. Jurkschat, A. Tzschach, M. Scheer, J. Meunier-Piret and M. v. Meersche, J. Organomet. Chem., 1988, 349, 143 CrossRef CAS.
- H. P. Abicht, K. Jurkschat, A. Tzschach, K. Peters, E. M. Peters and H. G. v. Schnering, J. Organomet. Chem., 1987, 326, 357 CrossRef CAS.
- C. Stader, B. Wrackmeyer and D. Schlosser, Z. Naturforsch., B: Chem. Sci., 1988, 43, 707 CAS.
- I. Mijatovic, G. Kickelbick, M. Puchberger and U. Schubert, New J. Chem., 2003, 27, 3 RSC.
- J. A. Meese-Marktscheffel, R. E. Cramer and J. W. Gilje, Polyhedron, 1994, 13, 1045 CrossRef CAS.
- W. Clegg, R. J. Errington, P. Kraxner and C. Redshaw, J. Chem. Soc., Dalton Trans., 1992, 1431 RSC.
- G. A. Sigel, R. A. Bartlett, D. Decker, M. M. Olmstead and P. P. Power, Inorg. Chem., 1987, 26, 1773 CrossRef CAS.
- T. J. Boyle, T. M. Alam, M. A. Rodriguez and C. A. Zechmann, Inorg. Chem., 2002, 41, 2574 CrossRef CAS.
- (a) W. Strohmeier, Angew. Chem., 1964, 76, 873 CAS; (b) W. Strohmeier, Angew. Chem., Int. Ed. Engl., 1964, 3, 730 CrossRef.
- T. Fjeldberg, P. B. Hitchock, M. F. Lappert, S. J. Smith and A. J. Thorne, J. Chem. Soc., Chem. Commun., 1985, 14, 939 RSC.
- M. Veith, C. Mathur and V. Huch, J. Chem. Soc., Dalton Trans., 1997, 6, 995 RSC.
- M. J. McGeary, K. Folting and K. G. Caulton, Inorg. Chem., 1989, 28, 4051 CrossRef CAS.
- B. G. McBurnett and A. H. Cowley, Chem. Commun., 1999, 17 RSC.
- B. Schiemenz, B. Antelmann, G. Huttner and L. Zsolnai, Z. Anorg. Allg. Chem., 1994, 620, 1760 CrossRef CAS.
- (a) P. Kircher, G. Huttner, L. Zsolnai and A. Driess, Angew. Chem., 1998, 110, 1756 CrossRef; (b) P. Kircher, G. Huttner, L. Zsolnai and A. Driess, Angew. Chem. Int. Ed., 1998, 37, 1666 CrossRef CAS.
- P. Kircher, G. Huttner, K. Heinze, B. Schiemenz, L. Zsolnai, M. Büchner and A. Driess, Eur. J. Inorg. Chem., 1998, 703 CrossRef CAS.
- J. T. B. H. Jastrzebski, P. A. van der Schaaf, J. Boersma, G. v. Koten, D. Heijdenrijk, K. Goubitz and D. J. A. De Ridder, J. Organomet. Chem., 1989, 367, 55 CrossRef CAS.
- F.-W. Grevels, J. Jacke, W. E. Klotzbucher, F. Mark, V. Skibbe, K. Schaffner, K. Angermund, C. Kruger, C. W. Lehmann and S. Ozkar, Organometallics, 1999, 18, 3278 CrossRef CAS.
- F. Heinemann, H. Schmidt, K. Peters and D. Thiery, Z. Kristallogr., 1992, 198, 123 CAS.
- A. Whitaker and J. W. Jeffery, Acta Crystallogr., 1967, B23, 977 CrossRef CAS.
- M. Landman, H. Gorls and S. Lotz, Eur. J. Inorg. Chem., 2001, 233 CrossRef CAS.
- A. Jost, B. Rees and W. B. Yelon, Acta Crystallogr., 1975, B31, 2649 CAS.
- B. Rees and A. Mitschler, J. Am. Chem. Soc., 1976, 98, 7918 CrossRef CAS.
- J. E. Huheey, E. A. Keiter and R. L. Keiter, Inorganic Chemistry: Principles of Structure and Reactivity, Longman, 4th edn. 1993, p. 428 Search PubMed.
- R. K. Hocking and T. W. Hambley, Chem. Commun., 2003, 1516 RSC.
- M. DiVaira, M. P. Ehses, P. Stoppioni and M. Peruzzini, Inorg. Chem., 2000, 39, 2199 CrossRef CAS.
- P. Kircher, G. Huttner, K. Heinze and L. Zsolnai, Eur. J. Inorg. Chem., 1998, 1057 CrossRef CAS.
- J. G. Verkade, Coord. Chem. Rev., 1972, 9, 1 CrossRef CAS.
- Multinuclear NMR, ed. J. Mason, Plenum Press, New York, 1987, p. 75 Search PubMed.
- W. W. duMont and H. J. Kroth, Z. Naturforsch., B: Anorg. Chem. Org. Chem., 1980, 35, 700.
- (a) O. J. Scherer, M. Ehses and G. Wolmershäuser, Angew. Chem., 1998, 110, 530 CrossRef; (b) O. J. Scherer, M. Ehses and G. Wolmershäuser, Angew. Chem., Int. Ed. Engl., 1998, 37, 507 CrossRef CAS.
- D. Agustin, G. Rima, H. Gornitzka and J. Barrau, Eur. J. Inorg. Chem., 2000, 693 CrossRef CAS.
- M. Mehring, C. Löw, M. Schürmann, F. Uhlig, K. Jurkschat and B. Mahieu, Organometallics, 2000, 19, 4613 CrossRef.
- K. Jurkschat, H.-P. Abicht, A. Tzschach and B. Mahieu, J. Organomet. Chem., 1986, 309, C47 CrossRef CAS.
- H. Nakazawa, M. Kishishita, T. Ishiyama, T. Mizuta and K. Miyoshi, J. Organomet. Chem., 2001, 617/618, 453 CrossRef.
- R. Xi and L. R. Sita, Inorg. Chim. Acta, 1998, 270, 118 CrossRef CAS.
- M. Hesse, H. Meier and B. Zeeh, Spektroskopische Methoden in der organischen Chemie, Georg Thieme Verlag, Stuttgart, New York, 4th edn., 1991, p. 139 Search PubMed.
- M. Ehses, M. Veith, M. Zimmer and M. Burkhart, 2005, in preparation.
- T. Athar, B. Bohra and R. C. Mehrotra, Synth. React. Inorg. Met.-Org. Chem., 1989, 19, 195 CAS.
- R. M. Whittal, G. Ferguson, J. F. Gallagher and W. E. Piers, J. Am. Chem. Soc., 1991, 113, 9867 CrossRef CAS.
- H. Nakazawa, Y. Yamaguchi and K. Miyoshi, Organometallics, 1996, 15, 1337 CrossRef CAS.
- M. Knorr, E. Hallauer, V. Huch, M. Veith and P. Braunstein, Organometallics, 1996, 15, 3868 CrossRef CAS.
- J. R. Koe, H. Tobita, T. Suzuki and H. Ogino, Organometallics, 1992, 11, 150 CrossRef CAS.
- K. E. Lee, A. M. Arif and J. A. Gladysz, Organometallics, 1991, 10, 751 CrossRef CAS.
- (a) M. Veith and K. Kunze, Angew. Chem., 1991, 103, 92 CAS; (b) M. Veith and K. Kunze, Angew. Chem., Int. Ed. Engl., 1991, 30, 95 CrossRef.
- M. Veith, D. Käfer, J. Koch, P. May, L. Stahl and V. Huch, Chem. Ber., 1992, 125, 1033 CAS.
Footnotes |
| † Electronic supplementary information (ESI) available: additional details on X-ray structure and NMR data (correlations). See http://www.rsc.org/suppdata/nj/b4/b414662j/ |
| ‡ CCDC reference numbers 256747–256750. See http://www.rsc.org/suppdata/nj/b4/b414662j/ for crystallographic data in .cif or other electronic format. |
| This journal is © The Royal Society of Chemistry and the Centre National de la Recherche Scientifique 2005 |