Protein immunosensor using single-wall carbon nanotube forests with electrochemical detection of enzyme labels†
Xin
Yu
a,
Sang Nyon
Kim
b,
Fotios
Papadimitrakopoulos
*ab and
James F.
Rusling
*ac
aDepartment of Chemistry, 55 N. Eagleville Rd., University of Connecticut, Storrs, CT 06269-3060, USA. E-mail: James.Rusling@uconn.edu; Fax: +860-486-2981; Tel: +860-486-4909
bNanomaterials Optoelectronics Laboratory, Institute of Material Science, University of Connecticut, Storrs, CT 06269-3136, USA. E-mail: Papadim@mail.ims.uconn.edu
cDepartment of Pharmacology, University of Connecticut Health Center, Farmington, CT 06032, USA
First published on 24th March 2005
Abstract
Vertically aligned arrays of single-wall carbon nanotubes (SWNT forests) on pyrolytic graphite surfaces were developed for amperometric enzyme-linked immunoassays. Improved fabrication of these SWNT forests utilizing aged nanotube dispersions provided higher nanotube density and conductivity. Biosensor performance enhancement was monitored using nanotube-bound peroxidase enzymes showing a 3.5-fold better sensitivity for H2O2 than when using fresh nanotubes to assemble the forests, and improved detection limits. Absence of improvements by electron mediation for detection of H2O2 suggested very efficient electron exchange between nanotubes and enzymes attached to their ends. Protein immunosensors were made by attaching antibodies to the carboxylated ends of nanotube forests. Utilizing casein/detergent blocking to minimize non-specific binding, a detection limit of 75 pmol mL−1 (75 nM) was achieved for human serum albumin (HSA) in unmediated sandwich immunosensors using horseradish peroxidase (HRP) labels. Mediation of the immunosensors dramatically lowered the detection limit to 1 pmol mL−1 (1 nM), providing significantly better performance than alternative methods. In the immunosensor case, the average distance between HRP labels and nanotube ends is presumably too large for efficient direct electron exchange, but this situation can be overcome by electron mediation.
Introduction
The high electrical conductivity, excellent chemical stability, and unique structural robustness of single wall carbon nanotubes (SWNTs)1,2 have sparked considerable scientific and technological interest.3,4 A number of novel applications have been evaluated or predicted, including field emitters,5,6 nano-electronic devices,7,8 nanoactuators,9 nanosized computing,10 sensors,11–13 fuel cells,14 and electromechanical devices.15Carbon SWNTs behave either as metals or as semiconductors, depending on their chemical structure16–18 and degree of doping.19 The high electronic conductivity per unit mass suggests that carbon nanotubes may have the ability to facilitate direct electron-transfer with biomolecules, acting as molecular-scale electrical conduits, and providing opportunities for designing nanoscale biosensors.20 Similarities between the size scales of enzymes and chemically shortened SWNTs21 may promote the likelihood of SWNTs coming within electron tunneling distance of enzyme redox sites,22 improving sensitivity for enzyme labels that generate signals by direct electron exchange with nanotubes. A number of biosensor applications have been evaluated by utilizing electrochemistry of proteins, redox cofactors or DNA on flat mat-like layers of single or multi-walled carbon nanotubes.23–33
Several prototype carbon nanotube-based immunosensors have already been reported. One of these is based on an electrochemical transistor configuration featuring carbon nanotubes that span source and drain electrodes. Antigens were bound to Tween 20 adsorbed to the sides of these SWNTs.34 Change in the conductance of such transistors were detected upon antibody binding. More recent studies showed that proteins adsorbed to the metal–nanotube junctions of similar devices were central to the gating of these transistors, whereas most proteins that adsorbed only to the carbon nanotubes did not influence gating.35 In another report, etched nanotube–polymer composites were used to develop a sandwich antibody–antigen assay with nanomolar electrochemiluminescent detection using Ru(bpy)32+-labeled secondary antibodies.36
We are pursuing alternative biosensor designs based on highly oriented single wall carbon nanotubes standing perpendicular on conductive substrates to take advantage of the highly directional conduction pathways of the nanotubes. We recently developed a methodology for making dense, orthogonally oriented arrays of shortened SWNTs.37 Assembly of these SWNTs forests on solid substrates relies on oxidative shortening of nanotubes that selectively localize carboxylate groups primarily at the severed ends. SWNTs assemble vertically from DMF dispersions onto thin iron hydroxide-decorated Nafion films.37 These vertical assemblies were characterized by atomic force microscopy, Raman spectroscopy, and quartz crystal microbalance studies. These SWNT forests possess significantly higher packing density and thus superior mechanical properties than vertical SWNTs grown by chemical vapor deposition.38 Following our initial report, several research groups reported similar nanotube organization methodologies based on physical and chemical grafting to produce SWNT forest arrays.39,40 Diao et al. used SWNT forests on gold to measure the electrochemistry of small soluble electroactive ions.39
SWNTs greatly increase the surface area of traditional 2-D electrodes while maintaining high conductivity41 and providing surface functional groups for bioconjugation with enzymes and antibodies. The terminal carboxylate groups on SWNT forests enable covalent binding of nanotubes with proteins through amide linkages, thus coupling sensing biomolecules to transducers. We recently reported42 such binding of electrochemically active iron heme enzymes to SWNT forests to give electrochemical signatures of enzyme activity. Prototype biosensors designed in this way with myoglobin and horseradish peroxidase featured direct, chemically reversible FeIII/FeII heme voltammetry and catalytic responses to hydrogen peroxide. Gooding et al.43 reported chemically reversible FeIII/FeII heme voltammetry of protein fragment microperoxidase MP-11 covalently bound to the ends of SWNT forests on a gold electrode. Willner and coworkers reconstituted glucose oxidase on the ends of carbon SWNT forests covalently linked to the enzyme's FAD cofactor. The resulting electrodes gave an unmediated electrochemical response to glucose that depended on the length of the carbon nanotubes.44 Electrons were conducted down the nanotubes over 150 nm lengths. More recently, we described a prototype amperometric immunosensor based on adsorption of anti-biotin antibodies onto SWNT forests.45 Using a soluble mediator and horseradish peroxidase (HRP) labeled biotin, sensitive detection of the small molecule biotin was achieved by using a competitive immunoassay.
Our long term goal is to develop SWNT forests in biosensor nano-arrays for applications such as medical proteomics and bio-pathogen detection. The immediate task addressed in this paper involves optimizing SWNT forest growth and performance for biosensors. Herein, we focus on peroxidase-linked amperometric immunoassays because of the ready availability of antibodies and enzyme-linked antibodies for a large variety of protein and bacterial antigens.46 Peroxidases are iron heme enzymes,47 used widely as labels in electrochemical detection in immunosensing48–51 and DNA hybridization.50,52,53 Peroxidases give large catalytic electrochemical signals in the presence of small concentrations of hydrogen peroxide at low applied voltages.54 Most amperometric peroxidase-based immunosensors reported to date have employed soluble mediators,48b redox polymers55 or conductive polymer mediators,49 or a second enzyme substrate with electroactive product56 to detect the binding event.
In this paper, we show that improved detection limits and sensitivity for unmediated catalysis of H2O2 reduction by peroxidases bound to SWNTs resulted from denser and more defect-free SWNT forests made with aged nanotube dispersions in DMF. Moreover, by attaching antibodies to the ends of SWNT forests, we obtained excellent sensitivity in sandwich immunoassays for the protein human serum albumin with detection limits in the low pmol mL−1 (nanomolar) range.
Experimental section
Chemicals and materials
Horseradish peroxidase, horse heart myoglobin, vitamin-free casein from bovine milk (fatty acid and globulin free) lyophilized 99% human serum albumin (HSA), and polyclonal (rabbit) anti-HSA antibody were obtained from Sigma. HRP-conjugated human polyclonal (rabbit) anti-HSA antibody was obtained from Abcam. Immunoreagents and casein were dissolved in pH 7.2 phosphate (PBS) buffer (0.1 M in phosphate, 0.14 M NaCl, 2.7 mM KCl) unless otherwise noted. 1-(3-(dimethylamino)propyl)-3-ethylcarbodiimide hydrochloride (EDC) and N-hydroxysulfosuccinimide (NHSS) were dissolved in water immediately before use. Single-wall carbon nanotubes (HiPco) were obtained from Carbon Nanotechnologies, Inc.Electrochemical measurements
A CHI 430 electrochemical workstation was used for cyclic voltammetry and amperometry at ambient temperature (22 ± 2 °C) in a three-electrode cell. Amperometry was performed at −0.2 V vs. SCE with the SWNT working electrode rotated at 2000 rpm, as these conditions gave optimum sensitivity.Assembly of SWNT forests
Forests were assembled on Si wafers for AFM and Raman spectroscopy and abraded basal plane pyrolytic graphite (PG) disk electrodes for sensing experiments. Nanotubes were carboxyl-functionalized and shortened by sonication in 3 ∶ 1 HNO3–H2SO4 for 4 h at 70 °C.37 These dispersions were filtered, washed with water and dried. PG and Si surfaces were prepared for nanotube assembly by forming a thin layer of Nafion on their surfaces onto which iron is adsorbed to later form a Fe(OH)x surface precipitate.37,42 After immersion of these substrates into DMF dispersions of shortened SWNTs, vertical assemblies of nanotubes are formed (SWNT forests), which are then dried in vacuum for 18 h.Immobilization of proteins
20 µL freshly prepared 24 mM EDC in water was placed onto the SWNT forests, followed by 20 µL of 3 mg mL−1 Mb or HRP, reacted 8 h, then washed with water. For antibody attachment, 30 µL of freshly prepared 400 mM EDC and 100 mM NHSS in water were placed onto SWNT forest electrodes, and washed off after 10 mins. This was immediately followed by 3 h incubation with 20 µL of 6 nmol mL−1 antibody in pH 7.2 buffer containing 0.05% Tween-20. The electrode was then washed with 0.05% Tween-20 and PBS buffer. Washing steps used here and below were adapted from the procedure previously recommended to block non-specific binding (NSB) by treating surfaces with attached antibody with protein and detergent at every step of the assembly and assay.57 However, we found that casein was much more effective at blocking NSB on our immunosensors than bovine serum albumin, as reported previously.58 Omission of any of the washing steps below resulted in significantly increased NSB.The steps in the sandwich assay procedure for HSA (Scheme 1) were as follows:
 | ||
| Scheme 1 Schematic diagram of HSA sandwich assay procedure. | ||
1. The anti-HSA/SWNT electrode sensor constructed as described above was treated with 20 µL of 2% casein + 0.05% Tween-20, followed by washing with 0.05% Tween-20 and PBS buffer for 20 mins. Additional washings with detergent solution after the casein treatments were necessary to give the most sensitive signal development, and presumably remove loosely bound casein.
2. The immunosensor was then secured in an inverted position and incubated with a 10 µL drop of pH 7.2 PBS buffer containing HSA, 0.05% Tween-20, and 2% casein for 1 h, followed by washing with 0.05% Tween-20 in buffer for 20 mins.
3. The immunosensor was then incubated again with 20 µL 2% casein + 0.05% Tween-20 in PBS for 1 h, followed by washing with 0.05% Tween-20 and PBS buffer for 20 mins.
4. The next step (Scheme 1) was to incubate the inverted sensor with a 10 µL drop of 6 nmol ml−1 HRP-labeled anti-HSA in buffer containing 2% casein and 0.05% Tween-20 for 1 h, followed by washing in 0.05% Tween-20.
5. The immunosensor was then placed in an electrochemical cell containing 10 mL pH 7.2 PBS buffer. Rotating disk amperometry at 2000 rpm was done at −0.2 V vs. SCE with 0.4 mM H2O2 added to detect the HRP labels. For mediated immunoassays, an optimized concentration of 0.4 mM hydroquinone was added to the buffer.
Results
Characterization of SWNTs
Treatment of SWNTs by sonication in acid at 70 °C resulted in the removal of metallic and carbonaceous impurities and assisted in the generation of carboxylate defects localized primarily on the ends of the shortened nanotubes.59,60 The initial driving force for the formation of SWNT forests originates from acid–base neutralization between one of the two SWNT ends with basic Fe(OH)x+3−x (x = 1, 2 and 3) domains formed by slow precipitation on Nafion-adsorbed Fe3+ ions involving trace amounts of water during the DMF washing step.37,61 The lateral bundled growth of the vertical SWNT domains is driven by the tendency of the assembly to reduce the overall hydrophobic surface area that originates from SWNT side walls.By monitoring peroxidase activity of enzymes attached to SWNT forests amperometrically, we demonstrated increased sensitivity for H2O2 (shown in sections below) for SWNT dispersions that had been aged for long periods in DMF prior to forest assembly. Resonance Raman spectra showed clear differences between the assemblies made from SWNT dispersions aged in DMF for 1 h (used previously) and 3 months following the acid and sonication-assisted oxidation. Fig. 1(a) shows the graphite- (G-) and defect- (D-) modes in the SWNT spectra, which are characteristic of SWNTs.62 The D-band, typically observed between 1250 and 1450 cm−1, originates from the first-order scattering by in-plane hetero-atom substituents, grain boundaries, vacancies or the other defects and by finite size defects.62 It was reported that defect sites substantially decrease the one dimensional conductivity of SWNTs.63–65 The SWNT/DMF dispersion aged 3 months showed large decreases in D-band width compared to the SWNT/DMF dispersion aged 1 h. This indicates a decreased number of defects on SWNTs upon the prolonged aging in DMF. Correspondingly, the forests assembled from SWNT/DMF dispersions aged 3 months showed much smaller D-band widths than the assemblies made from nanotubes aged for 1 h (Fig. 1(b)). The underlying mechanism for this time-assisted “self-healing” of shortened SWNTs is presently unclear, and further work is underway to elucidate its nature.
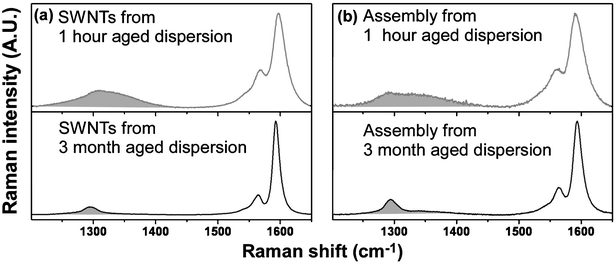 | ||
| Fig. 1 785 nm Resonance Raman spectra of acid treated SWNTs after dispersion in DMF and (a) aging for 1 hour and 3 months, respectively and (b) self-assembly of SWNT forests on Si substrates from the above DMF/SWNTs dispersion. Shaded regions indicate the locations of defect-induced band (D-band). | ||
Due to experimental difficulties in the direct measurement of resistivity for SWNT forests, we used non-oriented free-standing films prepared from SWNTs for low-current four point resistivity measurements.† The measured resistivity of the film from 3-month aged SWNTs was 5.7 × 10⁻⁵ Ωm, four-fold smaller than the value of 2.2 × 10⁻⁴ Ωm for SWNT films made from fresh (1 h) dispersions. The resistivities of these SWNT films are comparable to those previously observed for carbon nanotube paper (∼10−4 Ωm).66
Atomic force microscopy (AFM) images showed that SWNT forests made from the dispersions aged for 3 months achieved nearly full coverage of the underlying surface (Fig. 2a). Section analysis (see Figure S1†) on AFMs of the SWNT forest surface showed that the average width of major features is ∼20 nm. This is significantly larger than the 1.4 nm diameter of a single nanotube due to nanotube aggregation during forest assembly and tip-induced broadening in the AFM.39 Analysis of AFM images showed that the forest assembly using the SWNT dispersions aged for 3 months provided two to three times larger surface coverage than dispersions aged for 1 h, as used in our previous communication.42 This is believed to originate from the significant reduction of nanotube defects that are typically ionic in nature (i.e., carboxylic) and result in charge repulsion, which would thereby decrease surface coverage and bundling.
 | ||
| Fig. 2 Representative tapping mode atomic force microscopy (AFM) images of: (a) SWNT forest on smooth silicon made using the 3-month aged SWNT/DMF dispersions, and (b) HSA antibody attached to SWNT forest on smooth silicon. | ||
Fig. 2(b) shows an AFM image after the antibody anti-HSA was covalently linked onto the SWNTs using EDC/NHSS (see Experimental section). The spiky nanotube forest features disappeared, and a globular coating generally reminiscent of thin polyion or protein coatings67 can be seen. Moreover, a 2-fold increase in domain height and a 4-fold increase in domain width were observed after enzyme or antibody functionalization, consistent with a thin layer of protein or antibody built on top of the nanotube forest.68 Similar AFM images were obtained for SWNT forests on which myoglobin, HRP, or anti-HSA were attached.
Electrochemistry of SWNTs and SWNT/peroxidases
Voltammetry of the nanotube forests themselves before and after covalent attachment of proteins with peroxidase activity was used to monitor changes in the SWNT forests made from nanotubes aged in DMF compared to previously used forests made with freshly oxidized nanotubes. A small oxidation–reduction peak pair centered at 0.1 V vs. SCE was found by cyclic voltammetry (CV) of underivatized SWNT forests (Fig. 3a), similar to peaks at a similar potential assigned by Luo et al. to carboxylate groups on matted SWNT electrodes.69 Addition of 0.2 mM H2O2 to the buffer resulted in little change of the voltammogram, except for a small increase in charging current over the entire voltage range. These CVs showed in general cleaner backgrounds and smaller peaks at 0.1 V than those reported earlier for forests made with freshly cleaved nanotubes, which had small unexplained bumps in the negative potential range.42 | ||
| Fig. 3 Cyclic voltammograms at 300 mV s−1 in pH 5.5 buffer of: (a) bare, underivatized SWNT forest made with 3-month aged nanotube/DMF dispersions on PG with and without 0.2 mM H2O2, and (b) SWNT/Mb in pH 5.5 buffer and SWNT/HRP in pH 6.5 buffer before and after 1 month storage in buffer. | ||
As a further comparison of SWNT forests made with fresh and aged nanotubes, we then attached HRP and myoglobin (Mb), both having peroxidase activity, to the ends of the forests. CVs of these redox protein–SWNT films (Fig. 3b) showed well-defined, reversible oxidation–reduction peak pairs near −0.24 V vs. SCE for Mb, and −0.35 V vs. SCE for HRP, characteristic of the FeIII/FeII redox couples of these iron heme proteins in thin films.70 These chemically reversible peak pairs were much larger, better defined and less broad than for the same proteins on SWNT forests made with freshly cleaved nanotubes.42 Results are consistent with larger protein loading on the denser SWNT forests made with aged nanotubes compared to those made with fresh nanotubes. Surface concentrations obtained by integrating the reduction peaks increased from 0.09 to 0.2 nmol cm−2 for Mb and from 0.035 to 0.07 nmol cm−2 for HRP for forests made with aged vs. fresh nanotubes. CVs had nearly symmetrical peak shapes, roughly equal reduction and oxidation peak currents, and small differences in the oxidation and reduction peak potentials. Peak currents of the films increased linearly with increasing scan rate up to 0.6 V s−1 (Figure S2†). CV results were typical of non-ideal reversible voltammetry of a thin surface-bound layer of redox proteins.68 Moreover, CV peaks of the bare SWNT forests attributed to carboxylate seem to disappear from the protein CVs, suggesting that carboxyl groups on the SWNTs reacted as expected during EDC-assisted protein coupling to the nanotubes.
The protein films were quite stable as observed from the minor changes in peak area and current after films used for numerous CV scans were stored for a month in pH 7.0 buffer (Fig. 3b).71 For films with Mb, peak current dropped by 7% and peak area decreased 6% after 1 month storage. For HRP, peak current remained the same and peak area decreased only 0.5% after 1 month storage. In contrast, CVs of HRP and Mb films prepared on SWNT forests without the EDC-assisted covalent binding protocol decayed to background levels in less than 30 min in buffer.
Catalytic reduction of hydrogen peroxide
H2O2 converts the iron heme cofactors of Mb and HRP to oxyferryl radicals initiating an electrochemically detectable catalytic pathway for reduction of H2O2.54,70 Adding micromolar amounts of H2O2 to buffers containing SWNT/Mb or SWNT/HRP electrodes gave large increases in CV reduction current at the FeIII potential, accompanied by a disappearance of the FeII oxidation peak (Figure S3†). CV results were all characteristic of electrochemical enzyme-catalyzed reduction of H2O2.42,54,68,70 Plots of catalytic peak current vs. [H2O2] were linear in the µM H2O2 concentration range.Better sensitivity and detection limits for H2O2 were achieved by using rotating disk amperometry. Applied potential of −0.2 V vs. SCE and rotation rate of 2000 rpm were found to be the operating parameters that gave the best sensitivity. Increases in steady state current of tens of nano-amps were observed for electrodes with Mb or HRP attached to SWNT forests within a few seconds after injecting quantities of H2O2 resulting in 200 nM concentration increases (Fig. 4a). Detection limits for H2O2 were measured by injecting very small amounts of H2O2 until the steady state current observed was about 3 times the noise. The detection limit was 40 nM for SWNT/HRP and 80 nM for SWNT/Mb (Fig. 4b). Results for H2O2 detection are summarized in Table 1. The sensitivity to H2O2 as the slope of the calibration curve below 2 µM was 0.179 µA µM−1 for SWNT/HRP, which is 66% better than the sensitivity of SWNT/Mb at 0.108 µA µM−1 (Fig. 4c). This is consistent with the better peroxidase activity of HRP in films compared to Mb.70 As we discuss in more detail in the discussion section, these sensitivities and detection limits using DMF-aged shortened SWNT forests represent significant improvements to those reported in our earlier short communication using forests made with fresh nanotubes and the same enzymes.42
 | ||
| Fig. 4 Catalytic electrochemical signals for hydrogen peroxide on SWNT/enzyme electrodes from rotating disk amperometry at −0.2 V vs. SCE and 2000 rpm of SWNT/Mb and SWNT/HRP electrodes showing stepwise increases in reduction current after H2O2 injections into the buffer: (a) 200 nM increases in H2O2 concentration, and (b) 40 nM (SWNT/HRP) and 80 nM (SWNT/Mb) increases in H2O2 concentration, near the detection limit. The amperometric results also showed that the SWNT forest electrodes are stable under hydrodynamic conditions; (c) calibration curves from rotating disk amperometry (n = 4 electrodes). | ||
| Film structure | Concentration of electroactive protein/nmol cm−2 | Sensitivity for H2O2 dI/d[H2O2] in µA µM−1 | Approximate detection limit/nM H2O2 |
|---|---|---|---|
| a Concentration of electroactive protein estimated by integration of CV reduction peak at scan rates less than 50 mV s−1; sensitivity given as slope of calibration curve from amperometry at −0.2 V with rotating disk electrode (2000 rpm); detection limits experimentally determined as 3 times the average noise. Results are averages from 4 electrodes. | |||
| SWNT/Mb | 0.195 ± 0.014 | 0.108 ± 0.006 | 80 |
| SWNT/HRP | 0.080 ± 0.008 | 0.179 ± 0.009 | 40 |
We also compared detection of H2O2 with the SWNT forest–protein electrodes using mediation with 0.4 mM hydroquinone, which we have used effectively in HRP-linked biotin SWNT immunosensors.45 These experiments gave sensitivities and detection limits that were within experimental error of the values found by direct electron transfer (Figure S4†). These results suggest that mediation does not improve electrical communication between the nanotubes and the peroxide activated proteins attached directly to their ends.
Stability of SWNT/protein films was examined in solutions containing H2O2. CVs of films were initially obtained in buffers without hydrogen peroxide, the film was then exposed to 1 µM hydrogen peroxide (in buffer) while rotating the electrode and applying −0.2 V. After 1 and 6 h, the electrode was washed, then transferred to buffer without hydrogen peroxide. After 1 h, the peak currents and areas of the CVs showed no significant changes. After 6 h the HRP peak current decreased 12% and area decreased 14%. For Mb, peak current decreased 9% and peak area decreased 22% after 6 h exposure to peroxide. These results suggest adequate stability under perceived analytical operating conditions.
Detection of human serum albumin
We developed a sandwich electrochemical immunoassay for human serum albumin (HSA) on the SWNT electrodes (Scheme 1). It was essential to block non-specific binding (NSB) to achieve the best sensitivity and detection limits, and a detailed NSB blocking procedure utilizing competitive binding of the protein casein and the detergent Tween 20 was developed (see Experimental section). In short, binding steps were accomplished by placing a 10 µL drop of HSA solution on the surface of SWNT/anti-HSA immunosensors, washing, then covering with a drop of anti-HSA-HRP solution. When all the binding and washing steps were completed, the sensors were transferred into an electrochemical cell containing buffer, H2O2 was injected, and the amperometric response resulting from the HRP label was measured. Using this approach, steady state current measured by direct electron transfer increased (Fig. 5A) with increases in the amount of HSA in the range from 0.075 to 7.5 nmol mL−1. Good linearity (Fig. 5B) and excellent reproducibility as shown by the small error bars was achieved. In this unmediated assay, the sensitivity was 0.004 nA/pmol mL−1. | ||
| Fig. 5 Unmediated amperometric sandwich assays at −0.2 V and 2000 rpm for HSA in which SWNT/anti-HSA immunosensor electrodes were incubated with HSA (concentration in nmol mL−1 labeled on curves) in 20 µL 2% casein + 0.05% Tween-20 in PBS for 1 h followed by 10 µL 6 nmol mL−1 anti-HSA-HRP for 1 h: (A) currents after placing immunosensor electrodes in buffer, then injecting H2O2 to 0.4 mM. Controls are shown on the right with HSA concentrations used: (a) electrode with anti-HSA treated Nafion-iron oxide-coated PG electrode, (b) full immunosensor without addition of HSA, (c) and (d) bare PG electrode treated with anti-HSA, then 2 different HSA levels; and (B) influence of HSA concentration on steady state current for SWNT/anti-HSA immunosensor (n = 4). | ||
Control experiments were done to assess the influence of non-specific binding of anti-HSA-HRP and the influence of the SWNT forests on the HSA sandwich assay (Fig. 5A). In control (a) a PG electrode coated with Nafion-iron oxide was treated with anti-HSA and exposed to the full assay procedure with 1.5 nmol mL−1 HSA. The response was about 10-fold smaller than that of the SWNT immunosensor for 1.5 nmol mL−1, and about the same as that of control (b), a SWNT immunosensor taken through the full procedure without addition of HSA. The latter control response is likely to reflect the residual NSB. The detection limit of the sandwich assay for HSA as 3× the noise level above this control was ∼75 pmol mL−1 (75 nM). Controls (c) and (d) were bare PG electrodes without SWNTs taken through the anti-HSA attachment and immunoassay procedures and exposed to 2 different HSA levels. Signals here were 7-fold smaller than for the full immunosensor at the respective HSA concentrations.
Since direct electron transfer was suspected to be inefficient because of a finite average distance between the ends of the nanotubes and the HRP labels in the Ab1/HSA/Ab2-HRP sandwich configuration (Scheme 1), we explored electron mediation by hydroquinone. Preliminary studies by voltammetry and amperometry showed that hydroquinone efficiently mediated the reduction of peroxide-activated HRP in the sandwich assay with an optimum concentration of 0.4 mM. Immunosensors were treated the same as described above, but the detection step included both H2O2 and hydroquinone. The mediated steady state current using this approach increased (Fig. 6A) with the increase in the amount of HSA in the concentration range from 1 to hundreds of pmol mL−1, reflecting a nearly 100-fold increase in current. The calibration curve in this case was only linear at concentrations of HSA less that ∼20 pmol mL−1 (Fig. 6B), but the signal continued to increase up to several hundred pmol mL−1. Compared to the unmediated case, sensitivity was improved dramatically to 46 nA/pmol mL−1.
 | ||
| Fig. 6 Mediated amperometric sandwich assays at −0.2 V and 2000 rpm for HSA in which SWNT/anti-HSA immunosensors were incubated with HSA (concentration in pmol mL−1 labeled on curves) in 20 µL 2% casein + 0.05% Tween-20 in PBS for 1 h followed by 10 µL 0.6 nmol mL−1 anti-HSA-HRP for 1 h: (A) currents after placing electrodes in buffer containing 0.4 mM HQ, then injecting H2O2 to 0.4 mM. Controls are shown on the right with HSA concentrations: (a) anti-HSA treated Nafion-iron oxide-coated PG electrode, (b) SWNT-anti-HSA immunosensor omitting addition of HSA, (c) and (d) anti-HSA treated bare PG electrode for 2 different HSA levels; and (B) influence of HSA concentration on steady state current for SWNT/anti-HSA immunosensor (n = 4). | ||
Control experiments were also performed for the mediated detection of HSA (Fig. 6A). In control (a) a PG electrode coated with Nafion-iron oxide was treated with anti-HSA and exposed to full sandwich procedure using 140 pmol mL−1 HSA. The response was 16-fold smaller than that of the SWNT immunosensor for 140 pmol mL−1, and only a little larger than that of control (b), a SWNT immunosensor taken through the full procedure without HSA. The latter control responses are likely to reflect the residual NSB. The detection limit for HSA estimated as 3× the noise level above this control was ∼1 pmol mL−1 (1 nM). Controls (c) and (d) were bare PG electrodes without SWNTs taken through the anti-HSA attachment and mediated immunoassay procedures and exposed to 2 different HSA levels. Signals of these controls were about 8-fold smaller than that for the full immunosensor at the equivalent HSA concentrations.
Discussion
Results presented herein demonstrate the feasibility of designing sensitive immunosensors for proteins by covalently binding antibodies to the carboxylated ends of carbon SWNT forests. Improvements in SWNT forest fabrication originated mainly from using aged shortened SWNT dispersions in DMF. This significantly reduced the number of nanotube defects, promoting denser arrays than those we reported earlier with fresh nanotube dispersions. The influence of improvements in SWNT forest fabrication on sensor performance was demonstrated by increases in sensitivity and improved detection limits for simple sensors for H2O2 featuring SWNT forests with HRP and Mb attached to nanotube ends (Table 1). The sensitivity was 0.18 µA µM−1 for H2O2 for the present SWNT/HRP sensors using aged shortened nanotubes, as opposed to 0.049 µA µM−1 in our earlier short communication using fresh nanotubes.42 Similarly, the present sensitivity with SWNT/Mb sensors was 0.11 µA µM−1 compared to the earlier value 0.033 µA µM−1. These data represent ∼3.5-fold improvements in sensitivity, due mainly to increased nanotube density and achievement of higher enzyme loadings than previously. The previous detection limit of ∼100 nM42 for H2O2 was improved to 40 nM for SWNT/HRP by the fabrication procedure in the present paper using aged nanotubes. The fact that mediation does not improve the detection limit or sensitivity suggests that the nanotube forests are electrically connecting nearly all of the enzyme attached to their ends and facilitate efficient electron exchange.Amperometric measurement of human serum albumin (HSA) relying on electron exchange directly between the HRP label and the antibody-modified nanotube forest immunosensors provided a detection limit of ∼75 pmol mL−1
(75 nM) and sensitivity of 0.004 nA/pmol mL−1
(Fig. 5). Using hydroquinone to mediate electron flow between HRP labels and the nanotubes improved the detection limit to ∼1 pmol mL−1
(1 nM) and gave a sensitivity of 46 nA/pmol mL−1(Fig. 6). This represents a 75-fold improvement in detection limit and a >10![[thin space (1/6-em)]](https://www.rsc.org/images/entities/char_2009.gif) 000-fold improvement in sensitivity. Significant performance enhancements for the mediated case suggest that direct electron transfer does not electrically connect all of the HRP labels to the sensor. Presumably, the HRP labels in the sandwich assay system are on average too far from the nanotube ends for efficient direct electron exchange, but this situation can be overcome by electron mediation.
000-fold improvement in sensitivity. Significant performance enhancements for the mediated case suggest that direct electron transfer does not electrically connect all of the HRP labels to the sensor. Presumably, the HRP labels in the sandwich assay system are on average too far from the nanotube ends for efficient direct electron exchange, but this situation can be overcome by electron mediation.
Judging from the controls represented in Figs 5 and 6, detection limits seem to be governed by residual NSB. In fact, rather rigorous casein/detergent washing procedures designed to minimize NSB were required to achieve the detection limits reported here.
Human serum albumin (HSA) is synthesized in the liver and represents 40–60% of total protein in human serum.72 The determination of urinary HSA is important in the clinical diagnosis of kidney function abnormalities and microalbuminuria in cancer patients.73 Concentrations of urinary HSA > 20 µg mL−1 (300 pmol mL−1) are indicative of diabetic nephrosis.74 A classic method for HSA determination involved salting out the globulins, leaving HSA in solution to be determined by colorimetry.75 More recent methods with the lowest detection limits (DL) reported to date are as follows: (1) a particle-enhanced enzyme-linked immunosorbent assay (ELISA) method74 with DL of 15 pmol mL−1; (2) a commercial ELISA kit76 claiming DL of 3 pmol mL−1, (3) a surface acoustic wave method77 with DL of 3 pmol mL−1, and (4) a potentiometric stripping method requiring metal ion-labeling of the HSA that provides a 3 pmol mL−1 detection limit. In comparison, the SWNT immunosensors described herein provided a lower detection limit (1 pmol mL−1) than the other reported methods.
The importance of SWNT forests for sensitivity and low DL is confirmed by controls (a), (c) and (d) in Figs 5A and 6A. These results clearly show that the SWNT immunosensors give 7–10 fold greater amperometric signals than immunosensor electrodes made with bare or Nafion–iron oxide coated PG. We believe the main advantages to include densely packed, patternable conductive nanotubes resulting in high surface area forests with functional groups at their ends that allow simple bioconjugation to optimal amounts of primary antibodies. While the conduction properties of the nanotubes are quite important for the H2O2 sensors featuring peroxidases directly bound to nanotube ends, the immunosensors require mediation for the best sensitivity. This is probably related to distances between the HRP labels and nanotube forest ends that limit the efficiency of direct electron transfer.
In summary, carbon SWNT forests prepared at high surface coverage with a low number of defects on the nanotubes improved the efficiency of direct electron transfer between redox enzymes and SWNT forest electrodes. These improvements enhanced the sensitivity for substrate, as demonstrated by low-nanomolar detection limits of peroxidase/SWNT films to hydrogen peroxide. Mediation of the SWNT immunosensors provided a detection limit of 1 pmol mL−1 (1 nM) for HSA. SWNT forest immunosensors should be applicable to the quantitative measurement of a wide range of proteins. Future challenges involve eliminating non-specific binding more completely, developing effective strategies to avoid soluble mediation, and patterning SWNT forests into arrays for multiple protein assays. These issues are being addressed further in our laboratories.
Acknowledgements
This work was supported by US Army Research Office (ARO) via grant DAAD-02-1-0381. The authors thank Dr. Debjit Chattopadhyay (Sloan-Kettering), Maire O'Connor and Dr. Anthony Killard (Dublin City University) for helpful discussions, and Bhanu Yarlagadda and Dr. Faquir Jain for assistance with conductivity measurements.References
- P. M. Ajayan, Chem. Rev., 1999, 99, 1787–1799 CrossRef CAS.
- M. S. Dresselhaus, G. Dresselhaus and P. Avouris, Top. Appl. Phys., 2001, 80–97 Search PubMed.
- R. Saito and G. Dresselhaus, M. S. Physical Properties of Carbon Nanotubes, Imperial Coll. Press, London, 1998 Search PubMed.
- M. S. Dresselhaus, G. Dresselhaus and P. C. Eklund, Science of Fullerenes and Carbon Nanotubes, Academic Press, San Diego, 1996 Search PubMed.
- S. S. Fan, M. G. Chapline, N. R. Franklin, T. W. Tombler, A. M. Cassell and H. J. Dai, Science, 1999, 283, 512–514 CrossRef CAS.
- P. G. Collins, A. Zettl, H. Bando, A. Thess and R. E. Smalley, Science, 1997, 278, 100–102 CrossRef CAS.
- S. J. Tans, A. R. M. Verschueren and C. Dekker, Nature, 1998, 393, 49–52 CrossRef CAS.
- C. T. White and T. N. Todorov, Nature, 1998, 393, 240–242 CrossRef CAS.
- R. H. Baughman, C. X. Cui, A. A. Zakhidov, Z. Iqbal, J. N. Barisci, G. M. Spinks, G. G. Wallace, A. Mazzoldi, D. D. Rossi, A. G. Rinzler, O. Jaschinski, S. Roth and M. Kertesz, Science, 1999, 284, 1340–1344 CrossRef CAS.
- T. Rueckes, K. Kim, E. Joselevich, G. Y. Tseng, C.-L. Cheung and C. M. Lieber, Science, 2000, 289, 94–97 CrossRef CAS.
- P. G. Collins, K. Bradley, M. Ishigami and A. Zettl, Science, 2000, 287, 1801–1804 CrossRef CAS.
- J. Kong, N. R. Franklin, C. Zhou, M. G. Chapline, S. Peng, K. Cho and H. J. Dai, Science, 2000, 287, 622–625 CrossRef CAS.
- S. Sotiropoulou and N. A. Chaniotakis, Anal. Bioanal. Chem., 2003, 375, 103–105 CAS.
- A. C. Dillon, K. M. Jones, T. A. Bekkedahl, C. H. Kiang, D. S. Bethune and M. J. Heben, Nature, 1997, 386, 377–379 CrossRef CAS.
- P. Poncharal, Z. L. Wang, D. Ugarte and W. A. Heer, Science, 1999, 283, 1513–1516 CrossRef CAS.
- R. Saito, M. Fujita, G. Dresselhaus and M. S. Dresselhaus, Appl. Phys. Lett., 1992, 60, 2204–2206 CrossRef CAS.
- J. W. G. Wilder, L. C. Venema, A. G. Rinzler, R. E. Smalley and C. Dekker, Nature, 1998, 391, 59–62 CrossRef CAS.
- T. W. Odom, J. L. Huang, P. Kim and C. M. Lieber, Nature, 1998, 391, 62–64 CrossRef CAS.
- R. S. Lee, H. J. Kim, J. E. Fischer, A. Thess and R. E. Smalley, Nature, 1997, 388, 255–257 CrossRef CAS.
- E. Katz and I. Willner, ChemPhysChem, 2004, 5, 1084–1104 CrossRef CAS.
- D. Chattopadhyay, S. Lastella, S. Kim and F. Papadimitrakopoulos, J. Am. Chem. Soc., 2002, 124, 728–729 CrossRef CAS.
- A. Guiseppi-Elie, C. Lei and R. H. Baughman, Nanotechnol., 2002, 13, 559–565 CrossRef.
- S. G. Wang, Q. Zhang, R. Wang and S. F. Yoon, Biochem. Biophys. Res. Comm., 2003, 311, 572–576 CrossRef CAS.
- M. Musameh, J. Wang, A. Merkoci and Y. Lin, Electrochem. Commun., 2002, 4, 743–746 CrossRef.
- J. Wang and M. Musameh, Analyst, 2003, 128, 1382–1385 RSC.
- J. Wang and M. Musameh, Anal. Lett., 2003, 36, 2041–2048 CrossRef CAS.
- M. Gao, L. Dai and G. Wallace, Synth. Met., 2003, 137, 1393–1394 CrossRef CAS.
- H. Xue, W. Sun, B. He and Z. Shen, Synth. Met., 2003, 135–136, 831–832 CrossRef CAS.
- J. Xu, J. Zhu, Q. Wu, Z. Hu and H. Chen, Electroanalysis, 2003, 15, 219–224 CrossRef.
- J. Wang and M. Musameh, Anal. Chem., 2003, 75, 2075–2079 CrossRef CAS.
- J. Wang, M. Musameh and Y. Lin, J. Am. Chem. Soc., 2003, 125, 2408–2409 CrossRef CAS.
- H. Cai, X. Cao, Y. Jiang, P. He and Y. Fang, Anal. Bioanal. Chem., 2003, 375, 287–293 CAS.
- J. Wang, M. Li, Z. Shi, N. Li and Z. Gu, Anal. Chem., 2002, 74, 1993–1997 CrossRef CAS.
- R. J. Chen, S. Bangsaruntip, K. A. Drouvalakis, N. W. S. Kam, M. Shim, Y. Li, W. Kim, P. J. Utz and H. Dai, Proc. Nat. Acad. Sci. U. S. A., 2003, 100, 4984–4989 CrossRef CAS.
- R. J. Chen, H. C. Choi, S. Bangsaruntip, E. Yenilmez, X. Tang, Q. Wang, Y.-L. Chang and H. Dai, J. Am. Chem. Soc., 2004, 126, 1563–1568 CrossRef CAS.
- J. N. Wohlstadler, J. L. Wilbur, G. B. Sigal, H. A. Biebuyck, M. A. Billadeau, L. Dong, A. B. Fisher, S. R. Gudibande, S. H. Jameison, J. H. Kenten, J. Leginus, J. K. Leland, R. J. Massey and S. J. Wohlstadler, Adv. Materials, 2003, 15, 1184–1187 CrossRef CAS.
- D. Chattopadhyay, I. Galeska and F. Papadimitrakopoulos, J. Am. Chem. Soc., 2001, 123, 9451–9452 CrossRef CAS.
- A. Cao, X. Zhang, C. Xu, J. Liang, D. Wu, X. Chen, B. Wei and P. M. Ajayan, Appl. Phys. Lett., 2001, 79, 1252–1254 CrossRef CAS.
- P. Diao, Z. Liu, B. Wu, X. Nan, J. Zhang and Z. Wei, ChemPhysChem, 2002, 3, 898–901 CrossRef CAS.
- L. Cai, J. L. Bahr, Y. Yao and J. M. Tour, Chem. Mater., 2002, 14, 4235–4241 CrossRef CAS.
- Z. Yao, C. L. Kane and C. Dekker, Phys. Rev. Lett., 2000, 84, 2941–2944 CrossRef CAS.
- X. Yu, D. Chattopadhyay, I. Galeska, F. Papadimitrakopoulos and J. F. Rusling, Electrochem. Commun., 2003, 5, 408–411 CrossRef CAS.
- J. J. Gooding, R. Wibowo, J. Liu, W. Yang, D. Losic, S. Orbons, F. J. Mearns, J. G. Shapter and D. B. Hibbert, J. Am. Chem. Soc., 2003, 125, 9006–9007 CrossRef CAS.
- F. Patolsky, Y. Weizmann and I. Willner, Angew. Chem. Int. Ed., 2004, 43, 2113–2117 CrossRef CAS.
- M. O'Connor, S. N. Kim, A. J. Killard, M. R. Smyth, F. Papadimitrakopoulos and J. F. Rusling, Analyst, 2004, 129, 1176–1180 RSC.
- P. Tijssen, Practice and Theory of Enzyme Immunoassay, Elsevier, Oxford, 1985 Search PubMed.
- T. Ruzgas, E. Csoregi, J. Emneus, L. Gorton and G. Marko-Varga, Anal. Chim. Acta, 1996, 330, 123–138 CrossRef CAS.
- (a) B. Lu, E. I. Iwuoha, M. R. Smyth and R. O'Kennedy, Anal. Commun., 1997, 34, 21–23 RSC; (b) B. Lu, E. I. Smyth and R. O'Kennedy, Anal. Chim. Acta, 1996, 331, 97–102 CrossRef CAS.
- (a) A. J. Killard, S. Zhang, H. Zhao, R. John, E. I. Iwuoha and M. R. Smyth, Anal. Chim. Acta, 1999, 400, 109–119 CrossRef CAS; (b) A. J. Killard, L. Micheli, K. Grennan, M. Franek, V. Kolar, D. Moscone, I. Palchetti and M. R. Smyth, Anal. Chim. Acta, 2001, 427, 173–180 CrossRef CAS.
- F. Azek, C. Grossiord, M. Joannes, B. Limoges and P. Brossier, Anal. Biochem., 2000, 284, 107–113 CrossRef CAS.
- A. Benkert, F. Scheller, W. Schossler, C. Hentschel, B. Micheel, O. Behrsing, G. Scharte, W. Stocklein and A. Warsinke, Anal. Chem., 2000, 72, 916–921 CrossRef CAS.
- D. J. Caruana and A. Heller, J. Am. Chem. Soc., 1999, 121, 769–774 CrossRef CAS.
- E. Palacek and M. Fojto, Anal. Chem., 2001, 73, 75A–83A.
- T. Ruzgas, A. Lindgren, L. Gorton, H.-J. Hecht, J. Reichelt and U. Bilitewski, in Electroanalytical Methods for Biological Materials, ed. J. Q. Chambers and A. Brajter-Toth, Marcel Dekker, New York, 2002, pp. 233–254 Search PubMed.
- B. Lu, E. I. Iwuoha, M. R. Smyth and R. O'Kennedy, Anal. Chim. Acta, 1997, 345, 59–66 CrossRef CAS.
- G.-D. Liu, Z.-Y. Wu, S.-P. Wang, G.-L. Shen and R.-Q. Yu, Anal. Chem., 2001, 73, 3219–3226 CrossRef CAS.
- C. A. Wijayawardhana, H. B. Halsall and W. R. Heineman, in Electroanalytical Methods for Biological Materials, ed. J. Q. Chambers and A. Brajter-Toth, Marcel Dekker, New York, 2002, pp. 195–231 Search PubMed.
- E. Crowley, C. O'Sullivan and G. G. Guilbault, Anal. Chem. Acta, 1999, 389, 171–178 Search PubMed.
- J. Liu, A. G. Rinzler, H. J. Dai, J. H. Hafner, R. K. Bradley, P. J. Boul, A. Lu, T. Iverson, K. Shelimov, C. B. Huffman, F. Rodriguez-Macias, Y-S. Shon, T. R. Lee, D. T. Colbert and R. E. Smalley, Science, 1998, 280, 1253–1256 CrossRef CAS.
- J. Liu, M. J. Casavant, M. Cox, D. A. Walters, P. Boul, W. Lu, A. J. Rimberg, K. A. Smith, D. T. Colbert and R. E. Smalley, Chem. Phys. Lett., 1999, 303, 125–129 CrossRef CAS.
- I. Galeska, D. Chattopadhyay, F. Moussy and F. Papadimitrakopoulos, Biomacromolecules, 2000, 1, 202–207 CrossRef CAS.
- M. S. Dresselhaus and P. C. Eklund, Adv. Phys., 2000, 49, 705–814 CrossRef CAS.
- H. Dai, E. W. Wong and C. M. Lieber, Science, 1996, 272, 523–526 CrossRef CAS.
- M. Freitag, A. T. Johnson, S. V. Kalinin and D. A. Bonnell, Phys. Rev. Lett., 2002, 89, 216801-1–216801-4.
- H. J. Choi, J. Ihm, S. G. Louie and M. L. Cohen, Phys. Rev. Lett., 2000, 84, 2917–2920 CrossRef CAS.
- R. Gaal, J. P. Salvetat and L. Forro, Phys. Rev. Sect. B, 2000, 61, 7320–7323 Search PubMed.
- J. B. Schenkman, I. Jansson, Y. Lvov, J. F. Rusling, S. Boussaad and N. J. Tao, Arch. Biochem. Biophys., 2001, 385, 78–87 CrossRef CAS.
- (a) J. F. Rusling and Z. Zhang, in Handbook Of Surfaces And Interfaces Of Materials, ed. R. W. Nalwa, Academic Press, San Diego, 2001, vol. 5, Biomolecules, Biointerfaces, and Applications, pp. 33–71 Search PubMed; (b) J. F. Rusling and Z. Zhang, in Electroanalytical Methods for Biological Materials, ed. J. Q. Chambers and A. Brajter-Toth, Marcel Dekker, New York, 2002, pp. 233–254 Search PubMed.
- H. Luo, Z. Shi, N. Li, Z. Gu and Q. Zhuang, Anal. Chem., 2001, 73, 915–920 CrossRef CAS.
- Z. Zhang, S. Chouchane, R. S Magliozzo and J. F. Rusling, Anal. Chem., 2002, 74, 163–170 CrossRef CAS.
- pH 7 buffer was used for storage since we have observed that SWNT bundles will migrate and forest surface morphology will change if kept in an acidic environment.
- B. J. Lindsey, in Clinical chemistry: Principles, procedures, correlation, ed. M. L. Bishop, J. L. Duben-Engelkirk and E. P. Fody, J. B. Lippincott Co, Philadelphia, 1996, pp. 169–214 Search PubMed.
- L. Pederson and P. Sorensen, Acta Oncol., 2000, 39, 145–149 Search PubMed.
- T. Uda, R. Kanmei, S. Akasofu, E. Hifumi and M. Ohtaki, Anal. Biochem., 1994, 218, 259–264 CrossRef CAS.
- M. B. Gomes, T. Dimetz, M. R. Luchetti, M. F. Goncalves, H. Gazzola and H. Matos, Ann. Clin. Biochem., 1998, 35, 434–435.
- Human Serum Albumin Assay Kit, Bethyl Laboratories, Mongomery Texas, www.bethyl.com.
- W. Welsch, C. Klein, M. von Schickfus and S. Hunklinger, Anal. Chem., 1996, 68, 2000–2004 CrossRef CAS.
Footnote |
| † Electronic supplementary information (ESI) available: Additional experimental details and Figs S1–S4 including section analysis of the SWNT forest, cyclic voltammograms of SWNT/Mb and SWNT/HRP films, and data for mediated catalytic electrochemical responses to hydrogen peroxide. See http://www.rsc.org/suppdata/mb/b5/b502124c/ |
| This journal is © The Royal Society of Chemistry 2005 |